Uncovering the Hidden Gems within CWDS Workforce
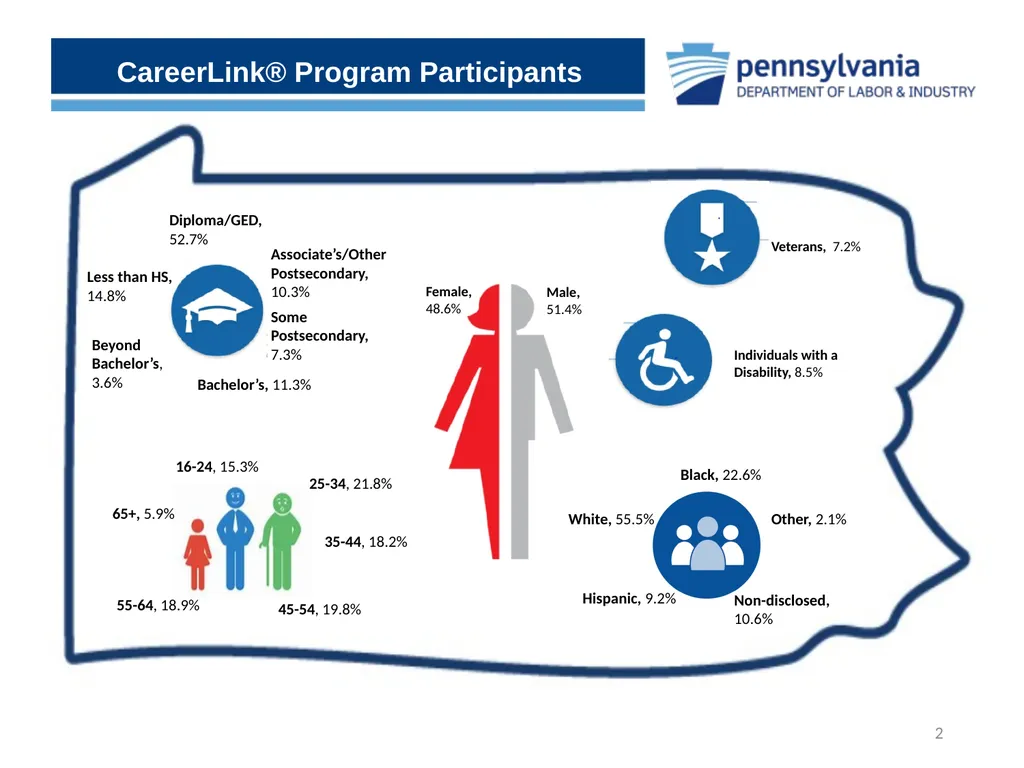
Description: Uncovering the Hidden Gems within CWDS Workforce Information Forum Sandie Fairman and Eliza Arentz November 20, 2019 CareerLink Program Participants 2 Female, 48.6 Male, 51.4 DiplomaGED, 52.7 Less than HS, 14.8 Bachelors, 11.3
Related Topics
Download Presentation
"Uncovering the Hidden Gems within CWDS Workforce" is the property of its rightful owner. Permission is granted to download and print the materials on this website for personal, non-commercial use only, and to display it on your personal computer provided you do not modify the materials and that you retain all copyright notices contained in the materials. By downloading content from our website, you accept the terms of this agreement.
Presentation Transcript
slide1. Uncovering the Hidden Gems within CWDS Workforce Information Forum
Sandie Fairman and Eliza Arentz
November 20, 2019<br>
slide2. CareerLink® Program Participants 2 Female, 48.6% Male, 51.4% Diploma/GED, 52.7% Less than HS, 14.8% Bachelor’s, 11.3% Beyond Bachelor’s, 3.6% Associate’s/Other Postsecondary, 10.3% Some Postsecondary, 7.3% Veterans, 7.2% Individuals with a Disability, 8.5% Hispanic, 9.2% Other, 2.1% Black, 22.6% Non-disclosed, 10.6% White, 55.5% 16-24, 15.3% 25-34, 21.8% 35-44, 18.2% 45-54, 19.8% 55-64, 18.9% 65+, 5.9%<br>
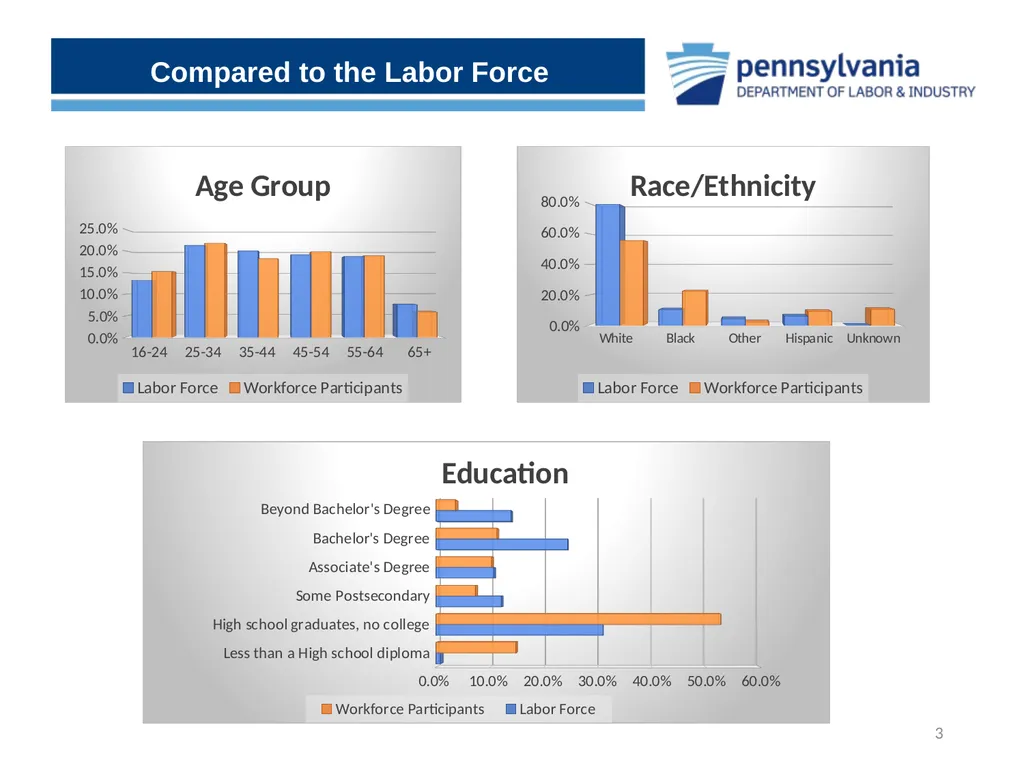
slide3. Compared to the Labor Force 3<br>
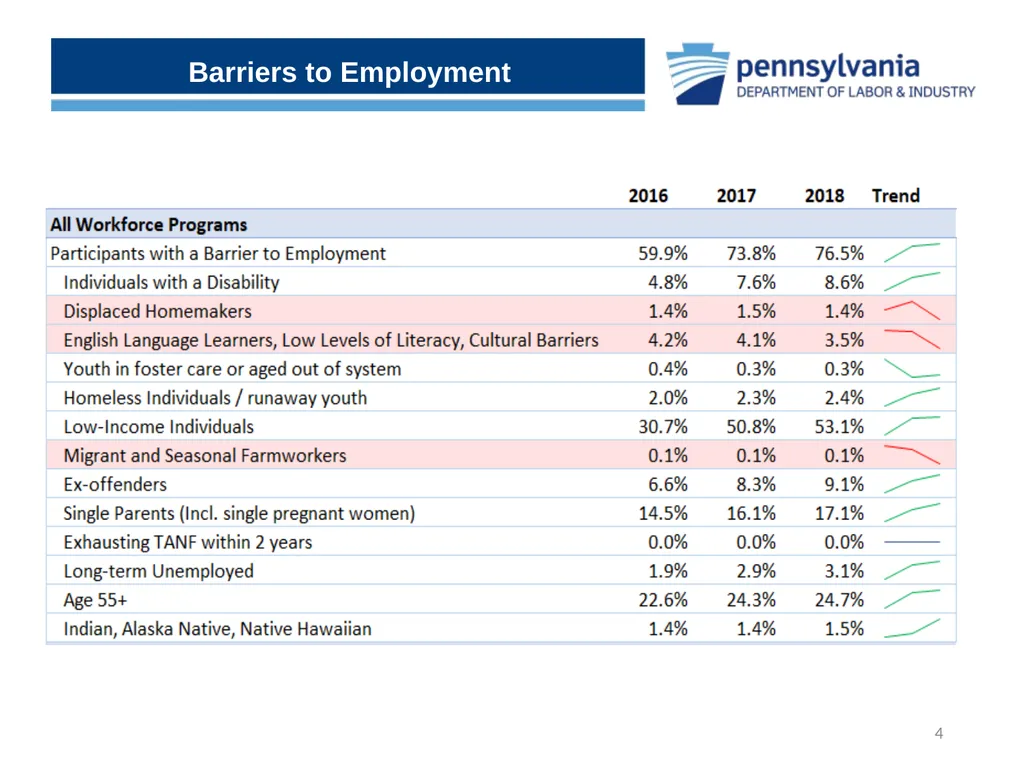
slide4. Barriers to Employment 4<br>
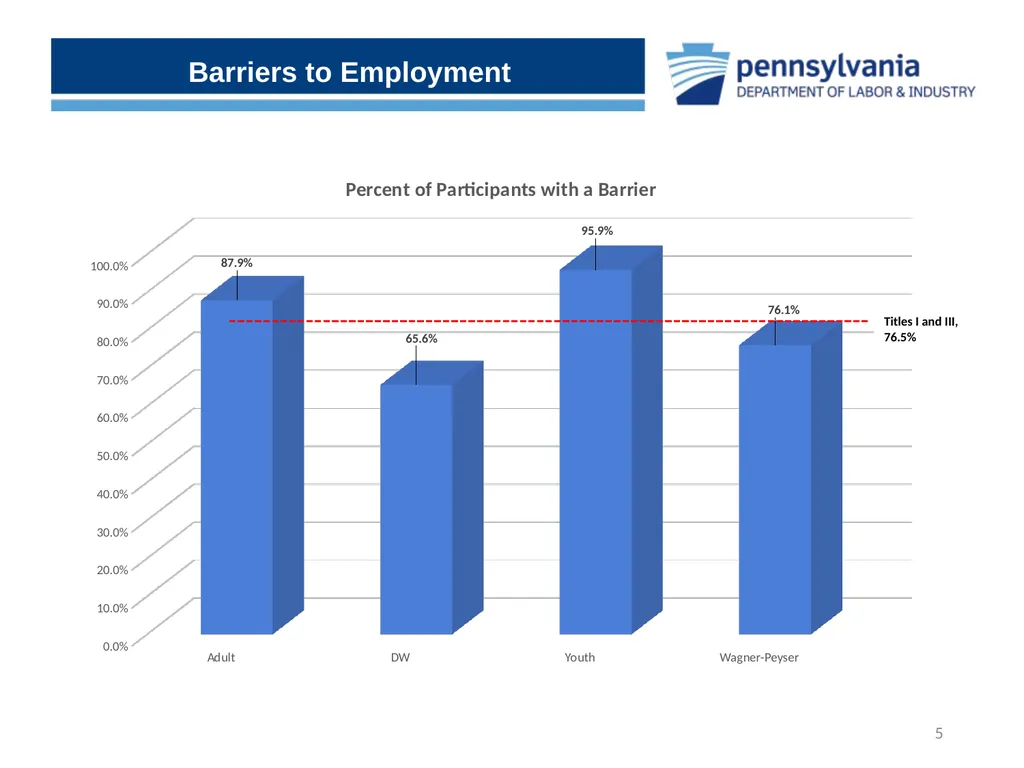
slide5. Barriers to Employment 5 Titles I and III, 76.5%<br>
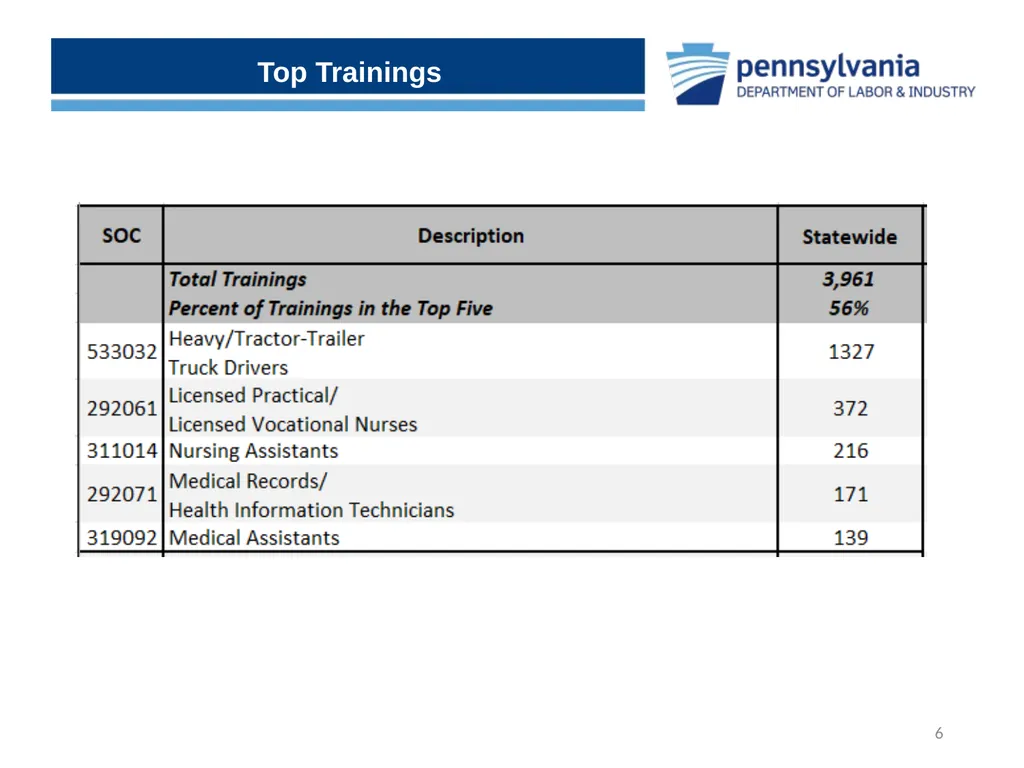
slide6. Top Trainings 6<br>
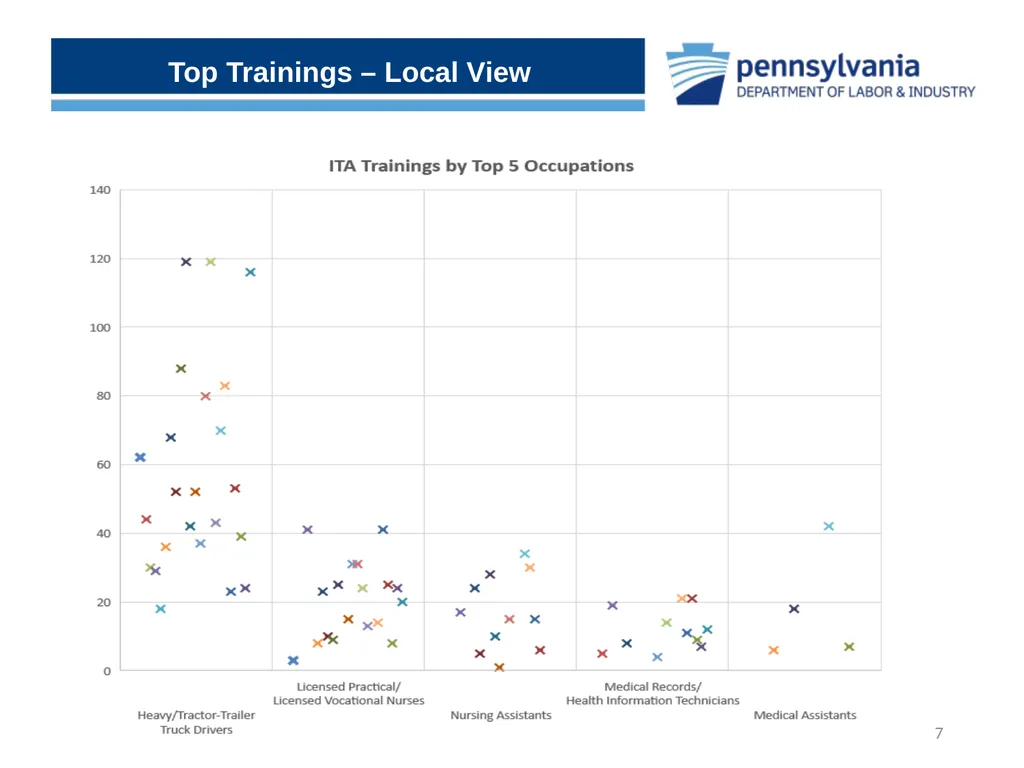
slide7. Top Trainings – Local View 7<br>
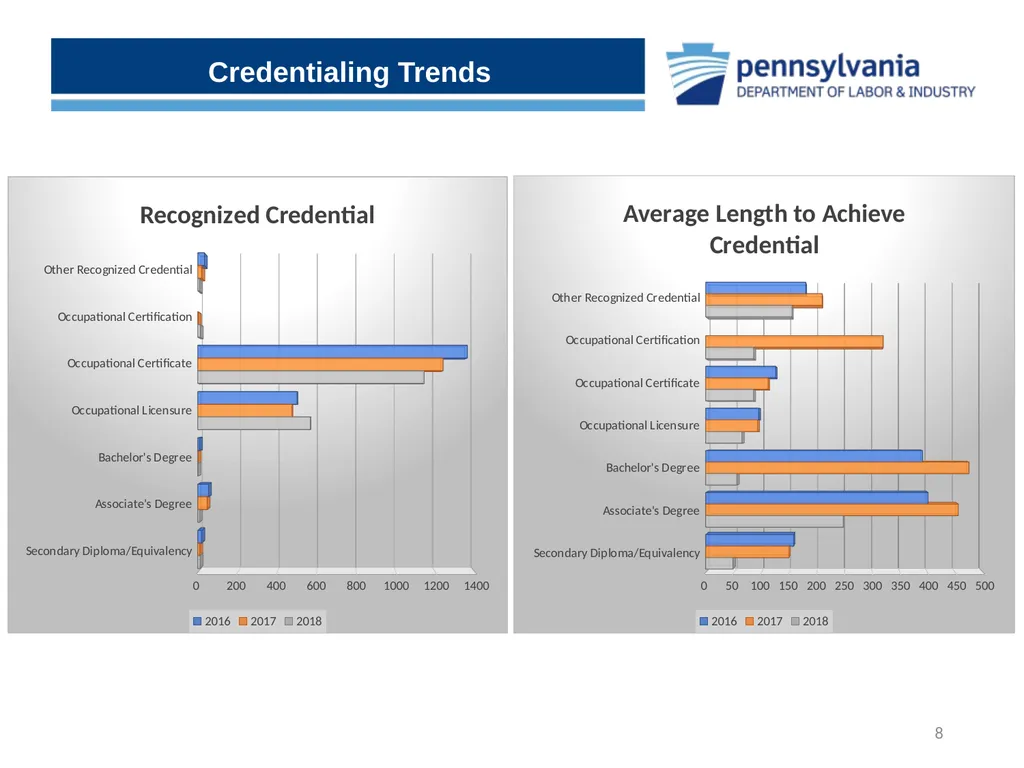
slide8. Credentialing Trends 8<br>
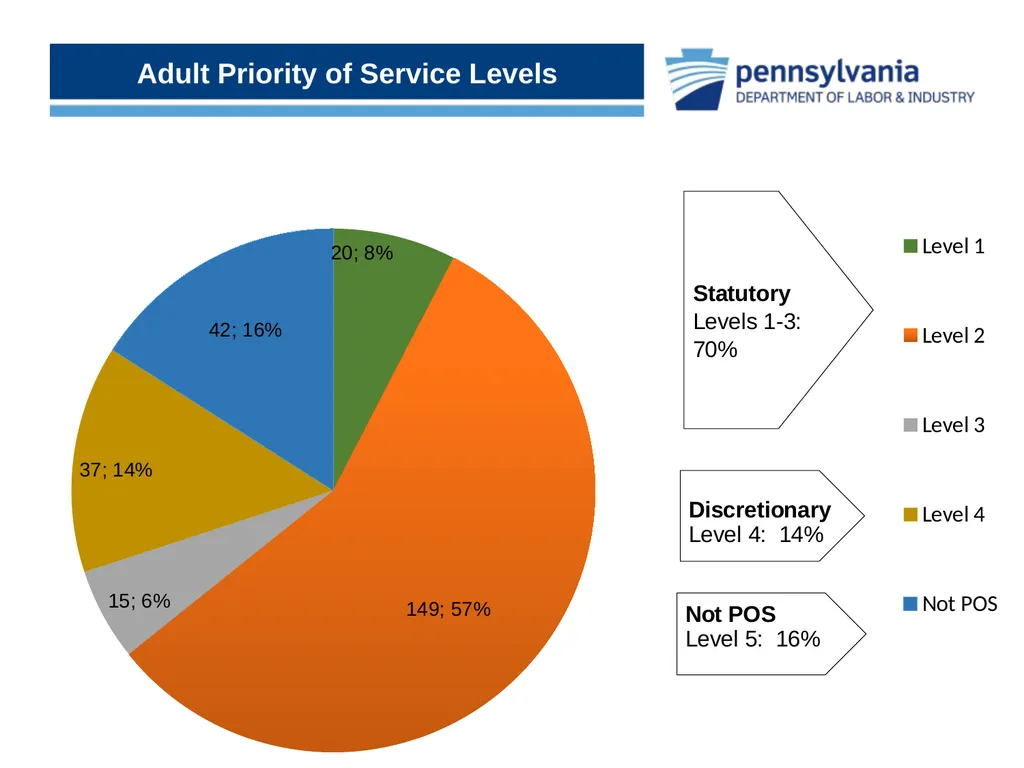
slide9. Adult Priority of Service Levels 9<br>
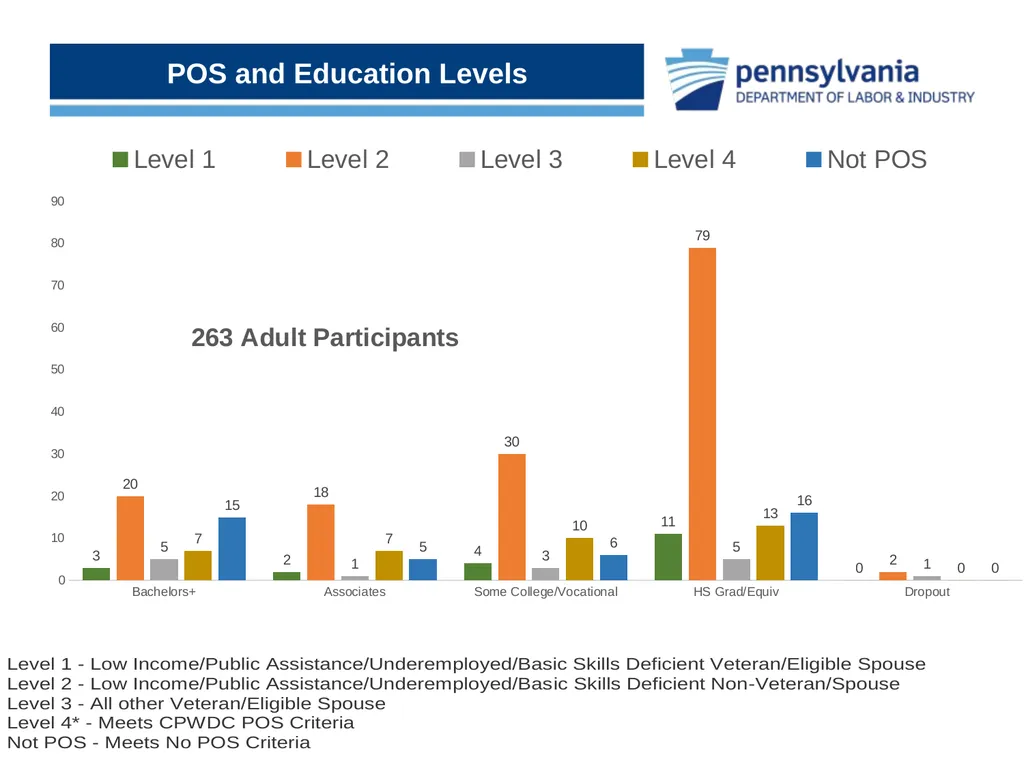
slide10. POS and Education Levels 10<br>
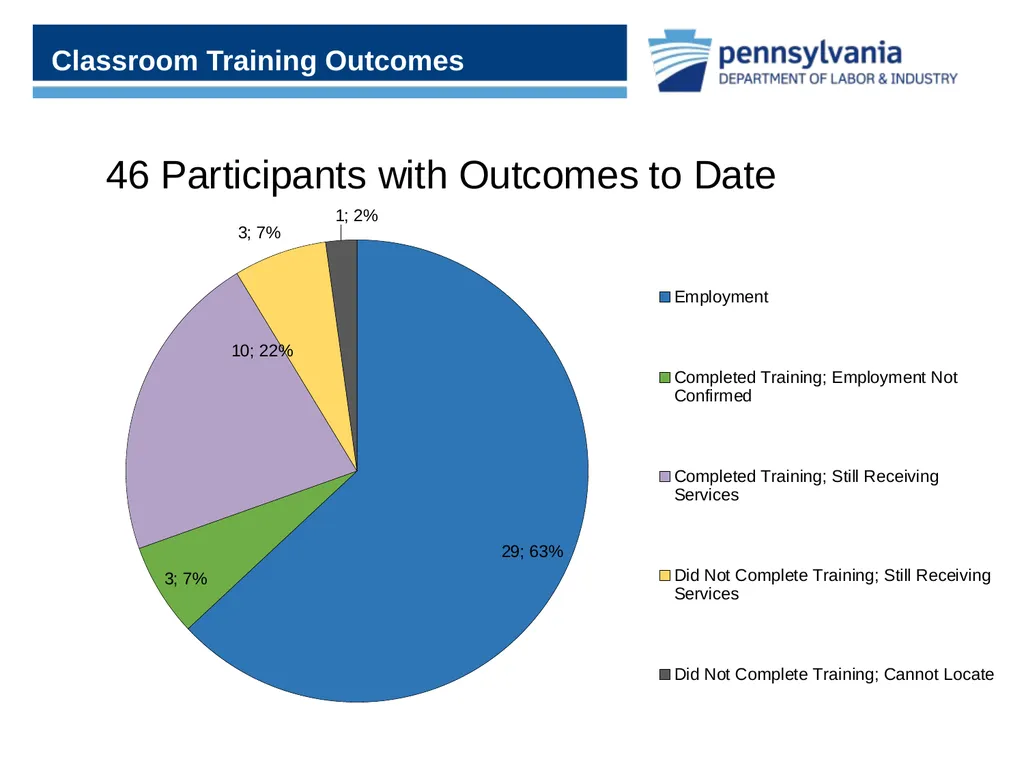
slide11. Classroom Training Outcomes<br>
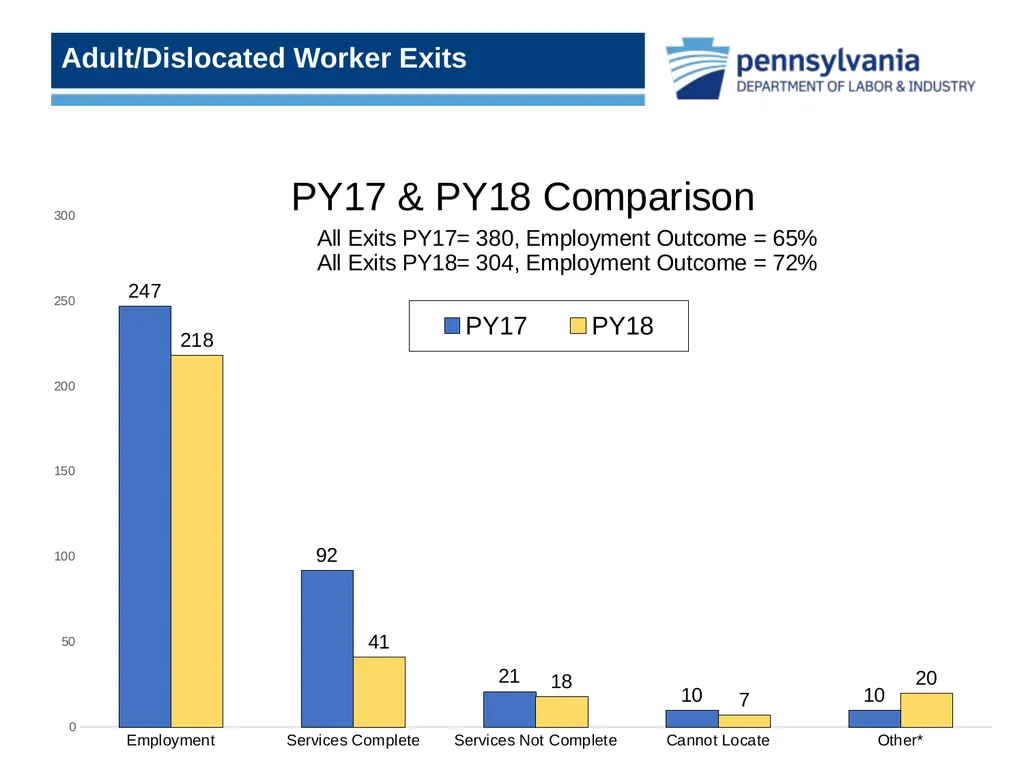
slide12. Adult/Dislocated Worker Exits<br>
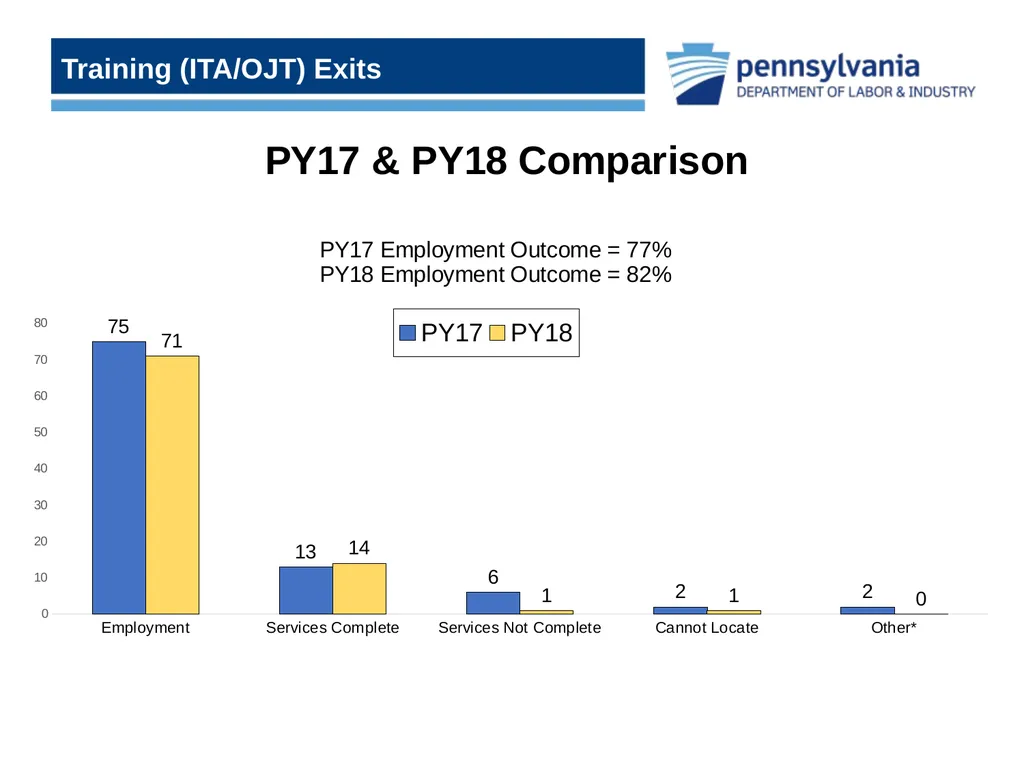
slide13. Training (ITA/OJT) Exits<br>
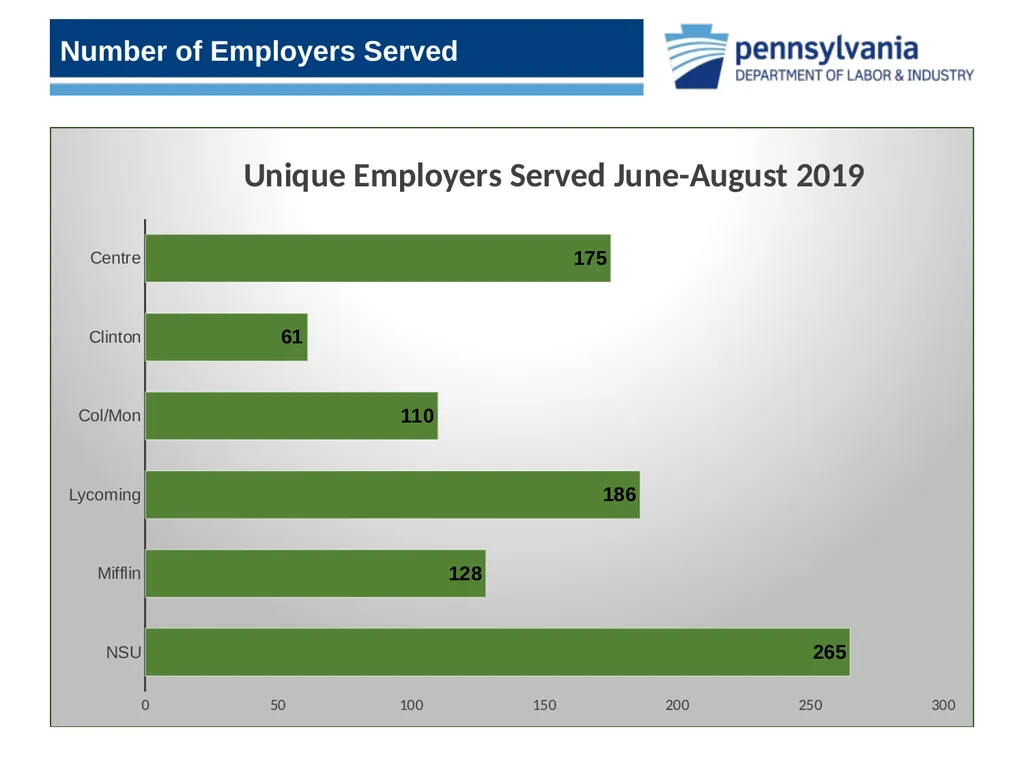
slide14. Number of Employers Served<br>
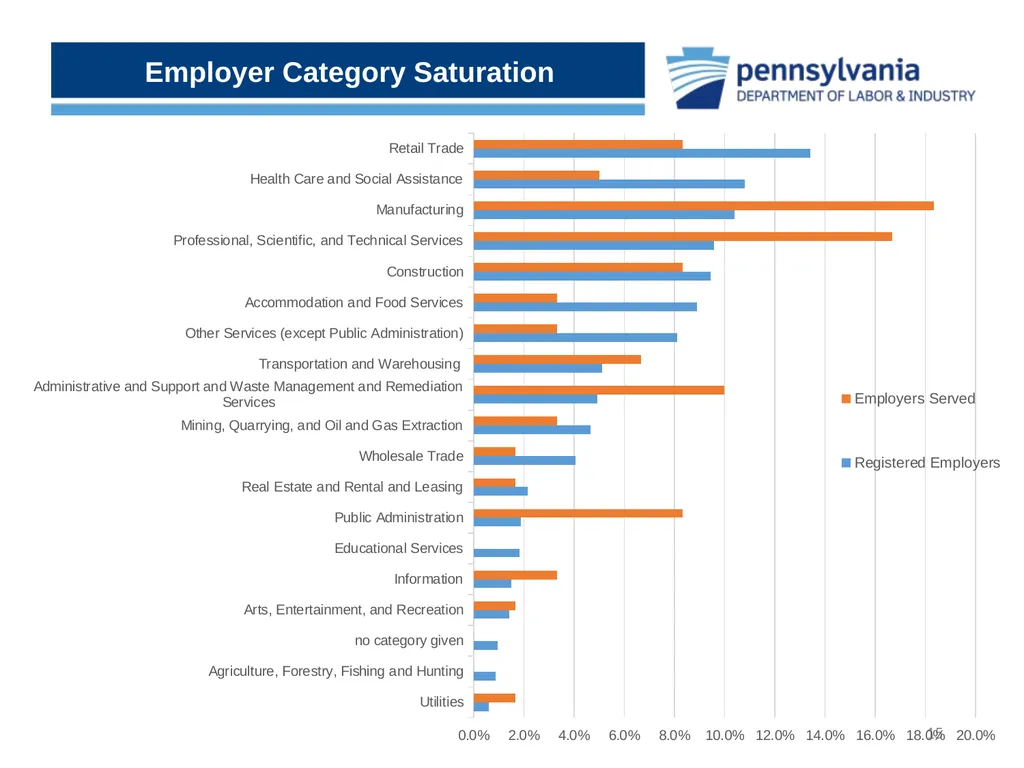
slide15. Employer Category Saturation 15<br>
Sandie Fairman and Eliza Arentz
November 20, 2019<br>
slide2. CareerLink® Program Participants 2 Female, 48.6% Male, 51.4% Diploma/GED, 52.7% Less than HS, 14.8% Bachelor’s, 11.3% Beyond Bachelor’s, 3.6% Associate’s/Other Postsecondary, 10.3% Some Postsecondary, 7.3% Veterans, 7.2% Individuals with a Disability, 8.5% Hispanic, 9.2% Other, 2.1% Black, 22.6% Non-disclosed, 10.6% White, 55.5% 16-24, 15.3% 25-34, 21.8% 35-44, 18.2% 45-54, 19.8% 55-64, 18.9% 65+, 5.9%<br>
slide3. Compared to the Labor Force 3<br>
slide4. Barriers to Employment 4<br>
slide5. Barriers to Employment 5 Titles I and III, 76.5%<br>
slide6. Top Trainings 6<br>
slide7. Top Trainings – Local View 7<br>
slide8. Credentialing Trends 8<br>
slide9. Adult Priority of Service Levels 9<br>
slide10. POS and Education Levels 10<br>
slide11. Classroom Training Outcomes<br>
slide12. Adult/Dislocated Worker Exits<br>
slide13. Training (ITA/OJT) Exits<br>
slide14. Number of Employers Served<br>
slide15. Employer Category Saturation 15<br>