
Value for Customers & Valuing Customers Measuring
LO
Published · 73 slides · 0 views
1 / 1

Description
Value for Customers Valuing Customers Measuring value for customers Measuring value of customers (CLV) Targeting based on customer value Quotes for the Day Anyone can measure the number of seeds in an apple. Who can measure the number of
Related Topics
Share
Embed code
Download this presentation From Below
"Value for Customers & Valuing Customers Measuring" is the property of its rightful owner. Permission is granted to download and print the materials on this website for personal, non-commercial use only, and to display it on your personal computer provided you do not modify the materials and that you retain all copyright notices contained in the materials. By downloading content from our website, you accept the terms of this agreement.
Presentation Transcript
01
Value for Customers &
Valuing Customers Measuring value for customers
Measuring value of customers (CLV)
Targeting based on customer value<br>
Measuring value of customers (CLV)
Targeting based on customer value<br>
02
Quotes for the Day Anyone can measure the number of seeds in an apple. Who can measure the number of apples in a seed?
--Anon
Price is an observable description of a state of the market. Customer value is the hidden source of ideas about what to do to make a market more profitable for the business.<br>
--Anon
Price is an observable description of a state of the market. Customer value is the hidden source of ideas about what to do to make a market more profitable for the business.<br>
03
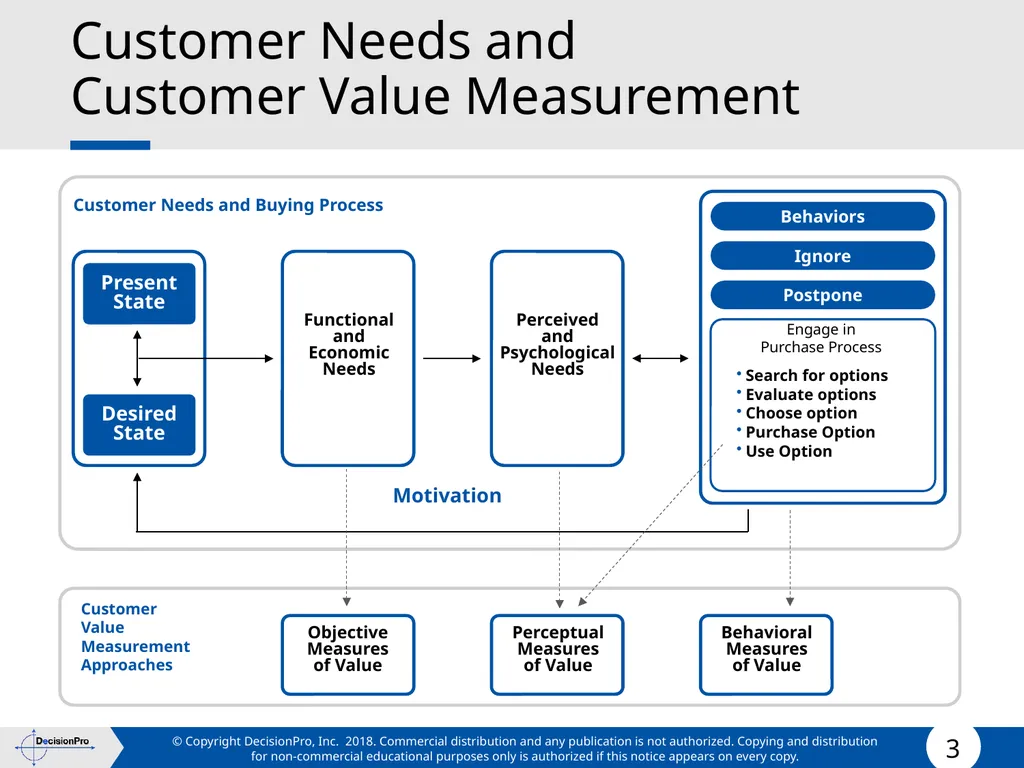
Customer Needs and
Customer Value Measurement Desired
State Present
State Behaviors Engage in
Purchase Process Search for options
Evaluate options
Choose option
Purchase Option
Use Option Ignore Postpone Customer Needs and Buying Process Functional
and
Economic
Needs Perceived
and
Psychological
Needs Objective
Measures
of Value Perceptual
Measures
of Value Behavioral
Measures
of Value Customer
Value
Measurement
Approaches Motivation<br>
State Present
State Behaviors Engage in
Purchase Process Search for options
Evaluate options
Choose option
Purchase Option
Use Option Ignore Postpone Customer Needs and Buying Process Functional
and
Economic
Needs Perceived
and
Psychological
Needs Objective
Measures
of Value Perceptual
Measures
of Value Behavioral
Measures
of Value Customer
Value
Measurement
Approaches Motivation<br>
04
Definition of Objective Customer Value The hypothetical price for a supplier’s offering at which a particular customer would be at overall economic break-even relative to the best alternative available to that customer for performing a set of functions.
This approach to measuring customer value is typically useful in B2B situations.<br>
This approach to measuring customer value is typically useful in B2B situations.<br>
05
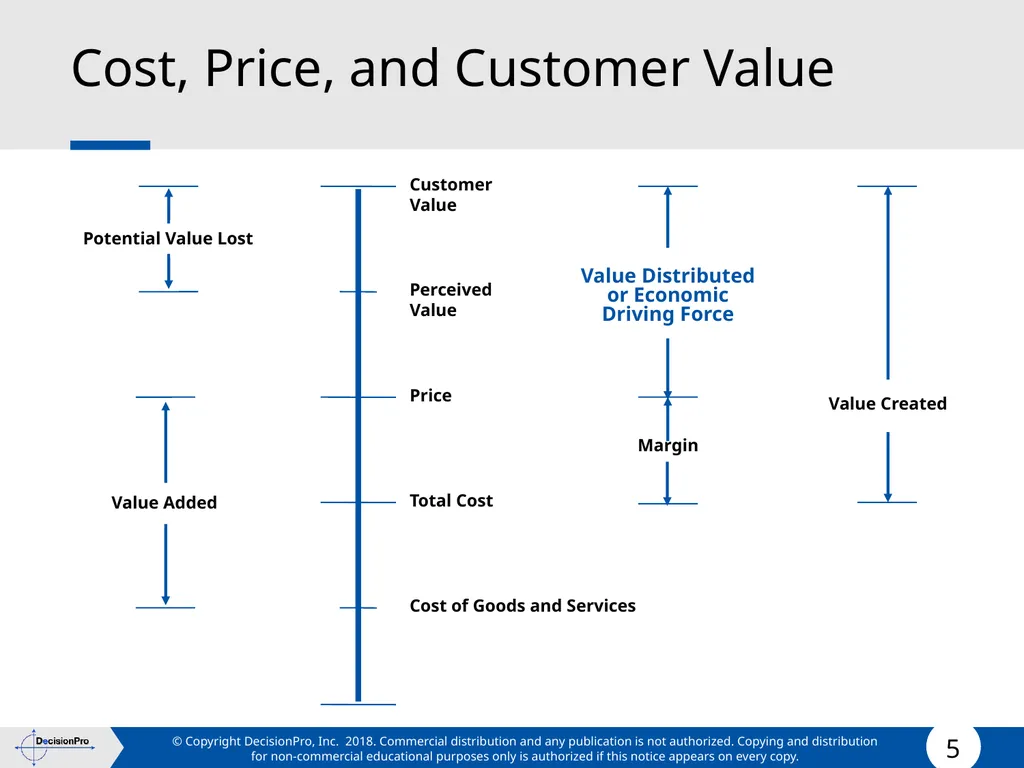
Cost, Price, and Customer Value Customer Value Perceived Value Price Total Cost Cost of Goods and Services Value Created Value Distributed or Economic Driving Force Margin Potential Value Lost Value Added<br>
06
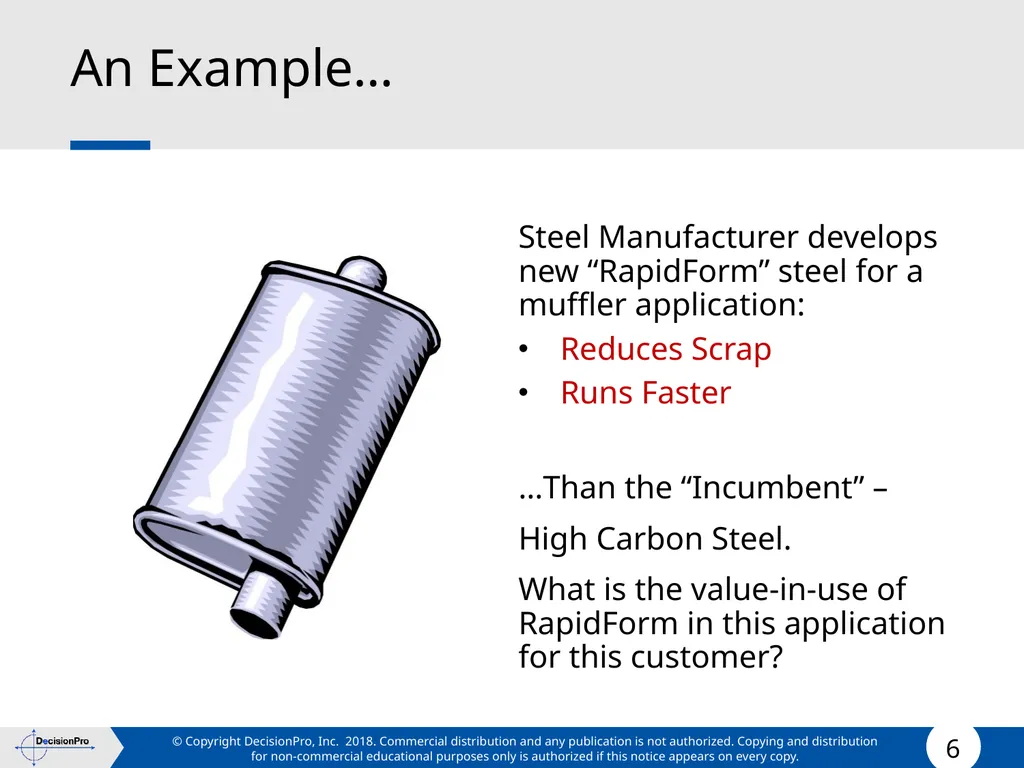
An Example… Steel Manufacturer develops new “RapidForm” steel for a muffler application:
Reduces Scrap
Runs Faster
…Than the “Incumbent” –
High Carbon Steel.
What is the value-in-use of RapidForm in this application for this customer?<br>
Reduces Scrap
Runs Faster
…Than the “Incumbent” –
High Carbon Steel.
What is the value-in-use of RapidForm in this application for this customer?<br>
07
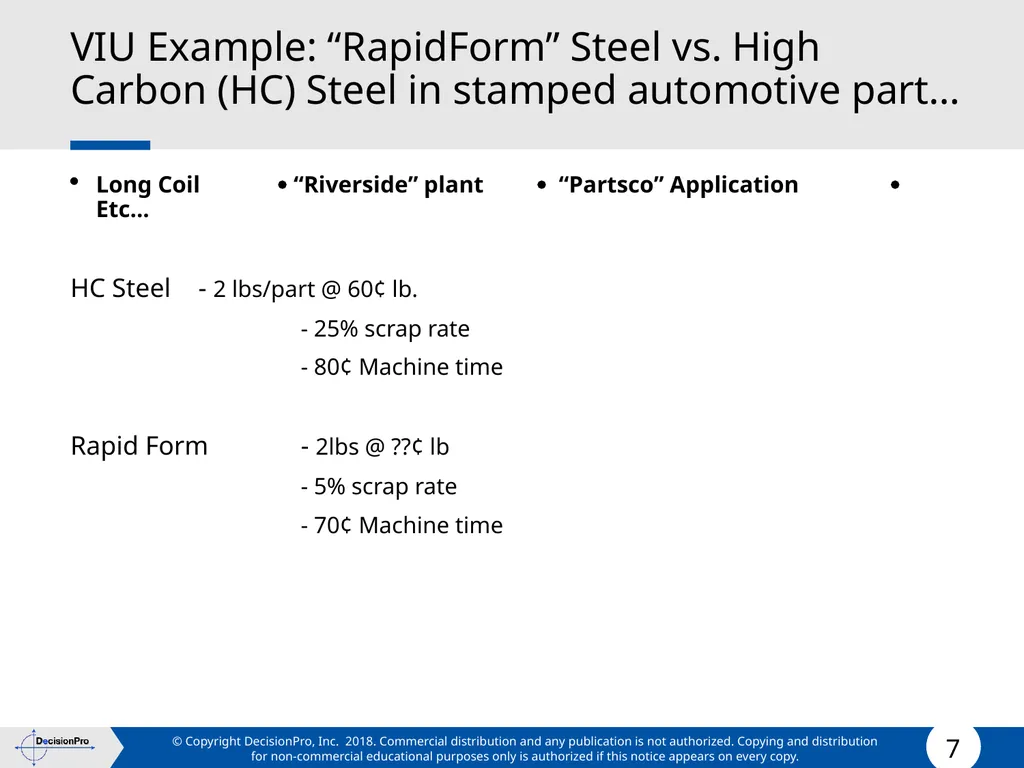
VIU Example: “RapidForm” Steel vs. High Carbon (HC) Steel in stamped automotive part… Long Coil “Riverside” plant “Partsco” Application Etc...
HC Steel - 2 lbs/part @ 60¢ lb.
- 25% scrap rate
- 80¢ Machine time
Rapid Form - 2lbs @ ??¢ lb
- 5% scrap rate
- 70¢ Machine time<br>
HC Steel - 2 lbs/part @ 60¢ lb.
- 25% scrap rate
- 80¢ Machine time
Rapid Form - 2lbs @ ??¢ lb
- 5% scrap rate
- 70¢ Machine time<br>
08
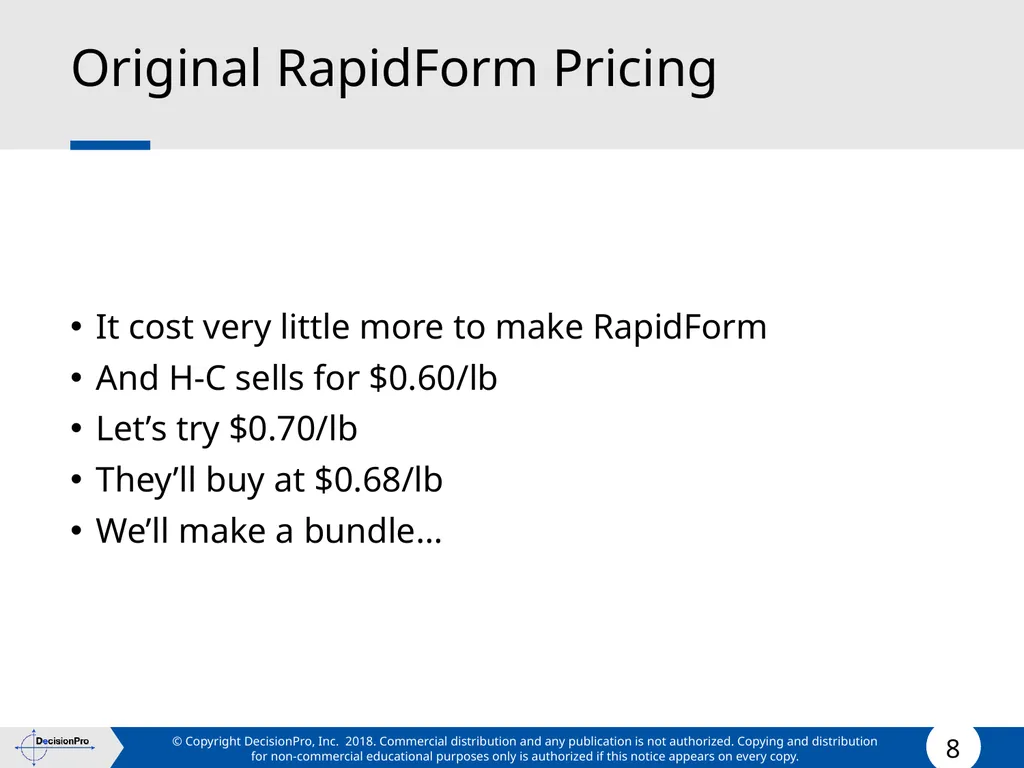
Original RapidForm Pricing It cost very little more to make RapidForm
And H-C sells for $0.60/lb
Let’s try $0.70/lb
They’ll buy at $0.68/lb
We’ll make a bundle…<br>
And H-C sells for $0.60/lb
Let’s try $0.70/lb
They’ll buy at $0.68/lb
We’ll make a bundle…<br>
09
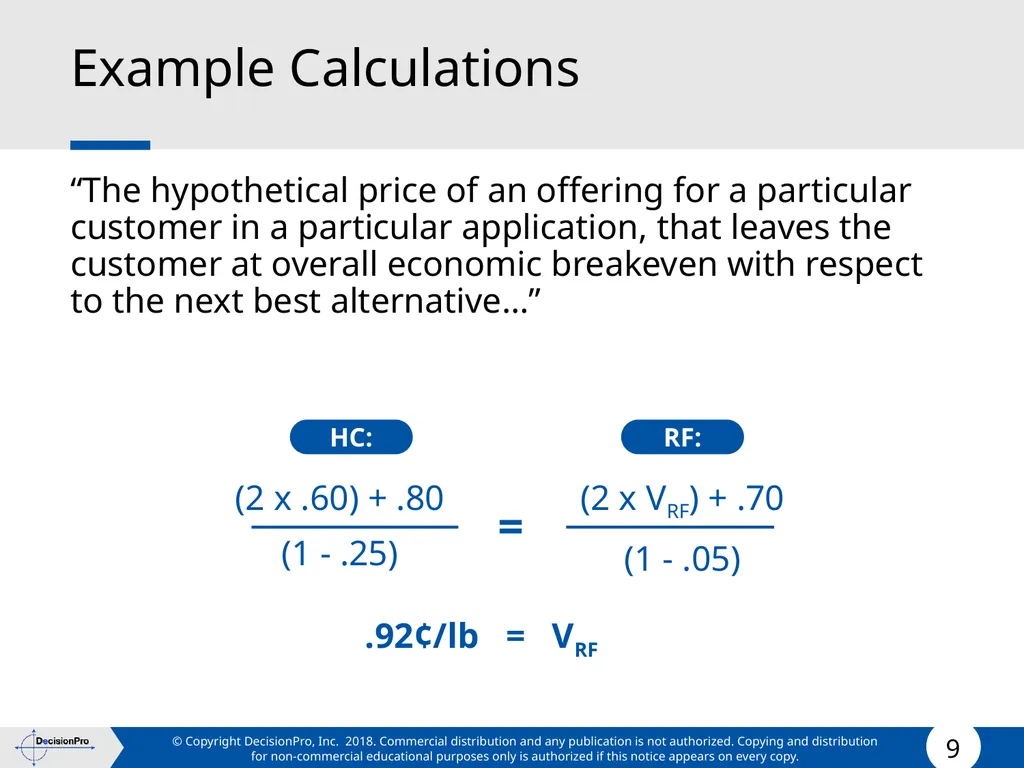
Example Calculations “The hypothetical price of an offering for a particular customer in a particular application, that leaves the customer at overall economic breakeven with respect to the next best alternative…” HC: .92¢/lb = VRF (2 x .60) + .80
(1 - .25) = (2 x VRF) + .70
(1 - .05) RF:<br>
(1 - .25) = (2 x VRF) + .70
(1 - .05) RF:<br>
10
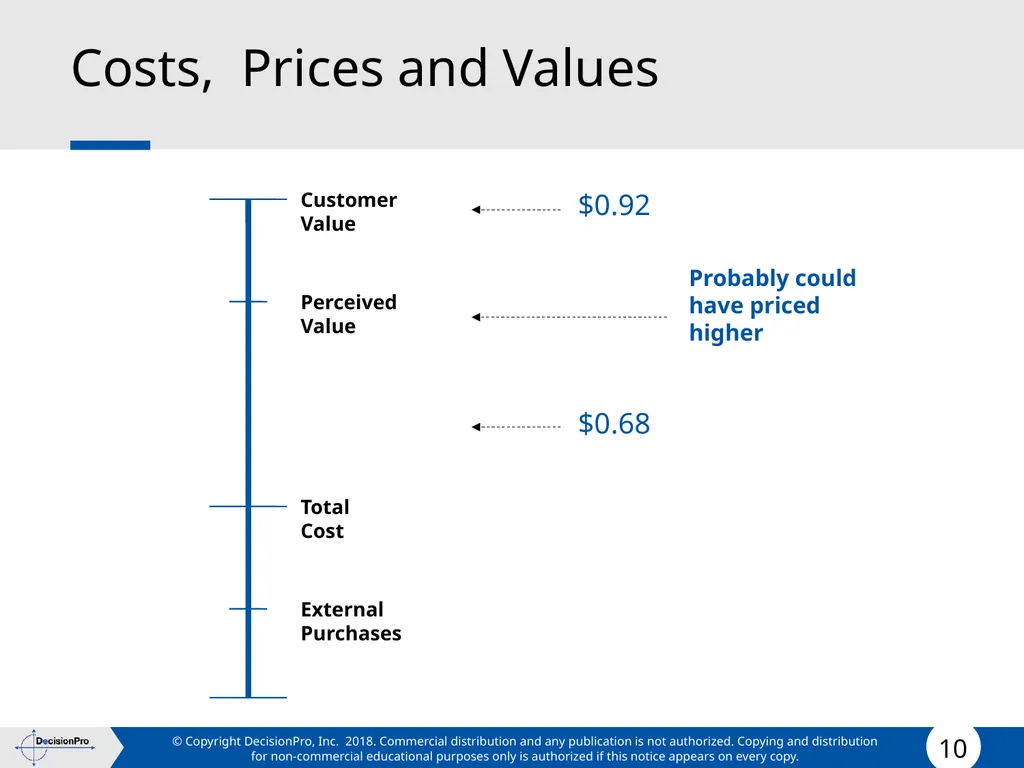
Costs, Prices and Values Customer Value Perceived Value Total Cost External Purchases $0.92 $0.68 Probably could have priced higher<br>
11
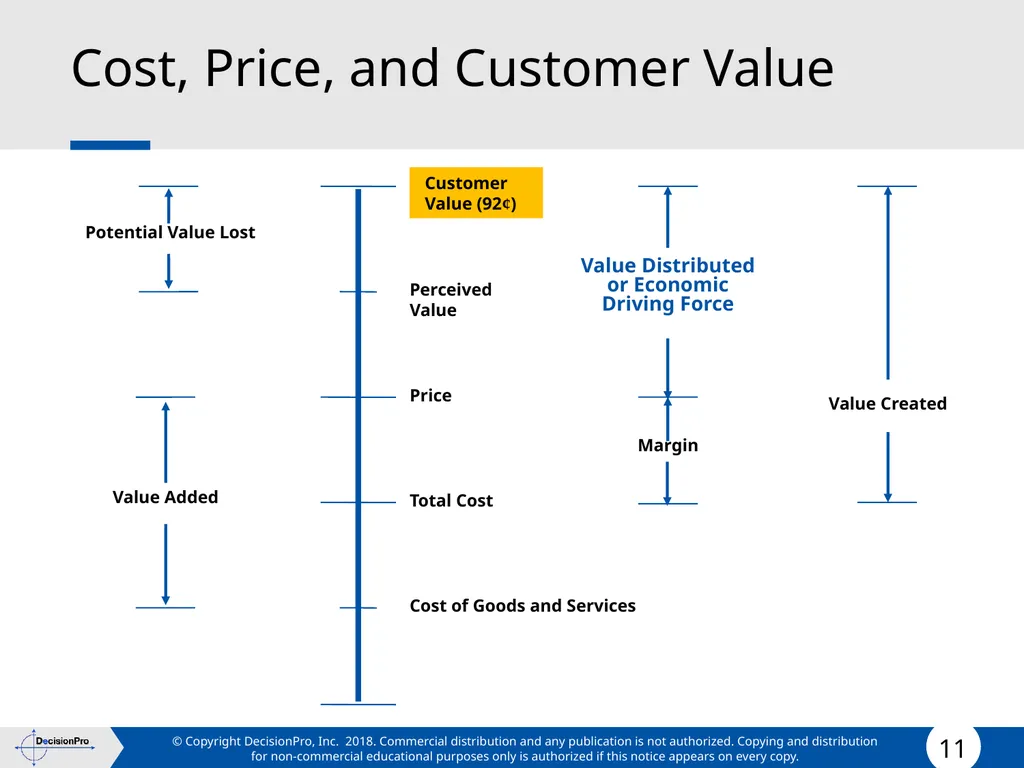
Cost, Price, and Customer Value Customer Value (92¢) Perceived Value Price Total Cost Cost of Goods and Services Value Created Value Distributed or Economic Driving Force Margin Potential Value Lost Value Added<br>
12
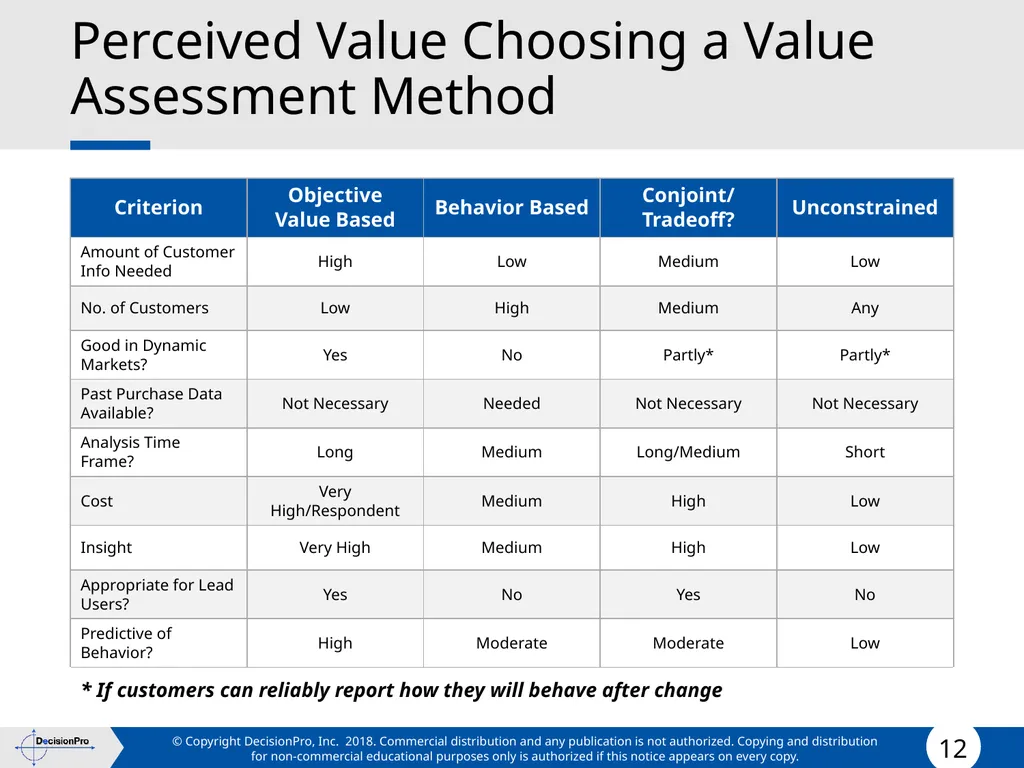
Perceived Value Choosing a Value Assessment Method<br>
13
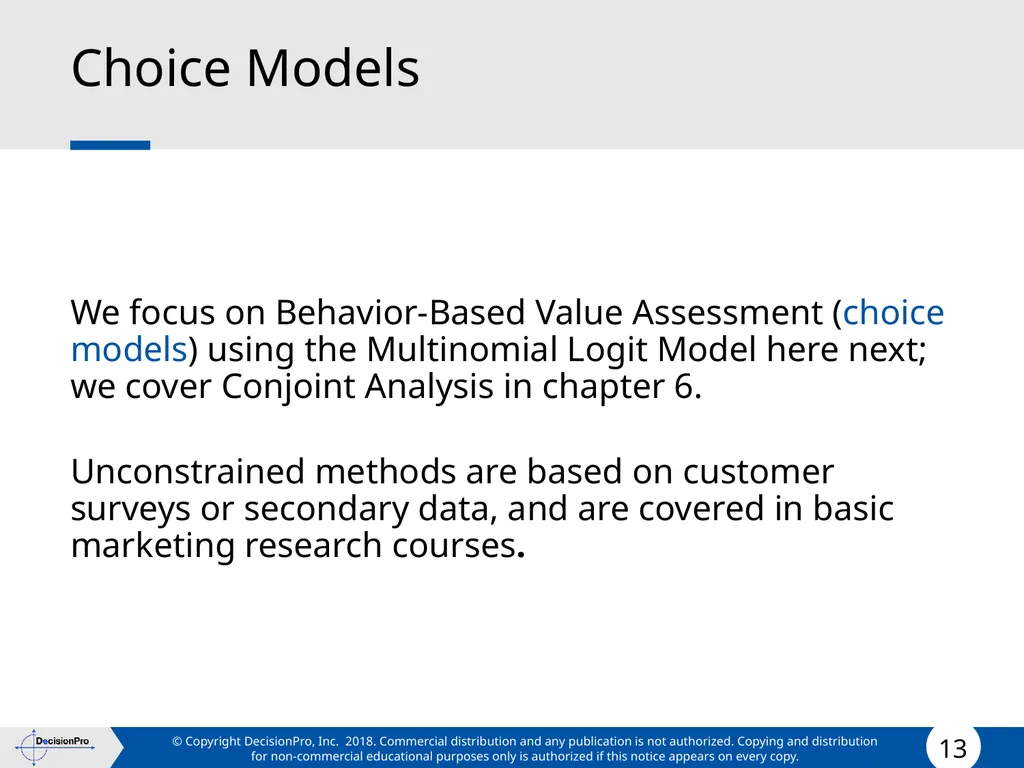
Choice Models We focus on Behavior-Based Value Assessment (choice models) using the Multinomial Logit Model here next; we cover Conjoint Analysis in chapter 6.
Unconstrained methods are based on customer surveys or secondary data, and are covered in basic marketing research courses.<br>
Unconstrained methods are based on customer surveys or secondary data, and are covered in basic marketing research courses.<br>
14
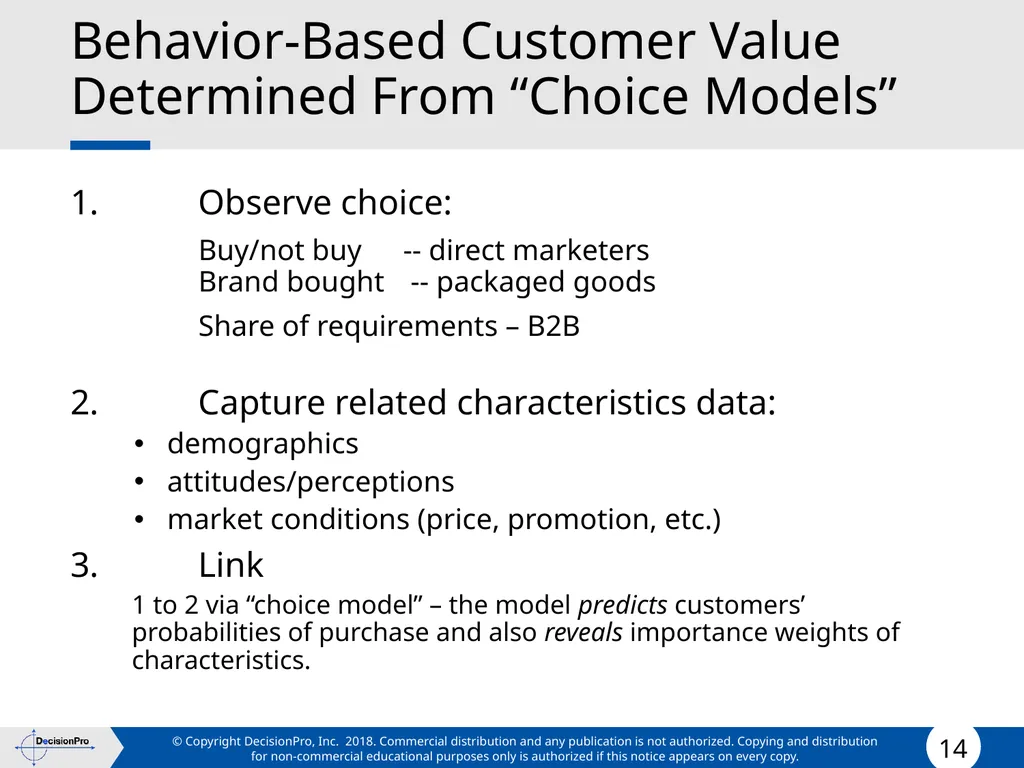
Behavior-Based Customer Value Determined From “Choice Models” 1. Observe choice:
Buy/not buy -- direct marketers Brand bought -- packaged goods
Share of requirements – B2B
2. Capture related characteristics data:
demographics
attitudes/perceptions
market conditions (price, promotion, etc.)
3. Link
1 to 2 via “choice model” – the model predicts customers’ probabilities of purchase and also reveals importance weights of characteristics.<br>
Buy/not buy -- direct marketers Brand bought -- packaged goods
Share of requirements – B2B
2. Capture related characteristics data:
demographics
attitudes/perceptions
market conditions (price, promotion, etc.)
3. Link
1 to 2 via “choice model” – the model predicts customers’ probabilities of purchase and also reveals importance weights of characteristics.<br>
15
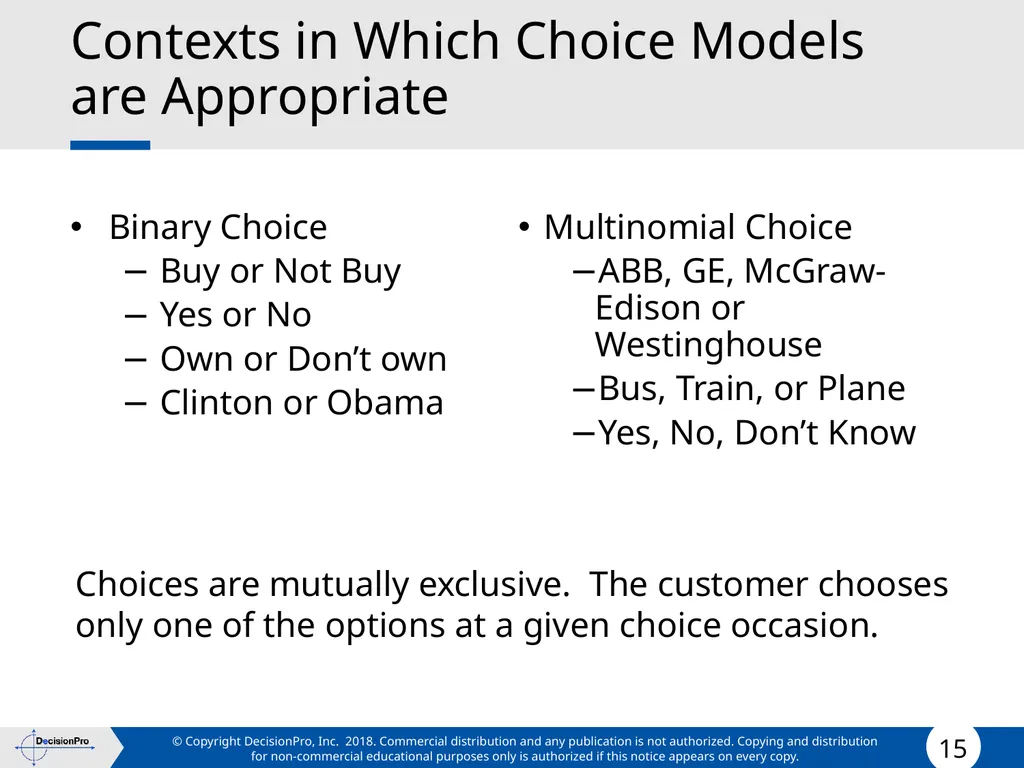
Contexts in Which Choice Models are Appropriate Binary Choice
Buy or Not Buy
Yes or No
Own or Don’t own
Clinton or Obama Multinomial Choice
ABB, GE, McGraw-Edison or Westinghouse
Bus, Train, or Plane
Yes, No, Don’t Know Choices are mutually exclusive. The customer chooses only one of the options at a given choice occasion.<br>
Buy or Not Buy
Yes or No
Own or Don’t own
Clinton or Obama Multinomial Choice
ABB, GE, McGraw-Edison or Westinghouse
Bus, Train, or Plane
Yes, No, Don’t Know Choices are mutually exclusive. The customer chooses only one of the options at a given choice occasion.<br>
16
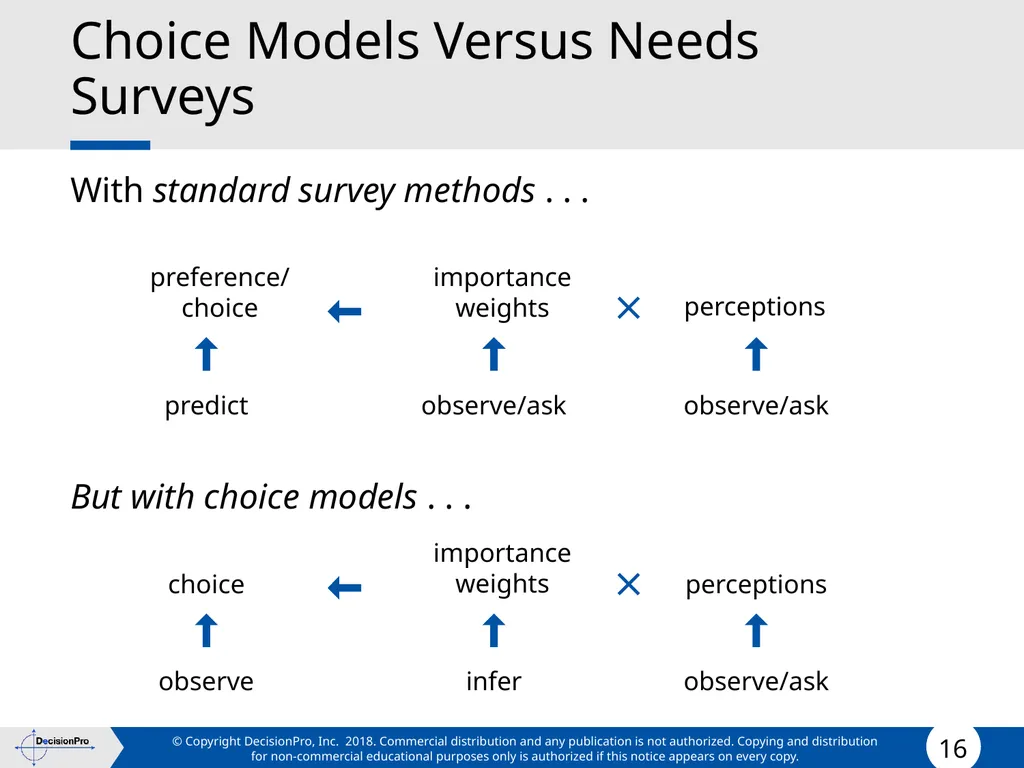
Choice Models Versus Needs Surveys With standard survey methods . . .
But with choice models . . . preference/ choice importance weights perceptions predict observe/ask observe/ask choice importance weights perceptions observe infer observe/ask<br>
But with choice models . . . preference/ choice importance weights perceptions predict observe/ask observe/ask choice importance weights perceptions observe infer observe/ask<br>
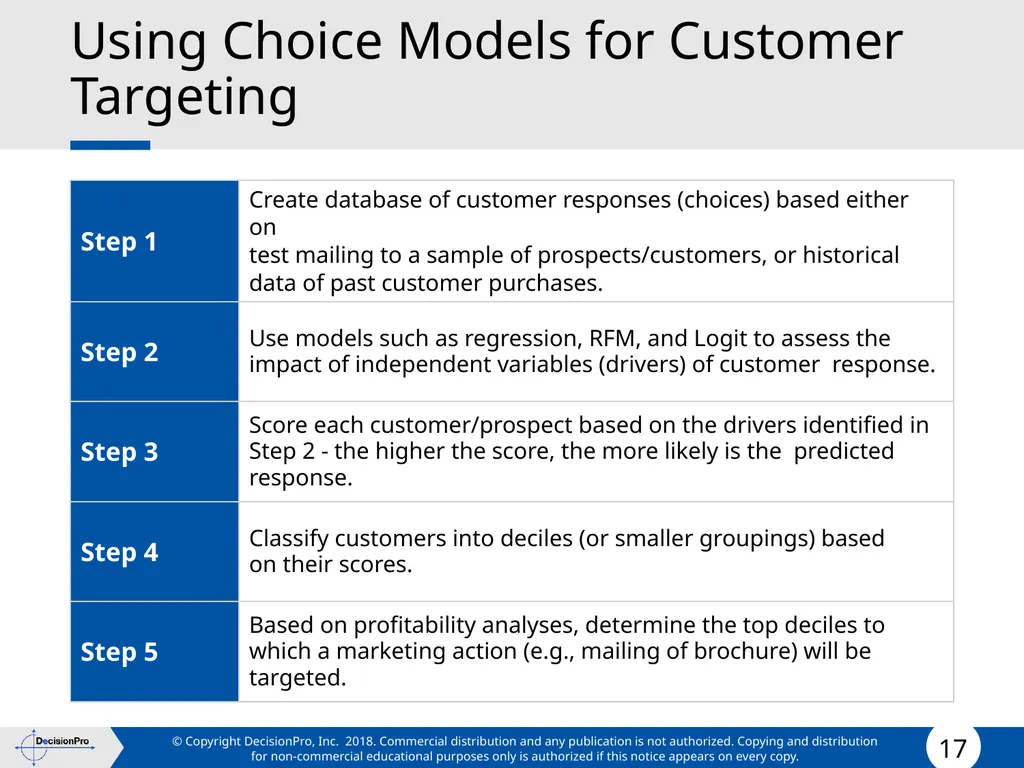
17
Using Choice Models for Customer Targeting<br>
18
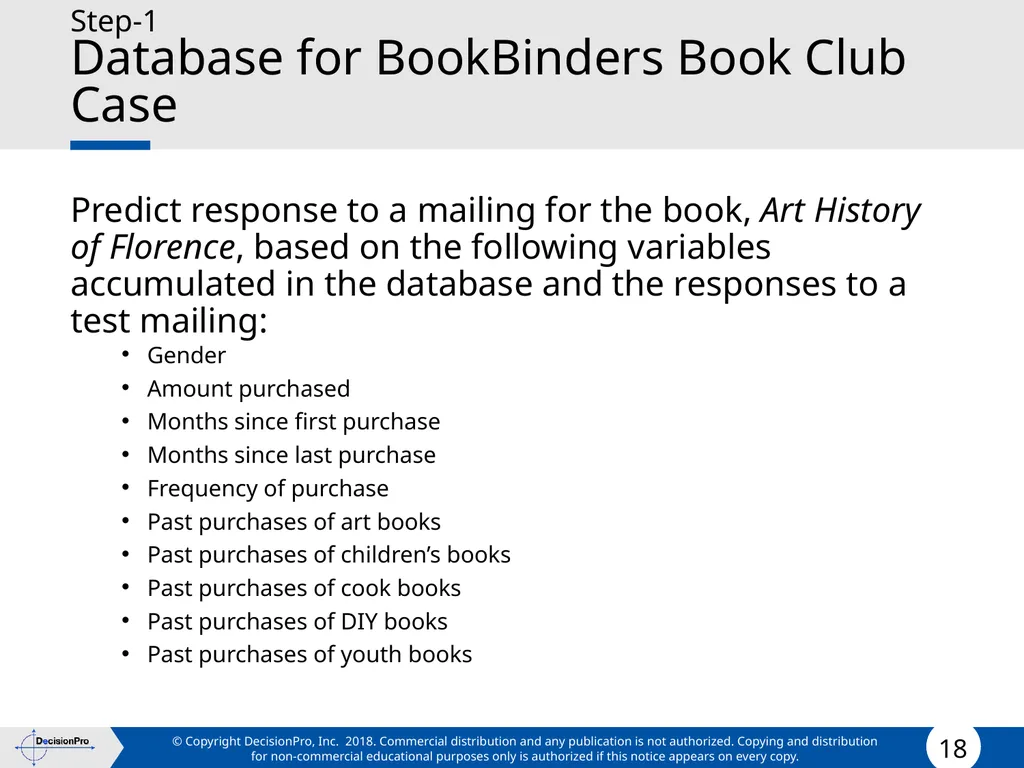
Step-1
Database for BookBinders Book Club Case Predict response to a mailing for the book, Art History of Florence, based on the following variables accumulated in the database and the responses to a test mailing:
Gender
Amount purchased
Months since first purchase
Months since last purchase
Frequency of purchase
Past purchases of art books
Past purchases of children’s books
Past purchases of cook books
Past purchases of DIY books
Past purchases of youth books<br>
Gender
Amount purchased
Months since first purchase
Months since last purchase
Frequency of purchase
Past purchases of art books
Past purchases of children’s books
Past purchases of cook books
Past purchases of DIY books
Past purchases of youth books<br>
19
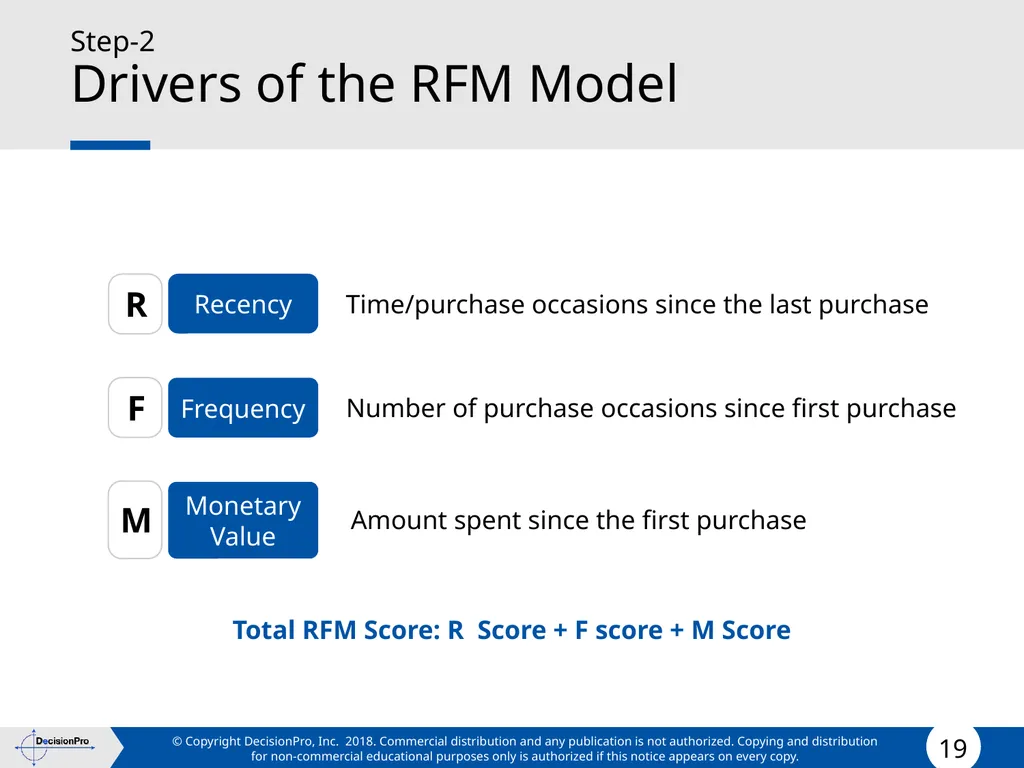
Step-2
Drivers of the RFM Model Monetary
Value Frequency Recency Time/purchase occasions since the last purchase Number of purchase occasions since first purchase Amount spent since the first purchase R F M Total RFM Score: R Score + F score + M Score<br>
Value Frequency Recency Time/purchase occasions since the last purchase Number of purchase occasions since first purchase Amount spent since the first purchase R F M Total RFM Score: R Score + F score + M Score<br>
20
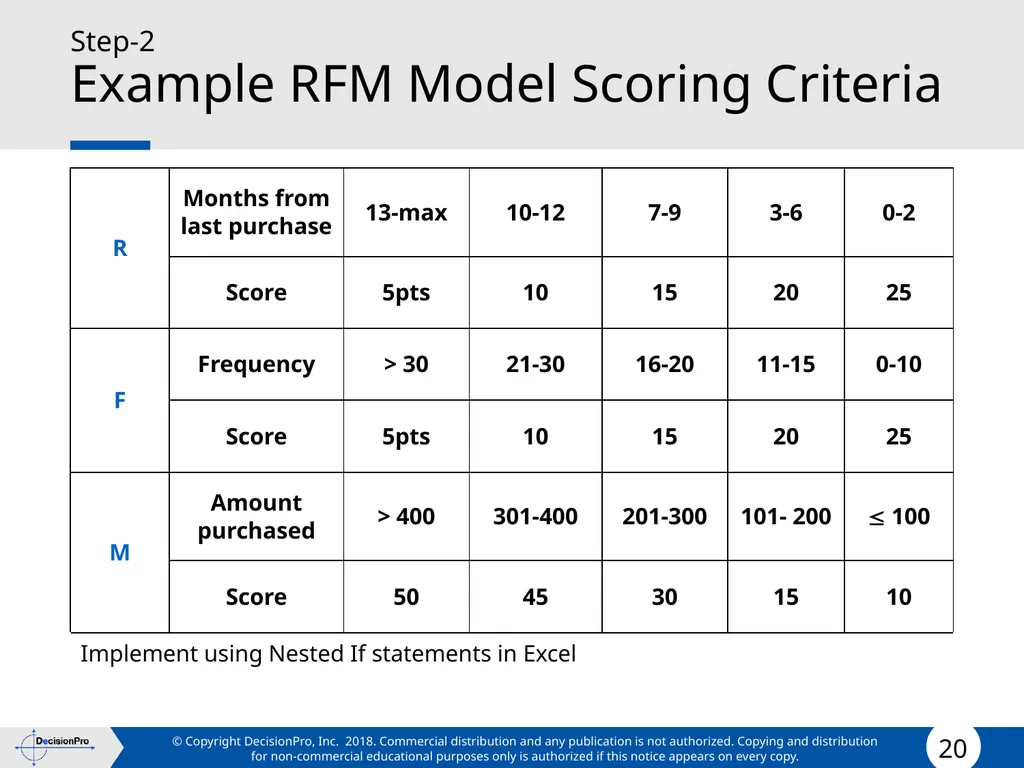
Step-2
Example RFM Model Scoring Criteria<br>
21
Step-2
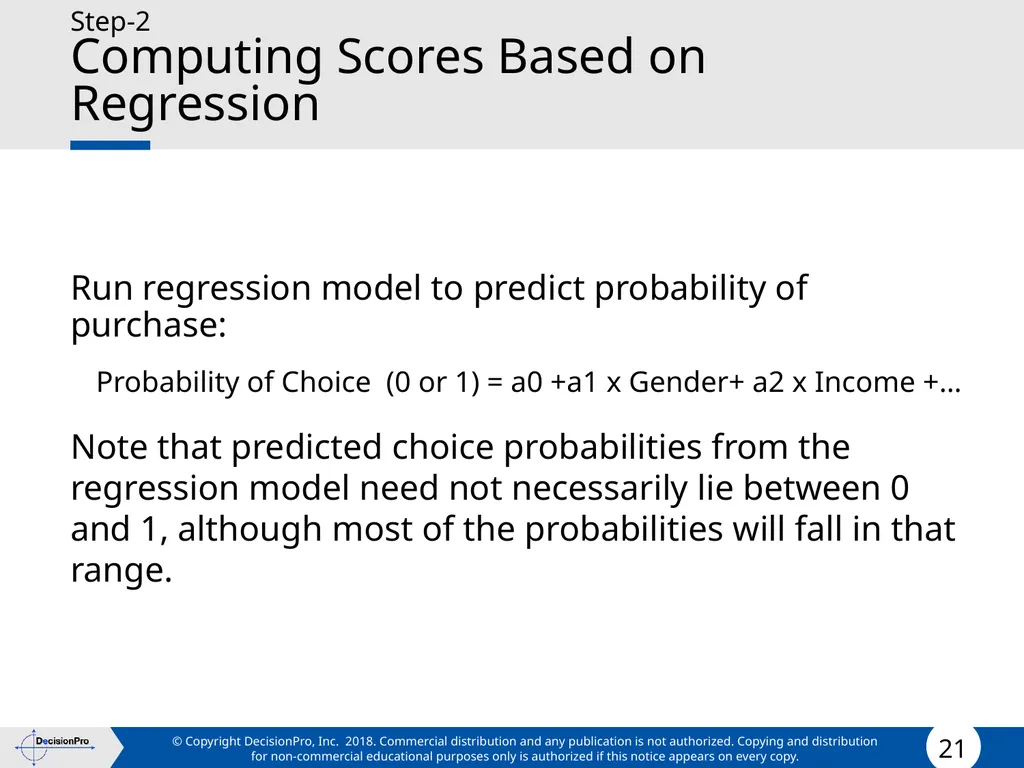
Computing Scores Based on Regression Run regression model to predict probability of purchase:
Probability of Choice (0 or 1) = a0 +a1 x Gender+ a2 x Income +…
Note that predicted choice probabilities from the regression model need not necessarily lie between 0 and 1, although most of the probabilities will fall in that range.<br>
Probability of Choice (0 or 1) = a0 +a1 x Gender+ a2 x Income +…
Note that predicted choice probabilities from the regression model need not necessarily lie between 0 and 1, although most of the probabilities will fall in that range.<br>
22
Step-2
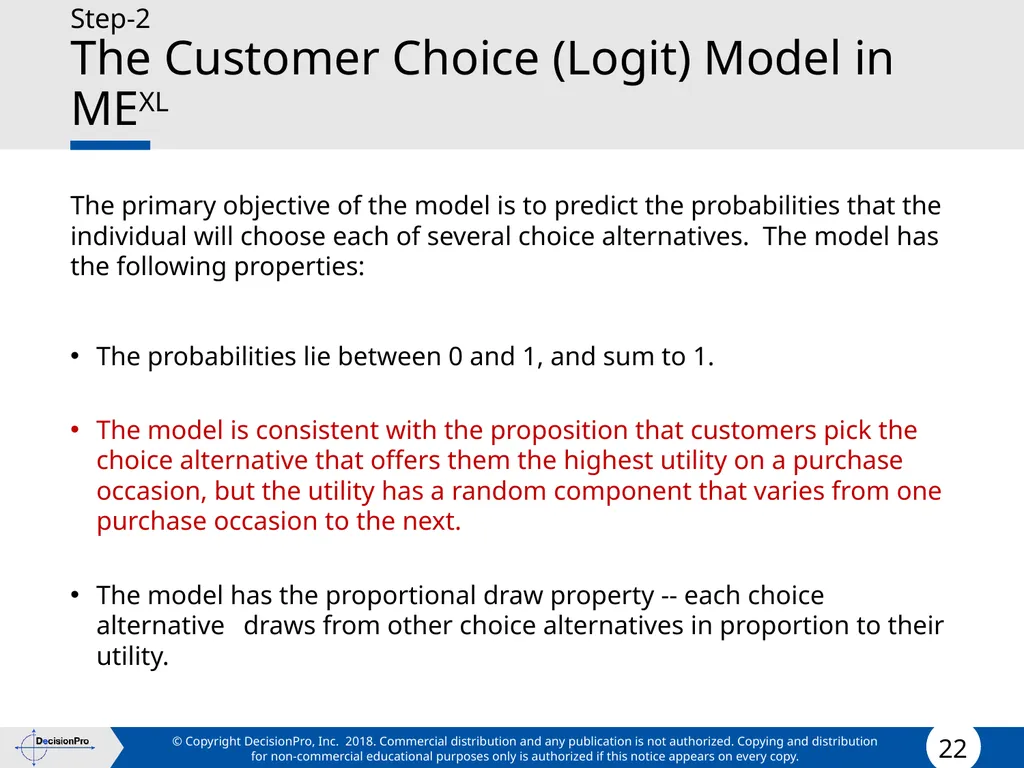
The Customer Choice (Logit) Model in MEXL The primary objective of the model is to predict the probabilities that the individual will choose each of several choice alternatives. The model has the following properties:
The probabilities lie between 0 and 1, and sum to 1.
The model is consistent with the proposition that customers pick the choice alternative that offers them the highest utility on a purchase occasion, but the utility has a random component that varies from one purchase occasion to the next.
The model has the proportional draw property -- each choice alternative draws from other choice alternatives in proportion to their utility.<br>
The probabilities lie between 0 and 1, and sum to 1.
The model is consistent with the proposition that customers pick the choice alternative that offers them the highest utility on a purchase occasion, but the utility has a random component that varies from one purchase occasion to the next.
The model has the proportional draw property -- each choice alternative draws from other choice alternatives in proportion to their utility.<br>
23
Step-2
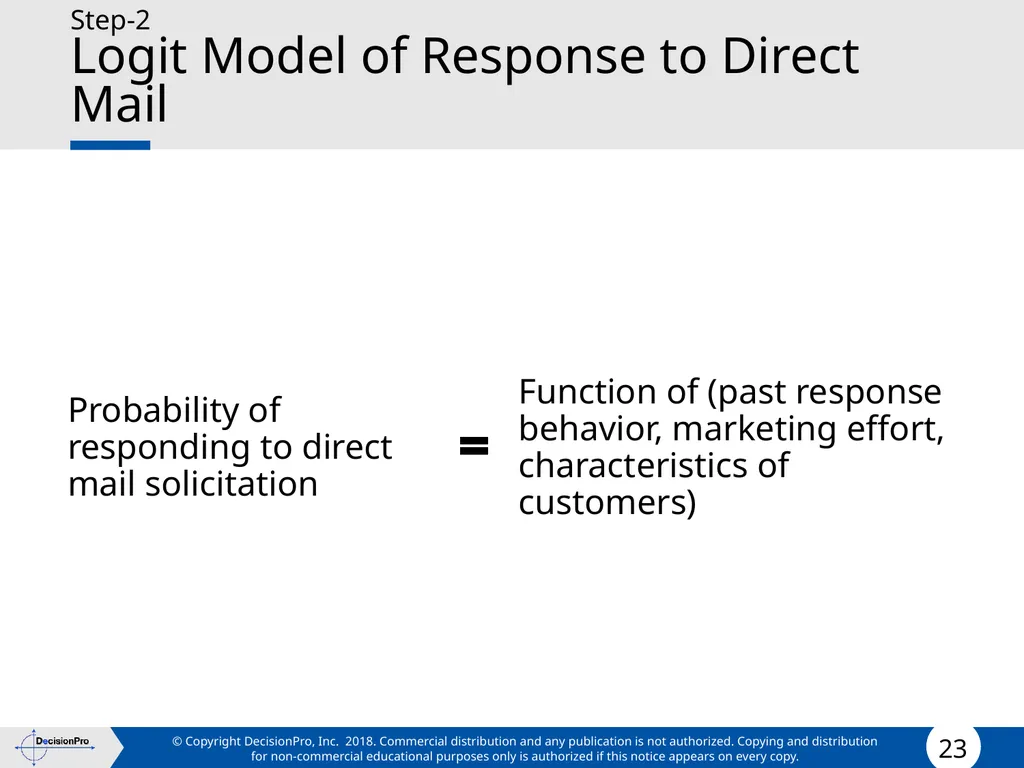
Logit Model of Response to Direct Mail Probability of responding to direct mail solicitation Function of (past response behavior, marketing effort, characteristics of customers)<br>
24
Step-2
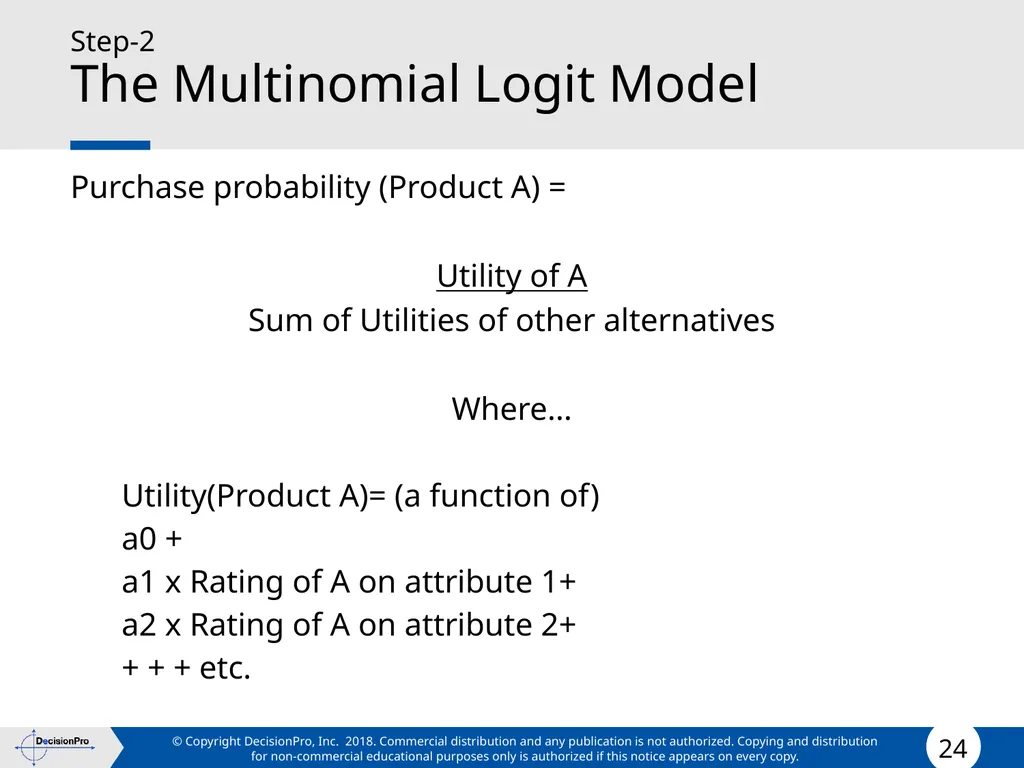
The Multinomial Logit Model Purchase probability (Product A) =
Utility of A
Sum of Utilities of other alternatives
Where…
Utility(Product A)= (a function of)
a0 +
a1 x Rating of A on attribute 1+
a2 x Rating of A on attribute 2+
+ + + etc.<br>
Utility of A
Sum of Utilities of other alternatives
Where…
Utility(Product A)= (a function of)
a0 +
a1 x Rating of A on attribute 1+
a2 x Rating of A on attribute 2+
+ + + etc.<br>
25
Step-2
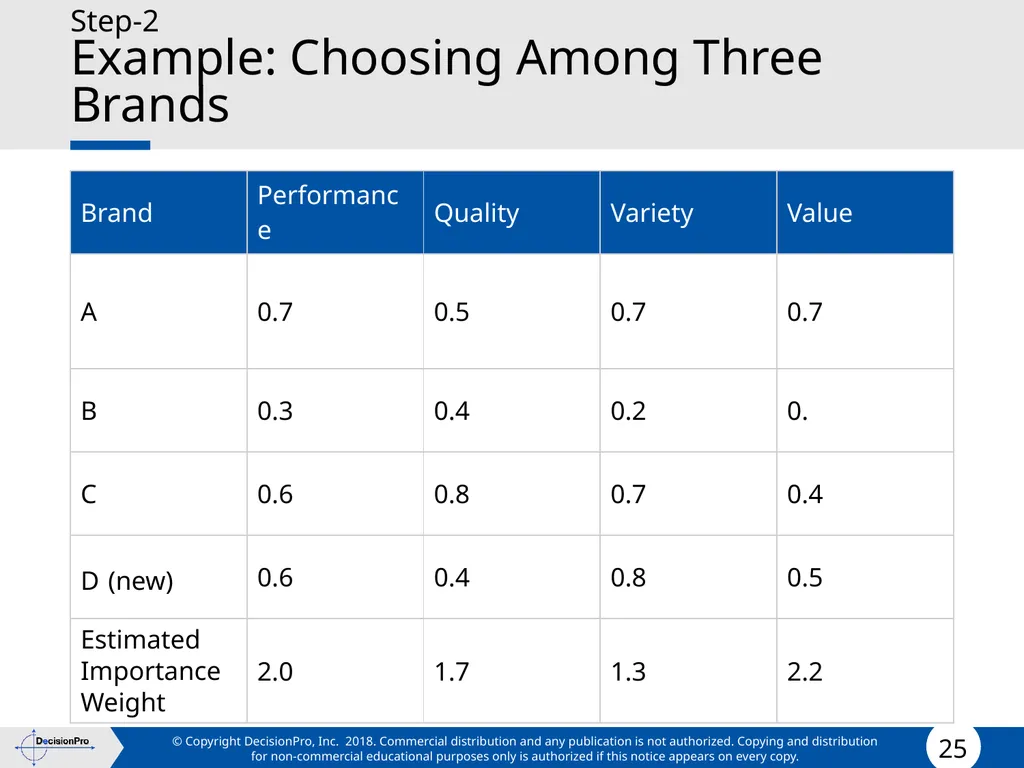
Example: Choosing Among Three Brands<br>
26
Step-2
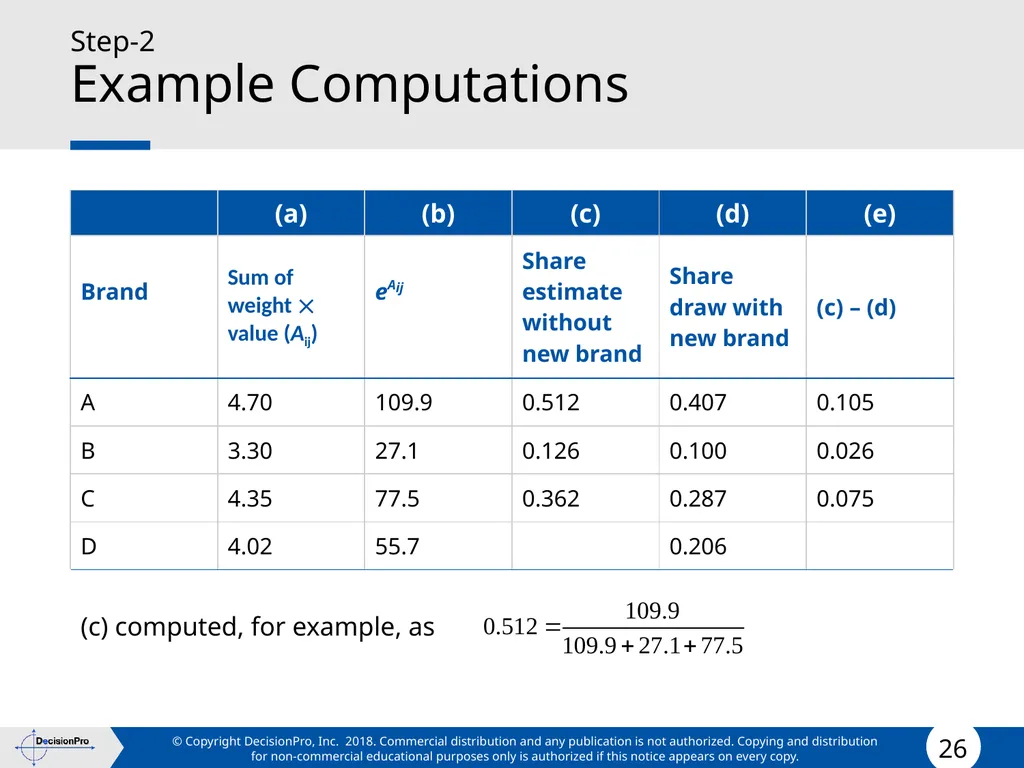
Example Computations<br>
27
Step-2
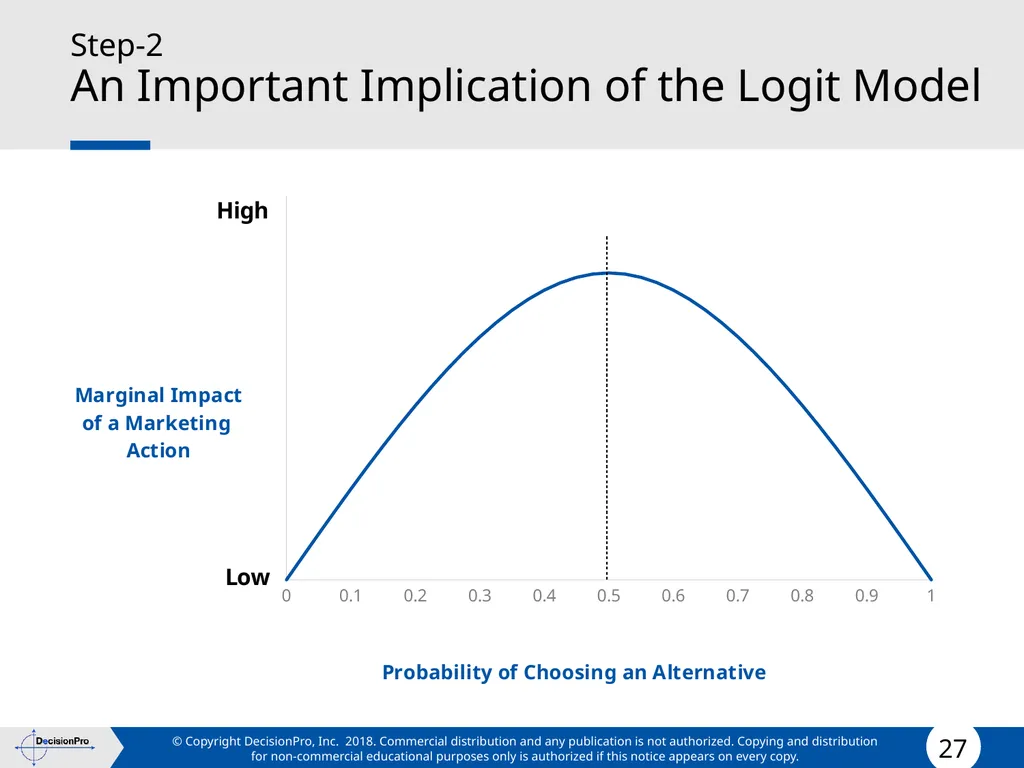
An Important Implication of the Logit Model<br>
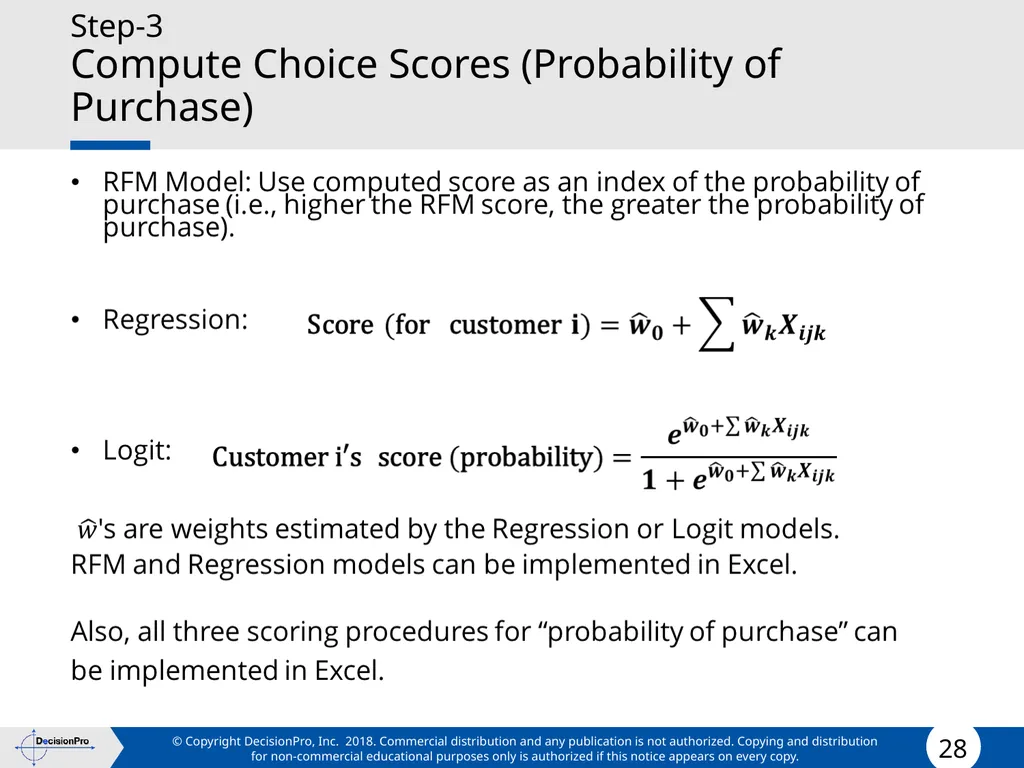
28
Step-3
Compute Choice Scores (Probability of Purchase)<br>
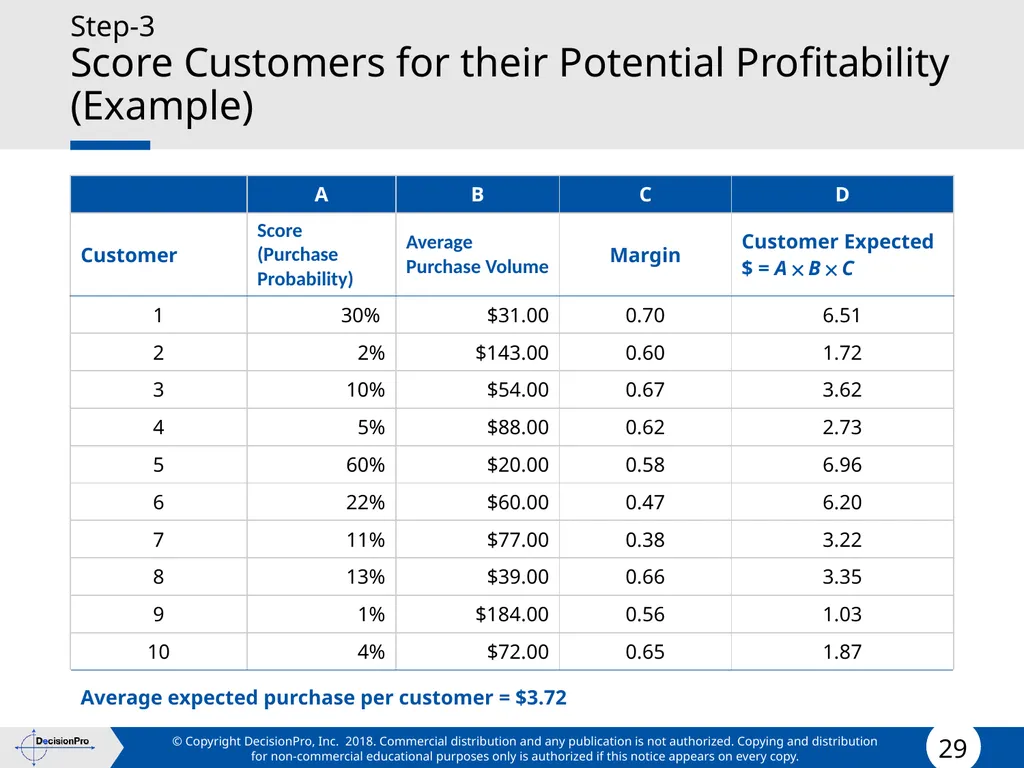
29
Step-3
Score Customers for their Potential Profitability (Example)<br>
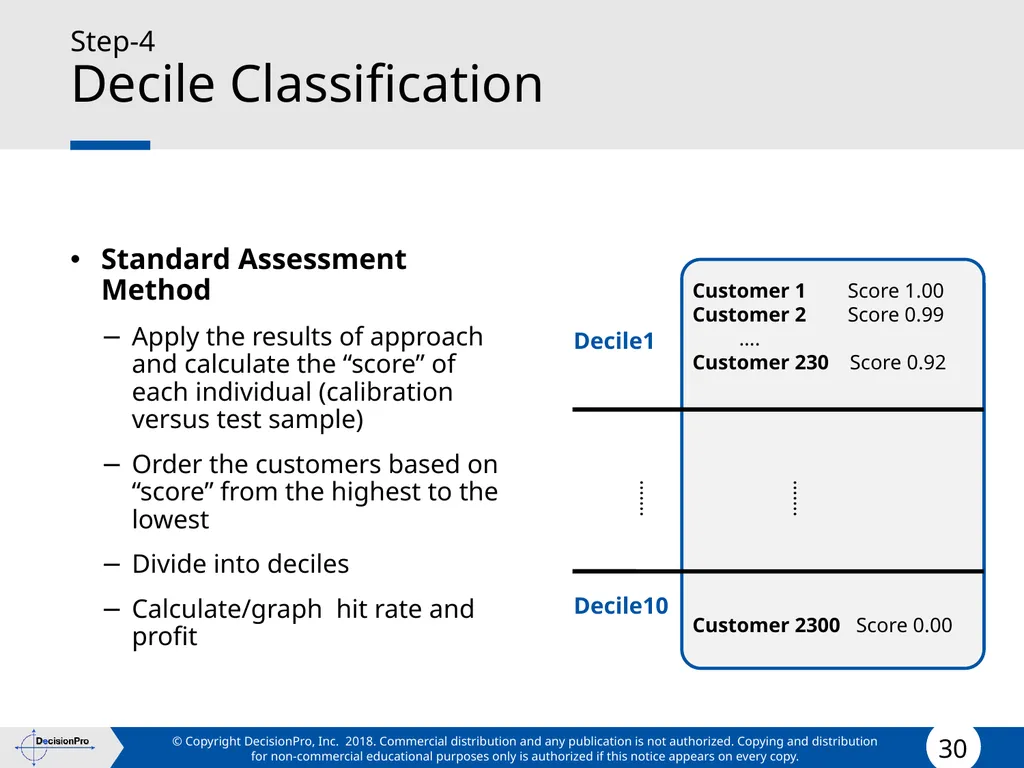
30
Step-4
Decile Classification Standard Assessment Method
Apply the results of approach and calculate the “score” of each individual (calibration versus test sample)
Order the customers based on “score” from the highest to the lowest
Divide into deciles
Calculate/graph hit rate and profit Customer 1 Score 1.00
Customer 2 Score 0.99
….
Customer 230 Score 0.92
Customer 2300 Score 0.00 Decile1 Decile10 ……. …….<br>
Apply the results of approach and calculate the “score” of each individual (calibration versus test sample)
Order the customers based on “score” from the highest to the lowest
Divide into deciles
Calculate/graph hit rate and profit Customer 1 Score 1.00
Customer 2 Score 0.99
….
Customer 230 Score 0.92
Customer 2300 Score 0.00 Decile1 Decile10 ……. …….<br>
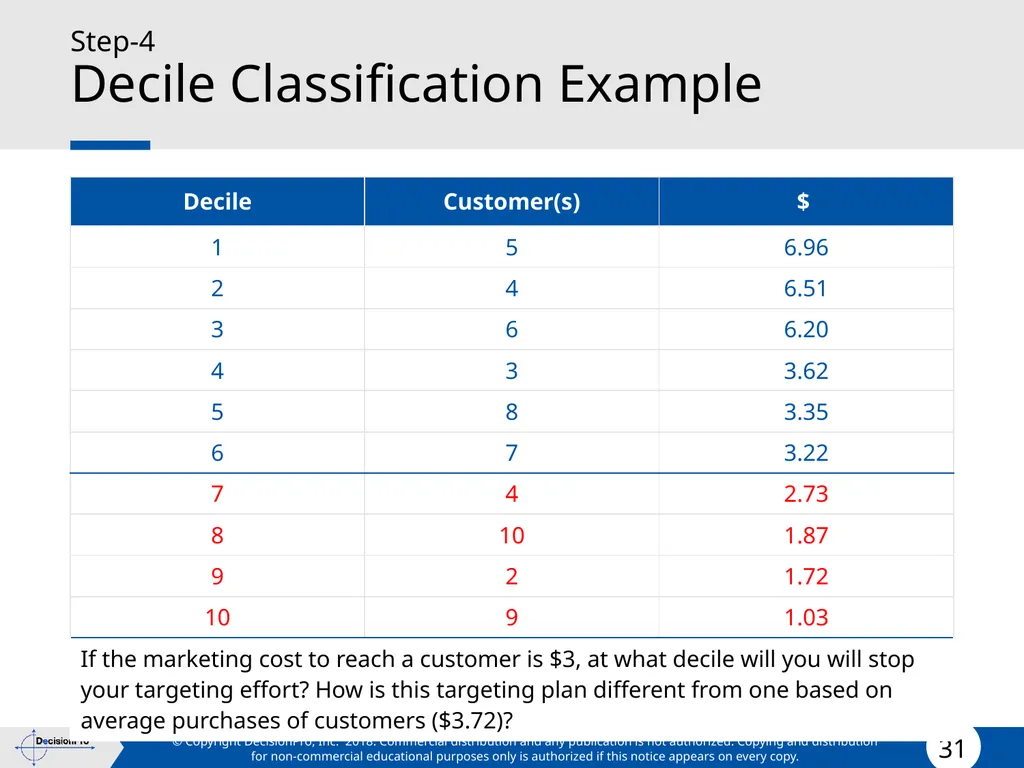
31
Step-4
Decile Classification Example<br>
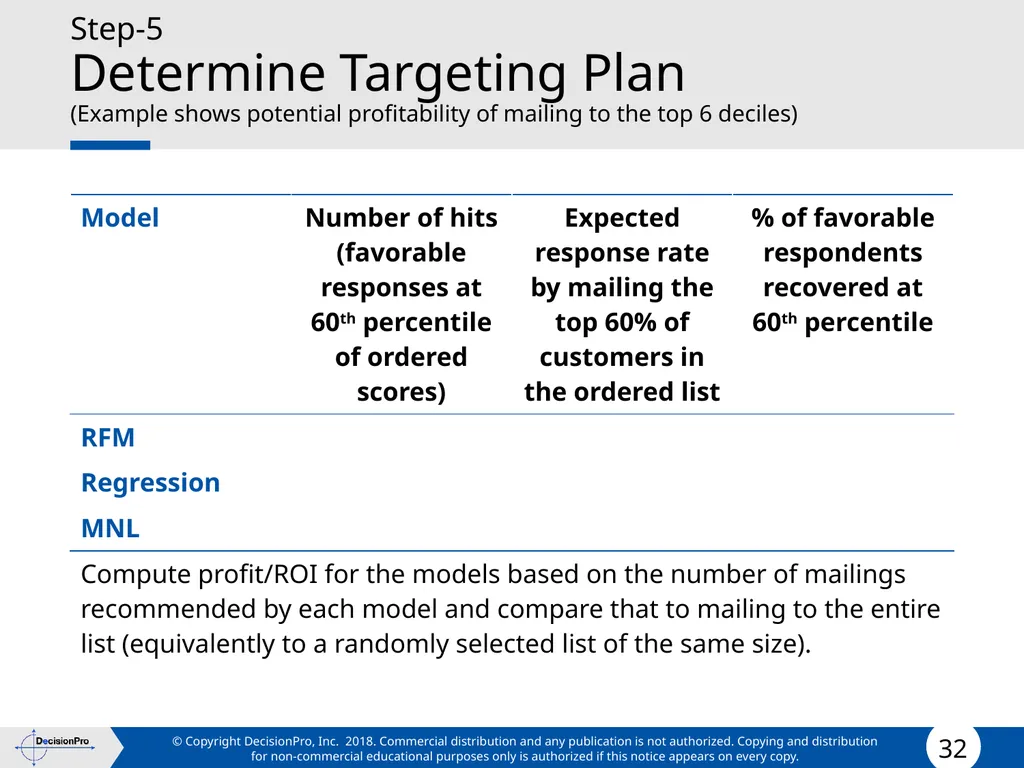
32
Step-5
Determine Targeting Plan
(Example shows potential profitability of mailing to the top 6 deciles)<br>
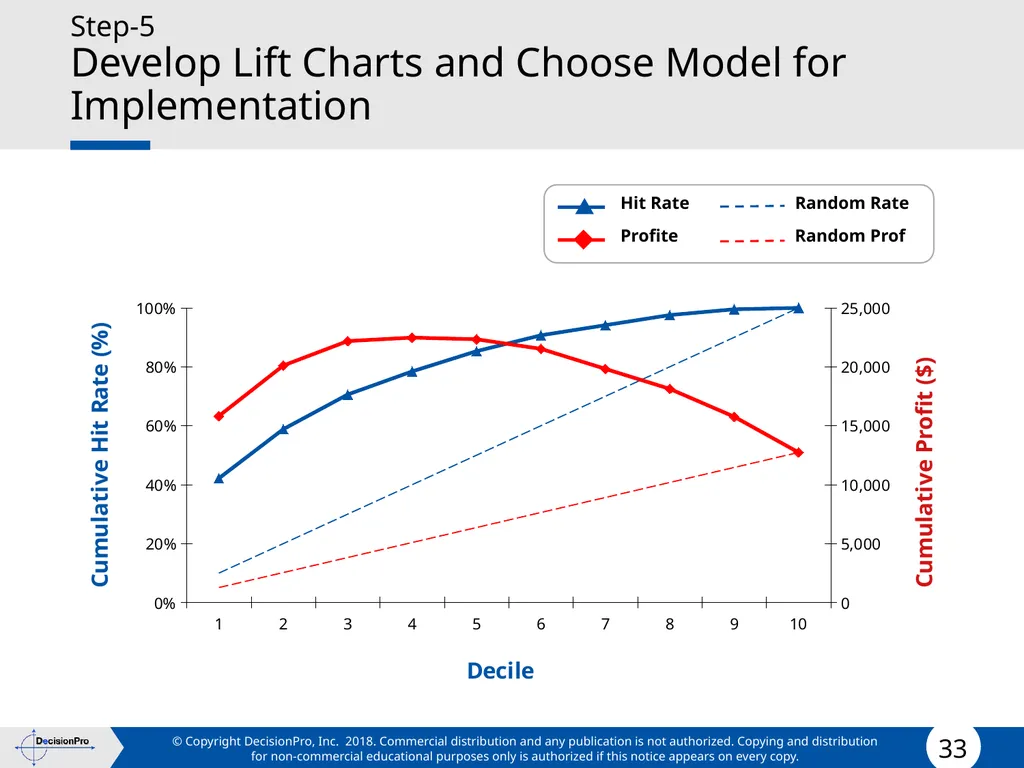
33
Step-5
Develop Lift Charts and Choose Model for Implementation Hit Rate Profite Random Rate Random Prof<br>
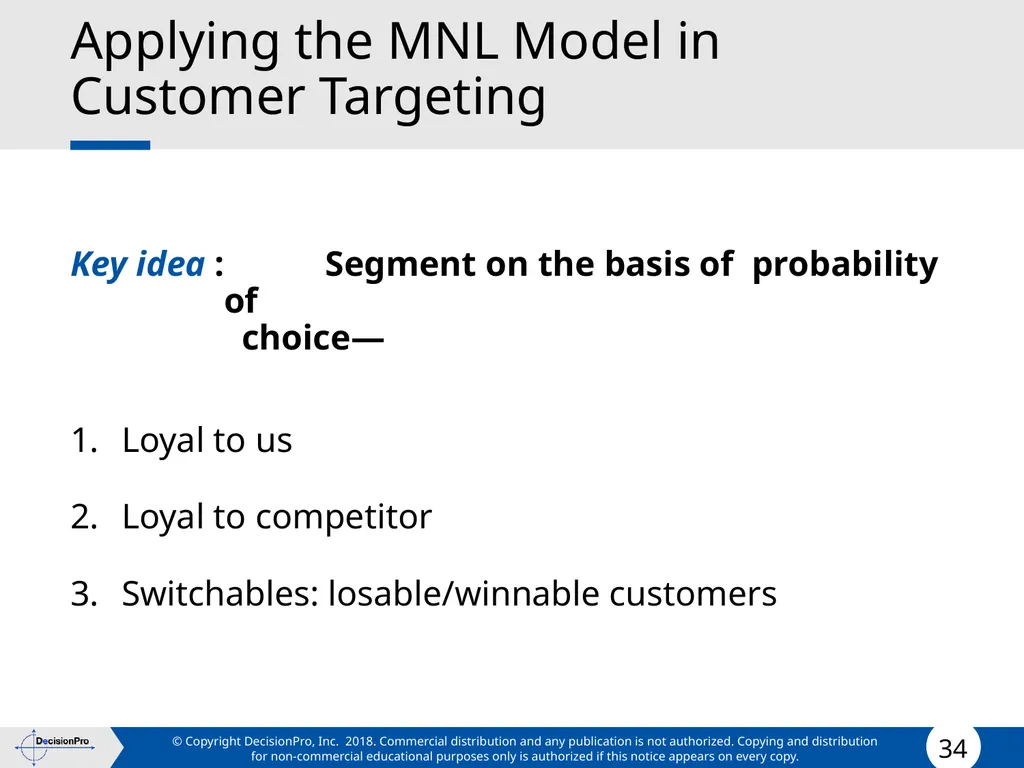
34
Applying the MNL Model in Customer Targeting Key idea : Segment on the basis of probability of
choice—
Loyal to us
Loyal to competitor
Switchables: losable/winnable customers<br>
Loyal to us
Loyal to competitor
Switchables: losable/winnable customers<br>
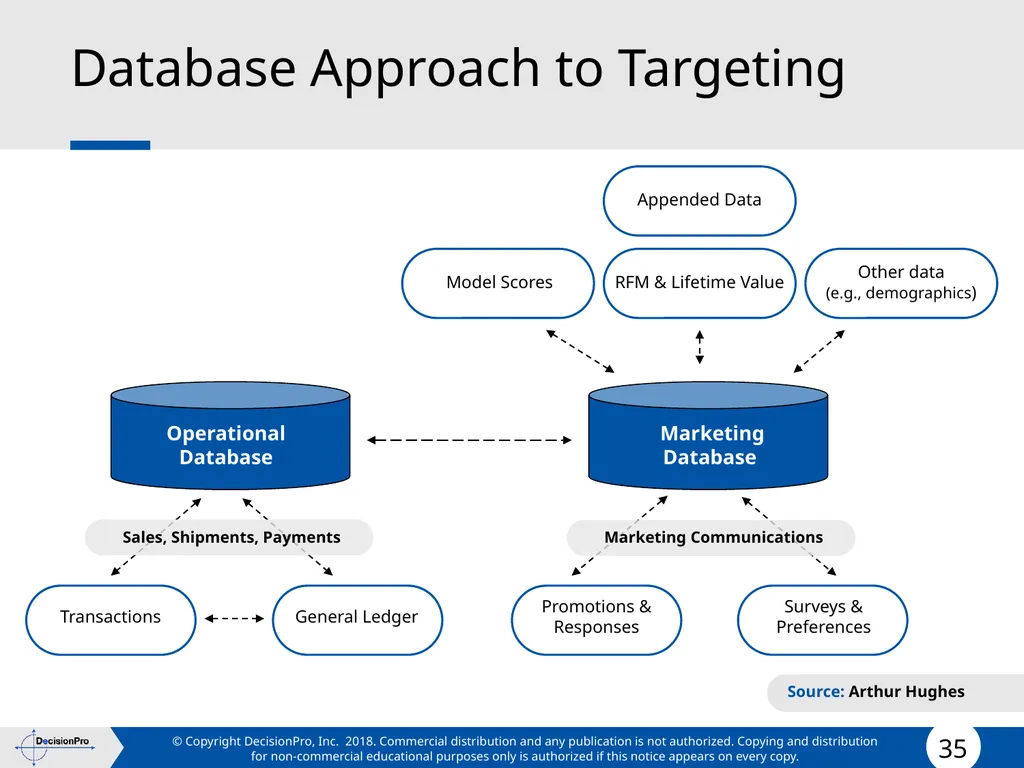
35
Database Approach to Targeting Appended Data Model Scores RFM & Lifetime Value Marketing Database Promotions & Responses Surveys & Preferences Transactions General Ledger Operational Database Other data
(e.g., demographics) Sales, Shipments, Payments Marketing Communications Source: Arthur Hughes<br>
(e.g., demographics) Sales, Shipments, Payments Marketing Communications Source: Arthur Hughes<br>
36
Mary L. Smith
Cust # 2577-3274-3
Loc # 33-47-2178
Join Date - 4/6/95
Age 35 – 44
Occupation – Professional
Income - $50k – 75k
Education – College grad
Number in HH – 4
Uses PC & Internet
Detailed transactions data
Multichannel access data
CLV Mary L. Smith
Cust # 2577-3274-3
Loc # 33-47-2178
Join Date - 4/6/95
Age 35 – 44
Occupation – Professional
Income - $50k – 75k
Education – College grad
Number in HH – 4
Uses PC & Internet
Purchase Data Mary L. Smith
Cust # 2577-3274-3
Loc # 33-47-2178
Join Date - 4/6/95
Age 35 – 44
Occupation – Professional
Income - $50k – 75k
Education – College grad Mary L. Smith
Cust # 2577-3274-3
Loc # 33-47-2178
Join Date - 4/6/95<br>
Cust # 2577-3274-3
Loc # 33-47-2178
Join Date - 4/6/95
Age 35 – 44
Occupation – Professional
Income - $50k – 75k
Education – College grad
Number in HH – 4
Uses PC & Internet
Detailed transactions data
Multichannel access data
CLV Mary L. Smith
Cust # 2577-3274-3
Loc # 33-47-2178
Join Date - 4/6/95
Age 35 – 44
Occupation – Professional
Income - $50k – 75k
Education – College grad
Number in HH – 4
Uses PC & Internet
Purchase Data Mary L. Smith
Cust # 2577-3274-3
Loc # 33-47-2178
Join Date - 4/6/95
Age 35 – 44
Occupation – Professional
Income - $50k – 75k
Education – College grad Mary L. Smith
Cust # 2577-3274-3
Loc # 33-47-2178
Join Date - 4/6/95<br>
37
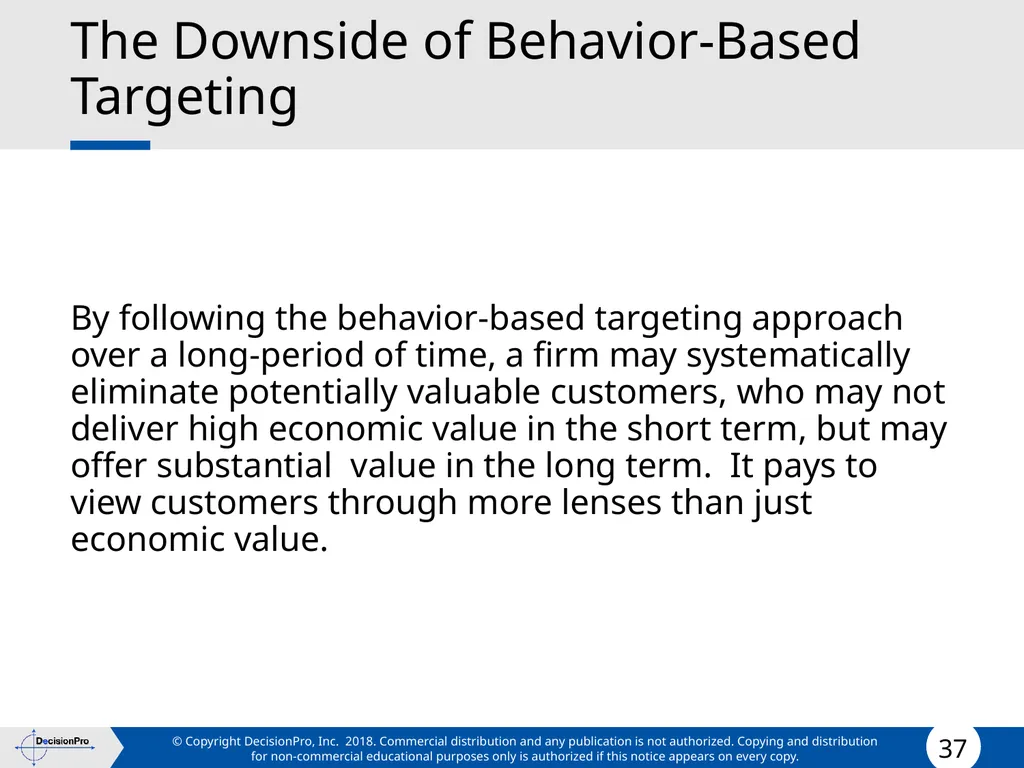
The Downside of Behavior-Based Targeting By following the behavior-based targeting approach over a long-period of time, a firm may systematically eliminate potentially valuable customers, who may not deliver high economic value in the short term, but may offer substantial value in the long term. It pays to view customers through more lenses than just economic value.<br>
38
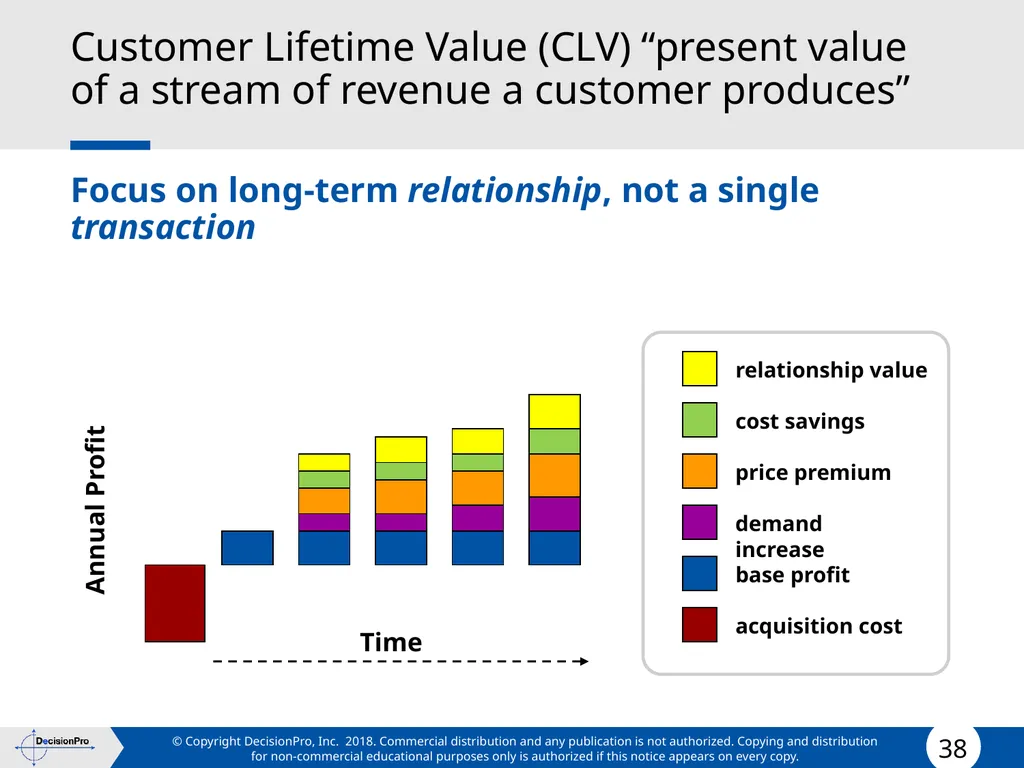
Customer Lifetime Value (CLV) “present value of a stream of revenue a customer produces” Focus on long-term relationship, not a single transaction relationship value cost savings price premium demand increase base profit acquisition cost Time Annual Profit<br>
39
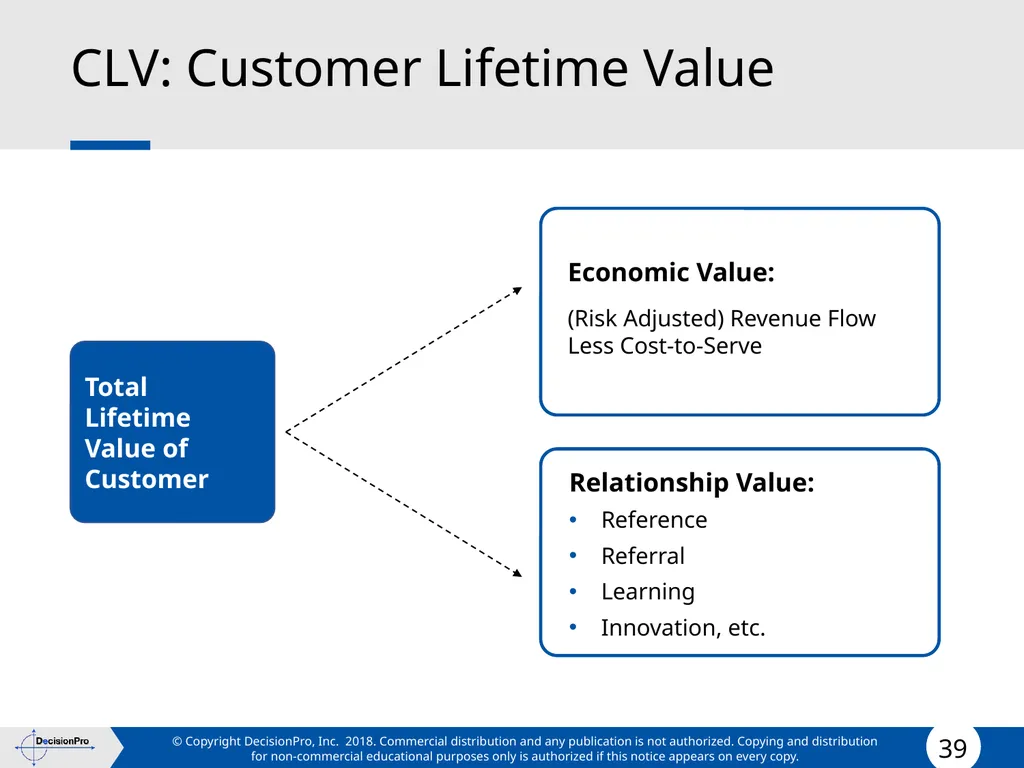
CLV: Customer Lifetime Value Total Lifetime
Value of
Customer Economic Value:
(Risk Adjusted) Revenue Flow Less Cost-to-Serve Relationship Value:
Reference
Referral
Learning
Innovation, etc.<br>
Value of
Customer Economic Value:
(Risk Adjusted) Revenue Flow Less Cost-to-Serve Relationship Value:
Reference
Referral
Learning
Innovation, etc.<br>
40
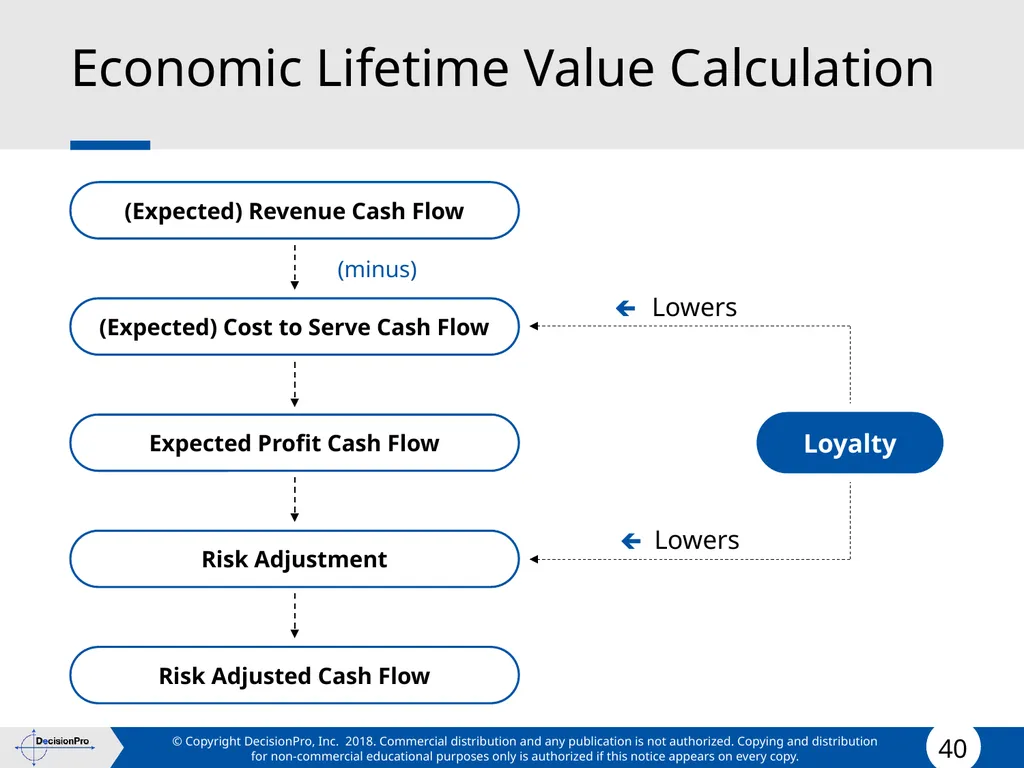
Economic Lifetime Value Calculation (Expected) Revenue Cash Flow (Expected) Cost to Serve Cash Flow Expected Profit Cash Flow Risk Adjustment Risk Adjusted Cash Flow Loyalty Lowers Lowers (minus)<br>
41
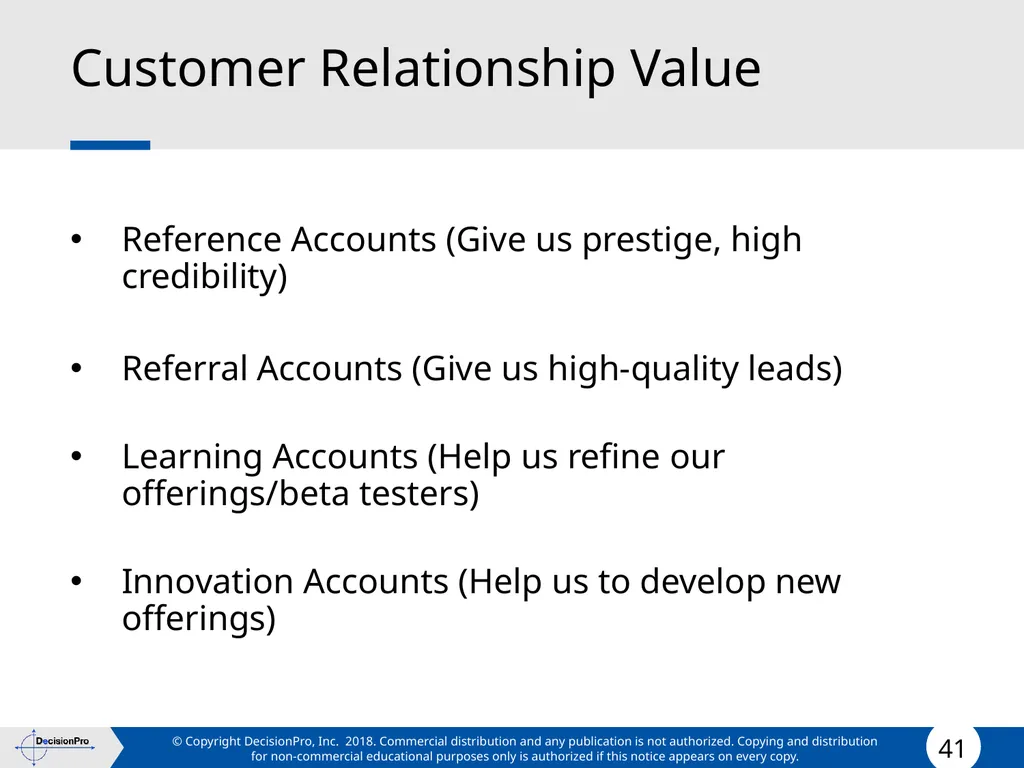
Customer Relationship Value Reference Accounts (Give us prestige, high credibility)
Referral Accounts (Give us high-quality leads)
Learning Accounts (Help us refine our offerings/beta testers)
Innovation Accounts (Help us to develop new offerings)<br>
Referral Accounts (Give us high-quality leads)
Learning Accounts (Help us refine our offerings/beta testers)
Innovation Accounts (Help us to develop new offerings)<br>
42
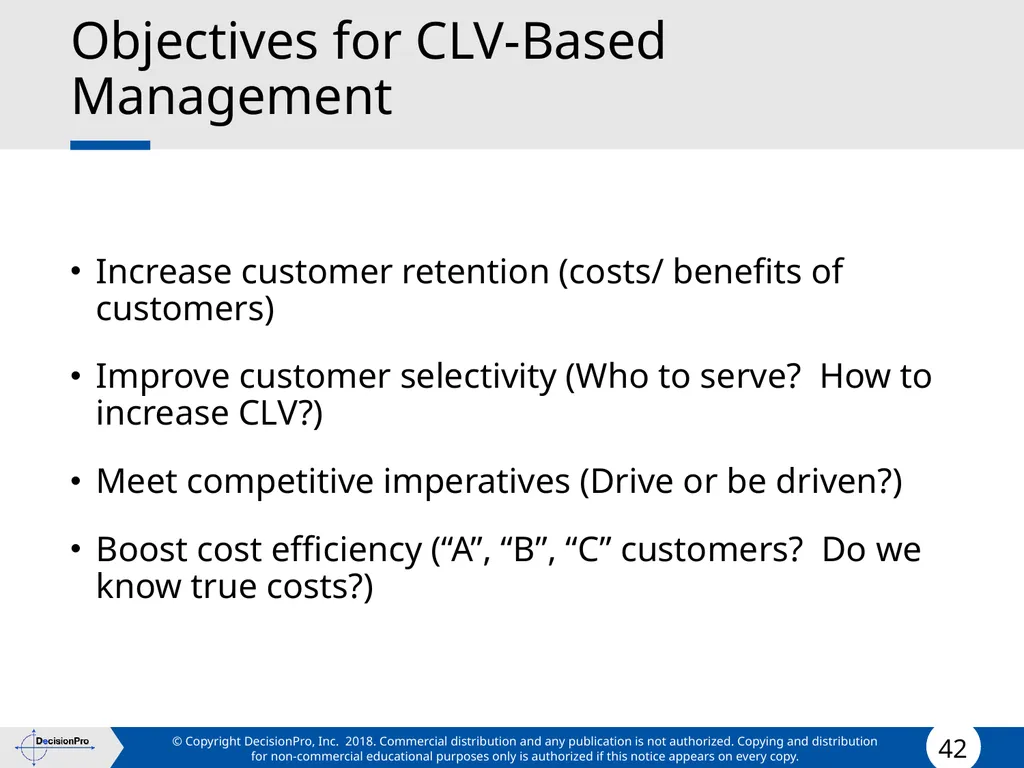
Objectives for CLV-Based Management Increase customer retention (costs/ benefits of customers)
Improve customer selectivity (Who to serve? How to increase CLV?)
Meet competitive imperatives (Drive or be driven?)
Boost cost efficiency (“A”, “B”, “C” customers? Do we know true costs?)<br>
Improve customer selectivity (Who to serve? How to increase CLV?)
Meet competitive imperatives (Drive or be driven?)
Boost cost efficiency (“A”, “B”, “C” customers? Do we know true costs?)<br>
43
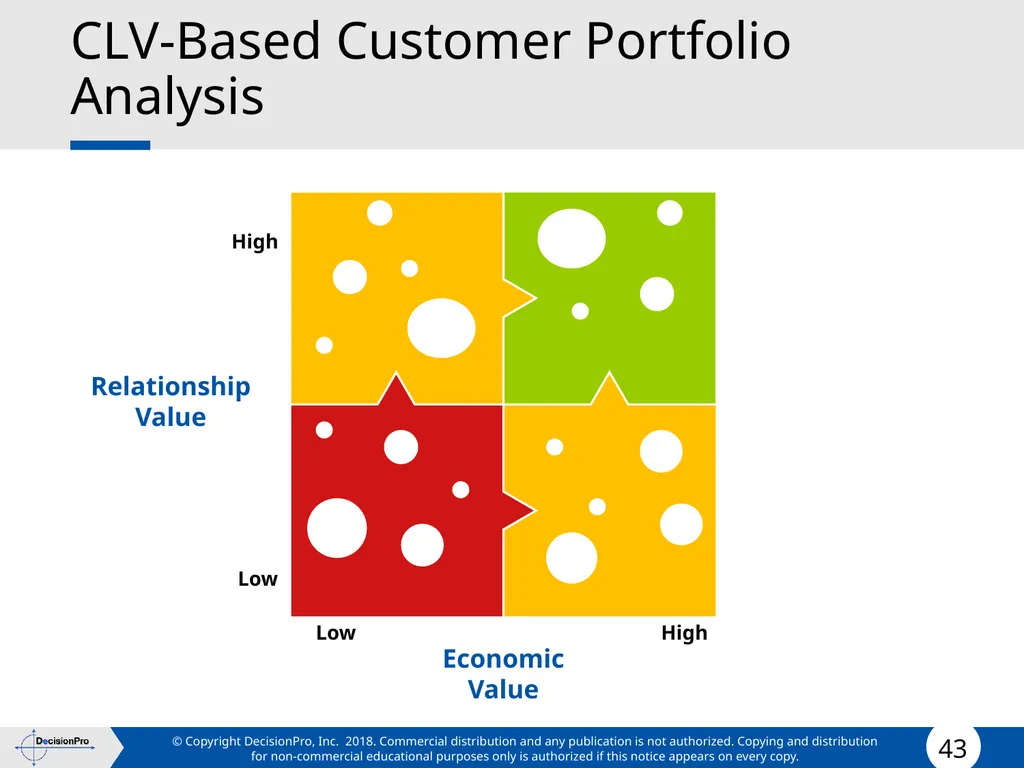
CLV-Based Customer Portfolio Analysis High Low Relationship
Value Low High Economic
Value<br>
Value Low High Economic
Value<br>
44
Approaches to Increasing CLV
(Implemented via CRM) Reduce rate of defection
Increase longevity
Enhance share of wallet
Attempt to alter behavior of low-profit customers
Focus more effort on high-profit customers<br>
Increase longevity
Enhance share of wallet
Attempt to alter behavior of low-profit customers
Focus more effort on high-profit customers<br>
45
Questions…What is the lifetime value of a…. Walmart customer?
AMEX customer?
Ritz Carlton customer?
Sony customer?
Singapore Airline customer?
An MBA student?<br>
AMEX customer?
Ritz Carlton customer?
Sony customer?
Singapore Airline customer?
An MBA student?<br>
46
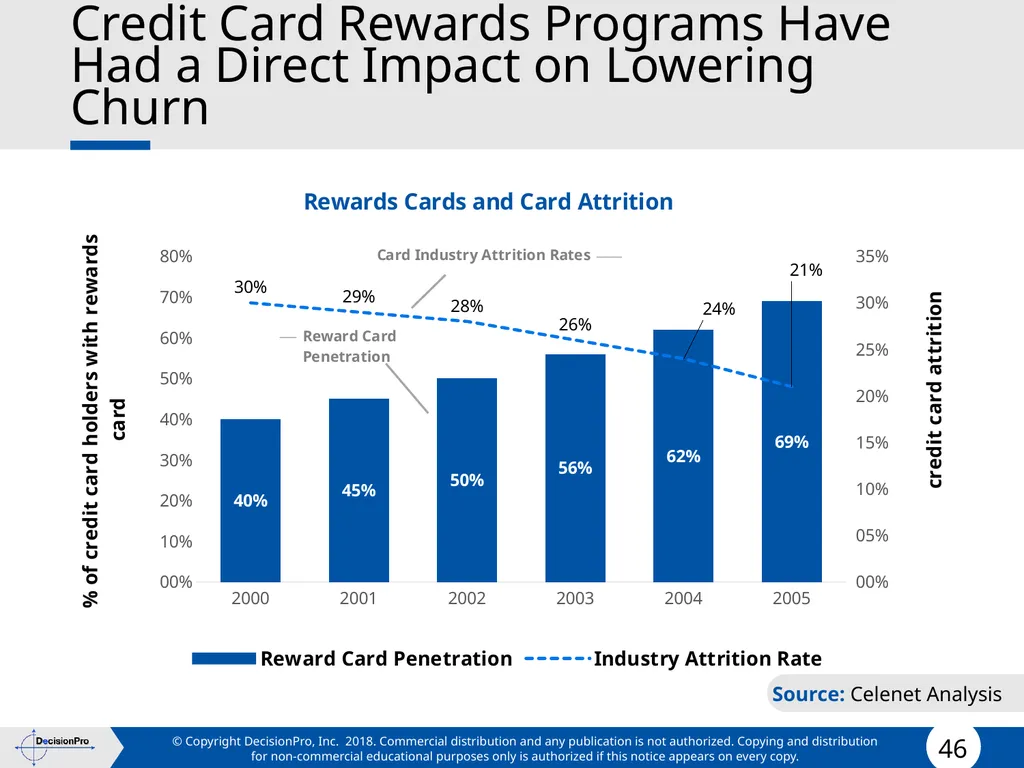
Credit Card Rewards Programs Have Had a Direct Impact on Lowering Churn Source: Celenet Analysis<br>
47
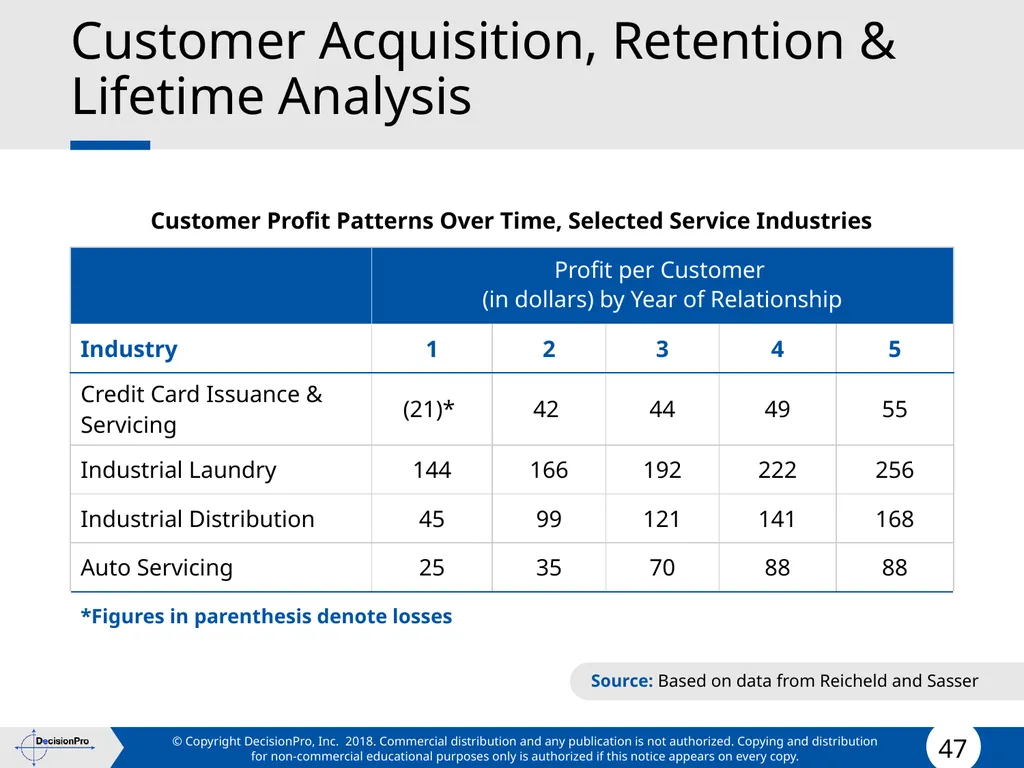
Customer Acquisition, Retention & Lifetime Analysis Source: Based on data from Reicheld and Sasser<br>
48
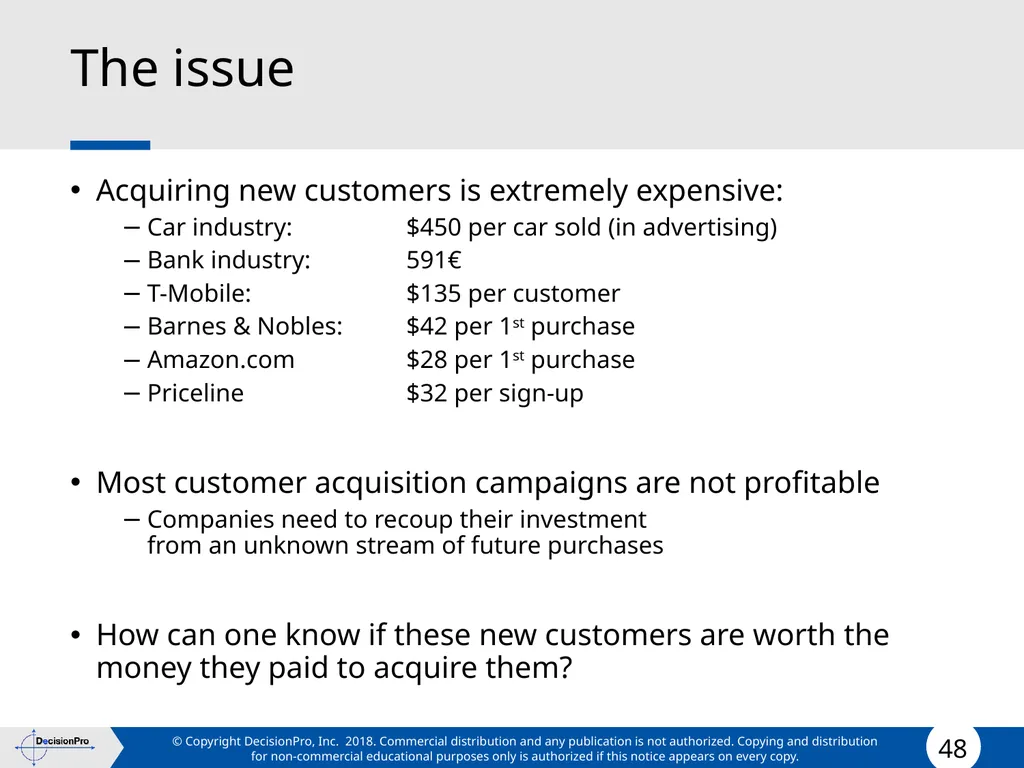
The issue Acquiring new customers is extremely expensive:
Car industry: $450 per car sold (in advertising)
Bank industry: 591€
T-Mobile: $135 per customer
Barnes & Nobles: $42 per 1st purchase
Amazon.com $28 per 1st purchase
Priceline $32 per sign-up
Most customer acquisition campaigns are not profitable
Companies need to recoup their investment from an unknown stream of future purchases
How can one know if these new customers are worth the money they paid to acquire them?<br>
Car industry: $450 per car sold (in advertising)
Bank industry: 591€
T-Mobile: $135 per customer
Barnes & Nobles: $42 per 1st purchase
Amazon.com $28 per 1st purchase
Priceline $32 per sign-up
Most customer acquisition campaigns are not profitable
Companies need to recoup their investment from an unknown stream of future purchases
How can one know if these new customers are worth the money they paid to acquire them?<br>
49
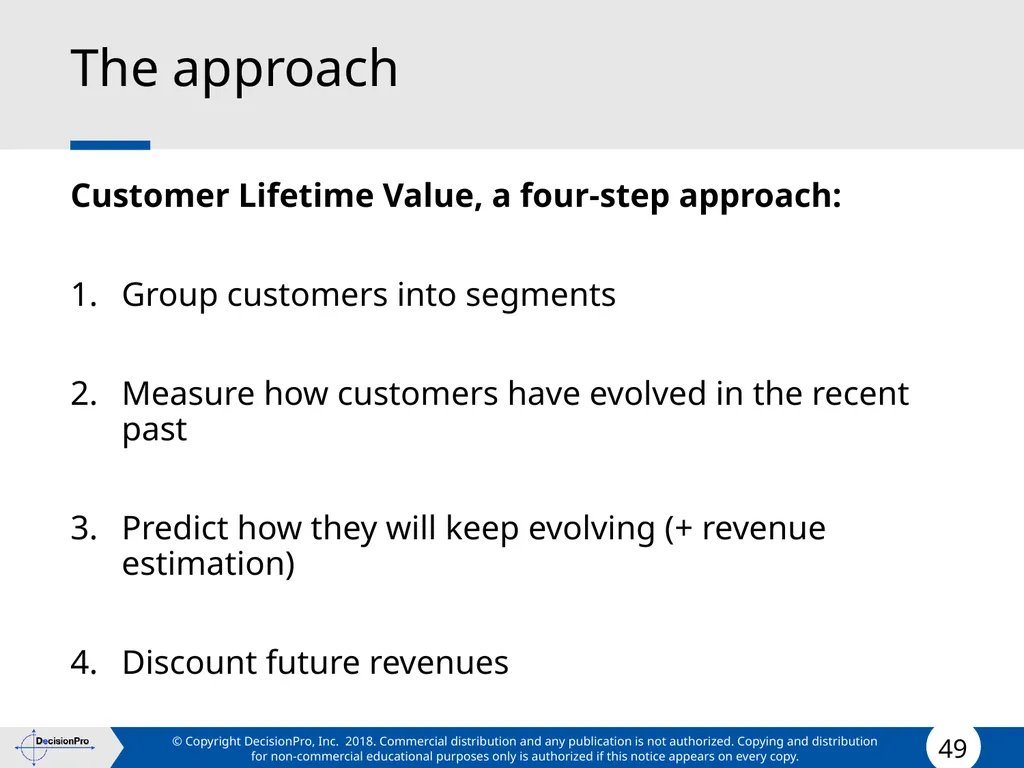
The approach Customer Lifetime Value, a four-step approach:
Group customers into segments
Measure how customers have evolved in the recent past
Predict how they will keep evolving (+ revenue estimation)
Discount future revenues<br>
Group customers into segments
Measure how customers have evolved in the recent past
Predict how they will keep evolving (+ revenue estimation)
Discount future revenues<br>
50
Step 1
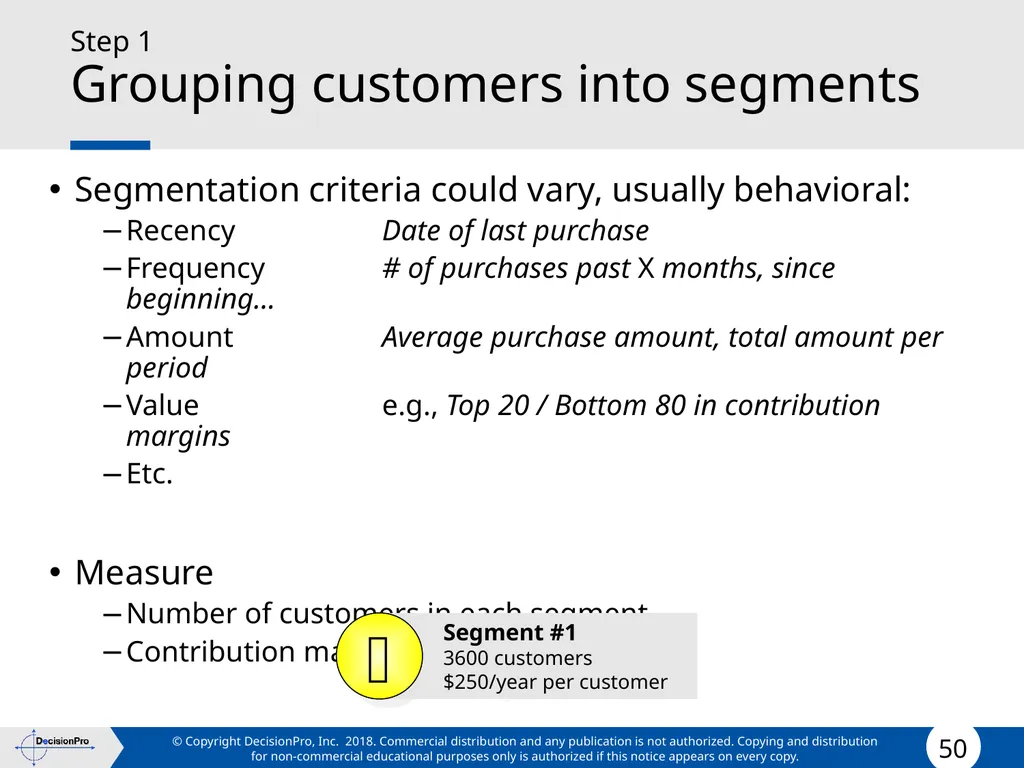
Grouping customers into segments Segmentation criteria could vary, usually behavioral:
Recency Date of last purchase
Frequency # of purchases past X months, since beginning…
Amount Average purchase amount, total amount per period
Value e.g., Top 20 / Bottom 80 in contribution margins
Etc.
Measure
Number of customers in each segment
Contribution margins in the last period Segment #1
3600 customers
$250/year per customer<br>
Recency Date of last purchase
Frequency # of purchases past X months, since beginning…
Amount Average purchase amount, total amount per period
Value e.g., Top 20 / Bottom 80 in contribution margins
Etc.
Measure
Number of customers in each segment
Contribution margins in the last period Segment #1
3600 customers
$250/year per customer<br>
51
Step 1
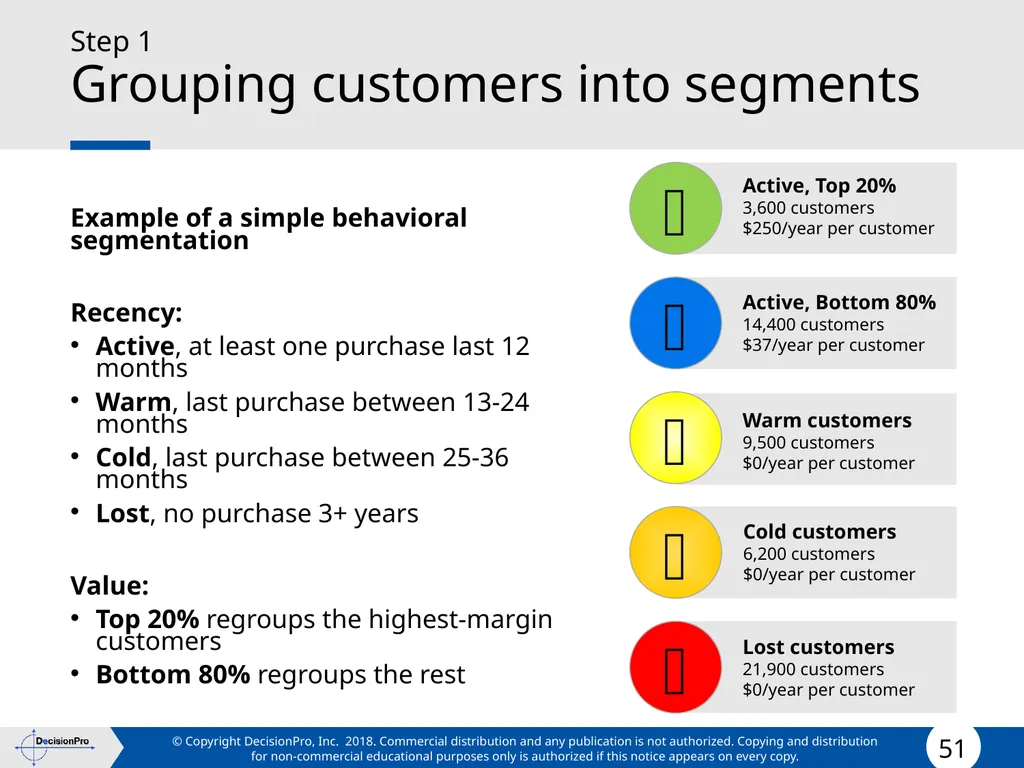
Grouping customers into segments Example of a simple behavioral segmentation
Recency:
Active, at least one purchase last 12 months
Warm, last purchase between 13-24 months
Cold, last purchase between 25-36 months
Lost, no purchase 3+ years
Value:
Top 20% regroups the highest-margin customers
Bottom 80% regroups the rest Active, Top 20%
3,600 customers
$250/year per customer Active, Bottom 80%
14,400 customers
$37/year per customer Warm customers
9,500 customers
$0/year per customer Cold customers
6,200 customers
$0/year per customer Lost customers
21,900 customers
$0/year per customer<br>
Recency:
Active, at least one purchase last 12 months
Warm, last purchase between 13-24 months
Cold, last purchase between 25-36 months
Lost, no purchase 3+ years
Value:
Top 20% regroups the highest-margin customers
Bottom 80% regroups the rest Active, Top 20%
3,600 customers
$250/year per customer Active, Bottom 80%
14,400 customers
$37/year per customer Warm customers
9,500 customers
$0/year per customer Cold customers
6,200 customers
$0/year per customer Lost customers
21,900 customers
$0/year per customer<br>
52
Step 2
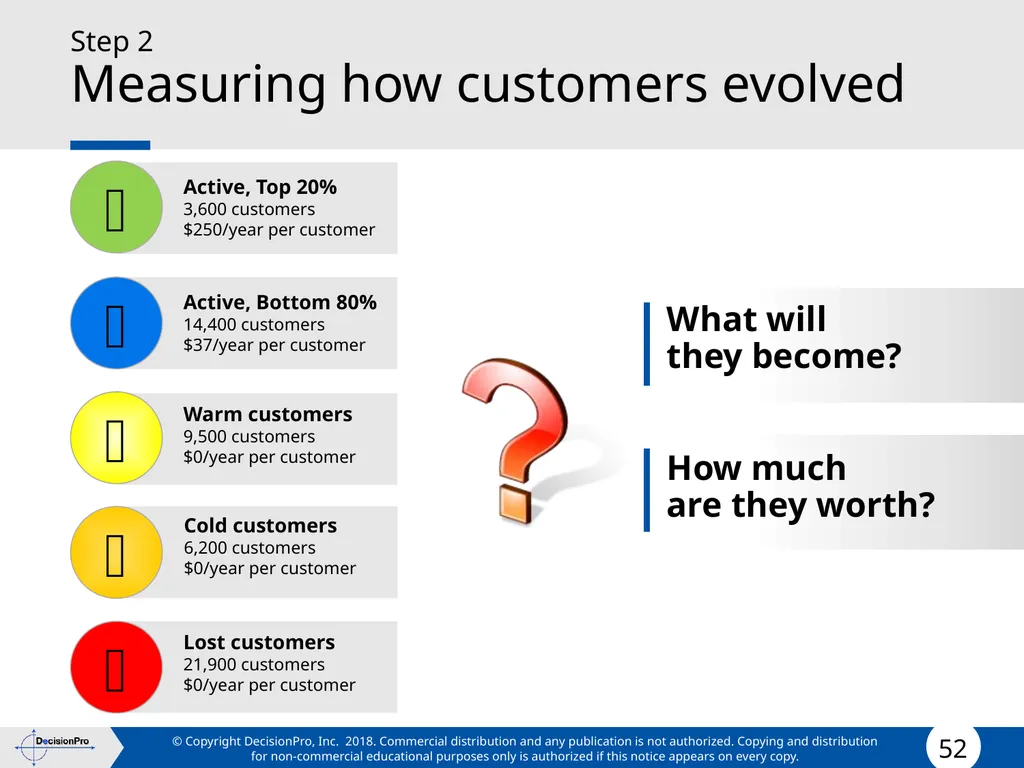
Measuring how customers evolved Active, Top 20%
3,600 customers
$250/year per customer Active, Bottom 80%
14,400 customers
$37/year per customer Warm customers
9,500 customers
$0/year per customer Cold customers
6,200 customers
$0/year per customer Lost customers
21,900 customers
$0/year per customer What will they become? How much are they worth?<br>
3,600 customers
$250/year per customer Active, Bottom 80%
14,400 customers
$37/year per customer Warm customers
9,500 customers
$0/year per customer Cold customers
6,200 customers
$0/year per customer Lost customers
21,900 customers
$0/year per customer What will they become? How much are they worth?<br>
53
Step 2
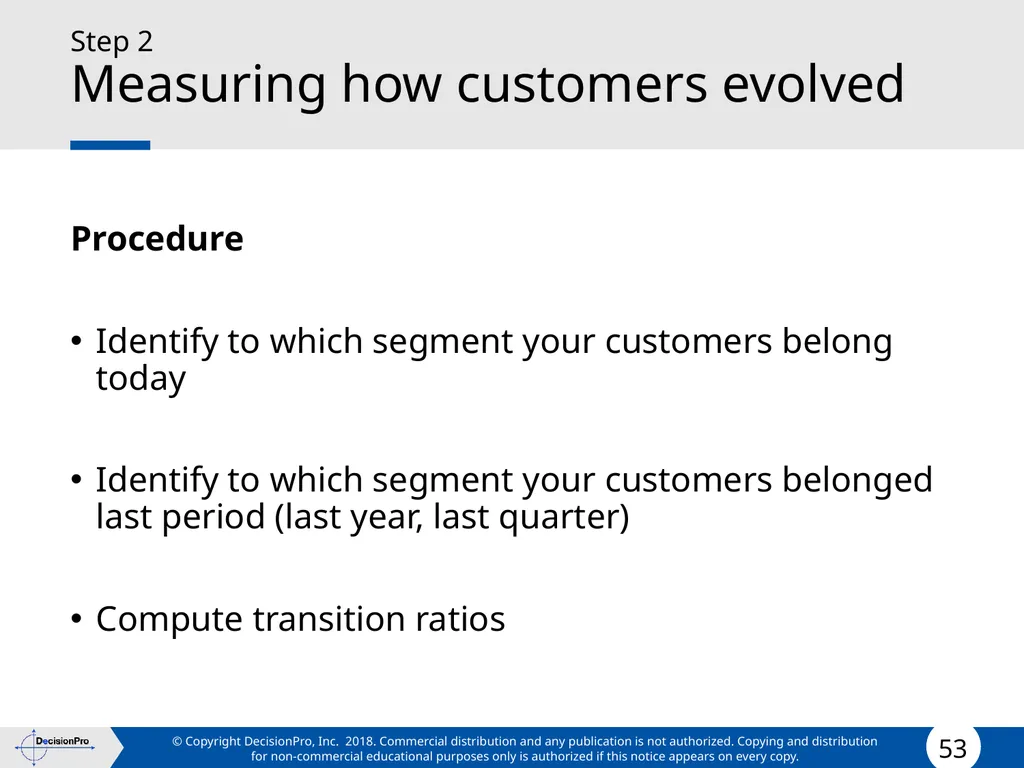
Measuring how customers evolved Procedure
Identify to which segment your customers belong today
Identify to which segment your customers belonged last period (last year, last quarter)
Compute transition ratios<br>
Identify to which segment your customers belong today
Identify to which segment your customers belonged last period (last year, last quarter)
Compute transition ratios<br>
54
Step 2
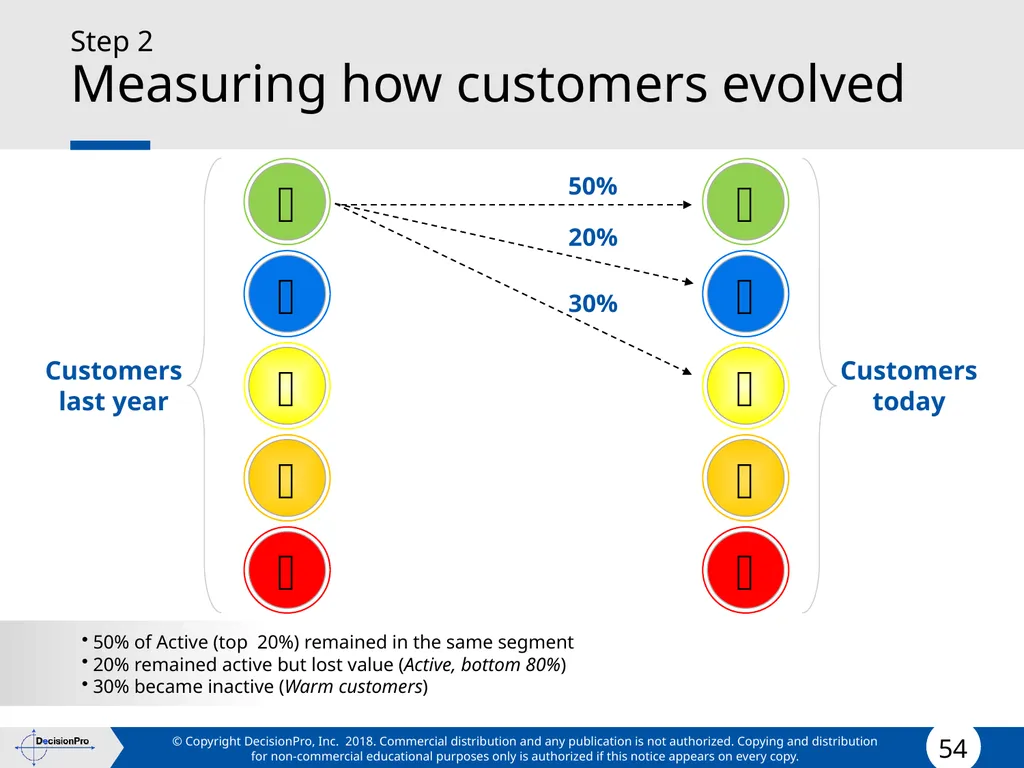
Measuring how customers evolved 50% of Active (top 20%) remained in the same segment
20% remained active but lost value (Active, bottom 80%)
30% became inactive (Warm customers) Customers
last year Customers
today 50% 20% 30%<br>
20% remained active but lost value (Active, bottom 80%)
30% became inactive (Warm customers) Customers
last year Customers
today 50% 20% 30%<br>
55
Step 2
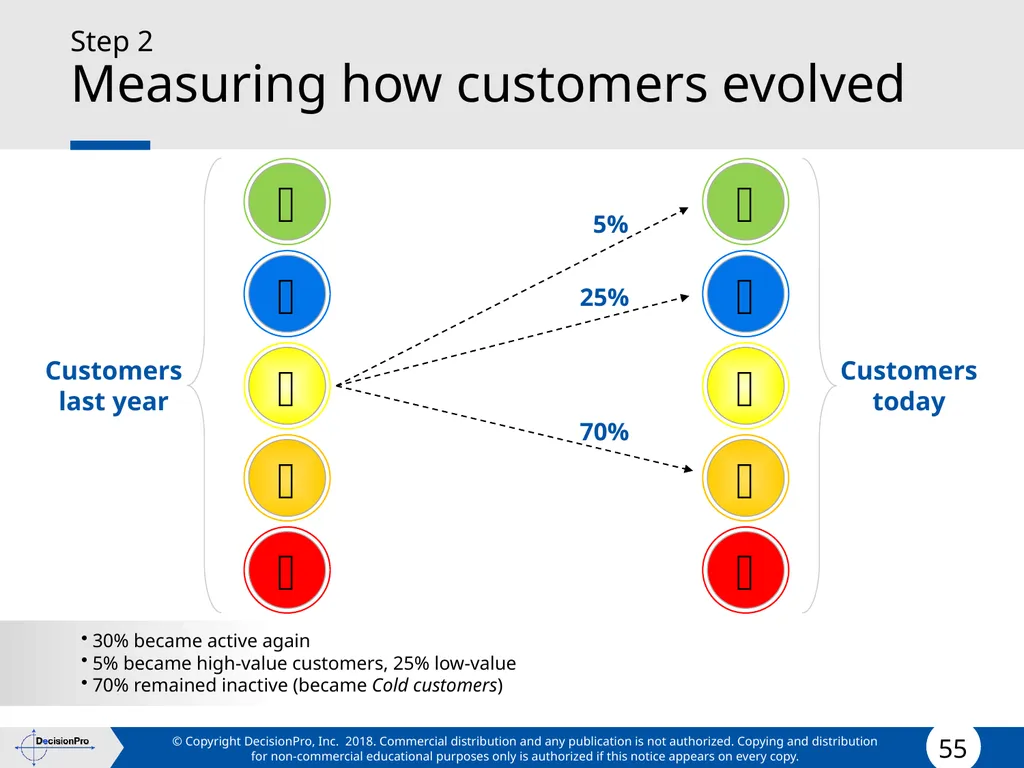
Measuring how customers evolved 30% became active again
5% became high-value customers, 25% low-value
70% remained inactive (became Cold customers) Customers
last year Customers
today 25% 5% 70%<br>
5% became high-value customers, 25% low-value
70% remained inactive (became Cold customers) Customers
last year Customers
today 25% 5% 70%<br>
56
Step 2
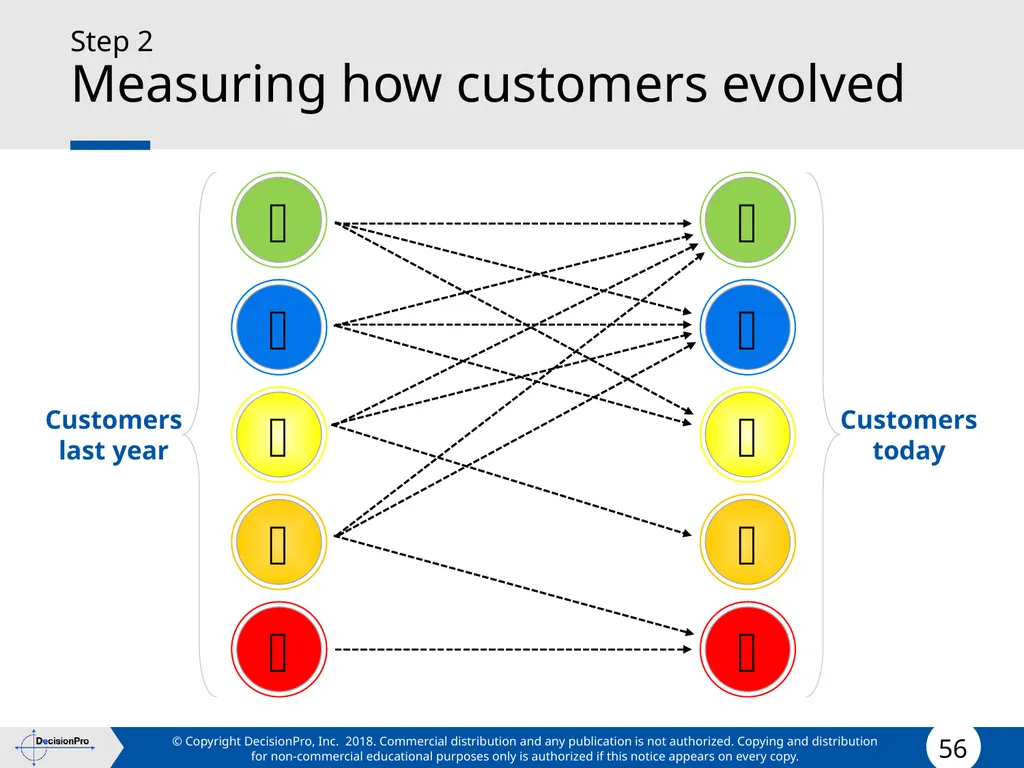
Measuring how customers evolved Customers
last year Customers
today<br>
last year Customers
today<br>
57
Step 2
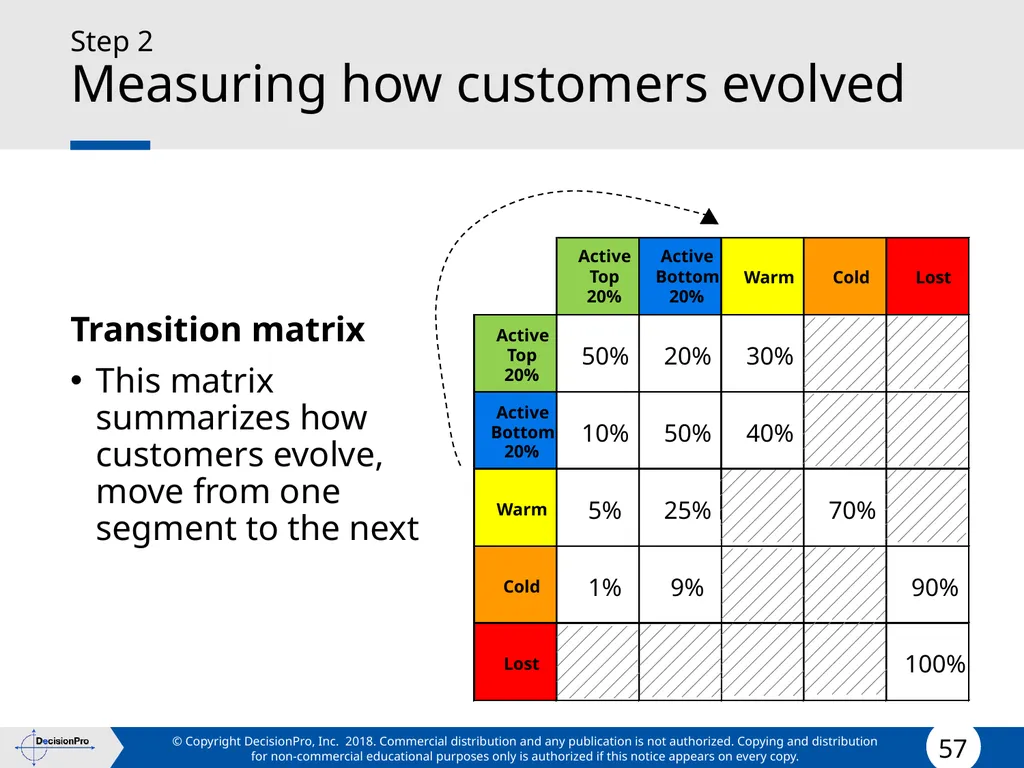
Measuring how customers evolved Transition matrix
This matrix summarizes how customers evolve, move from one segment to the next<br>
This matrix summarizes how customers evolve, move from one segment to the next<br>
58
Step 2
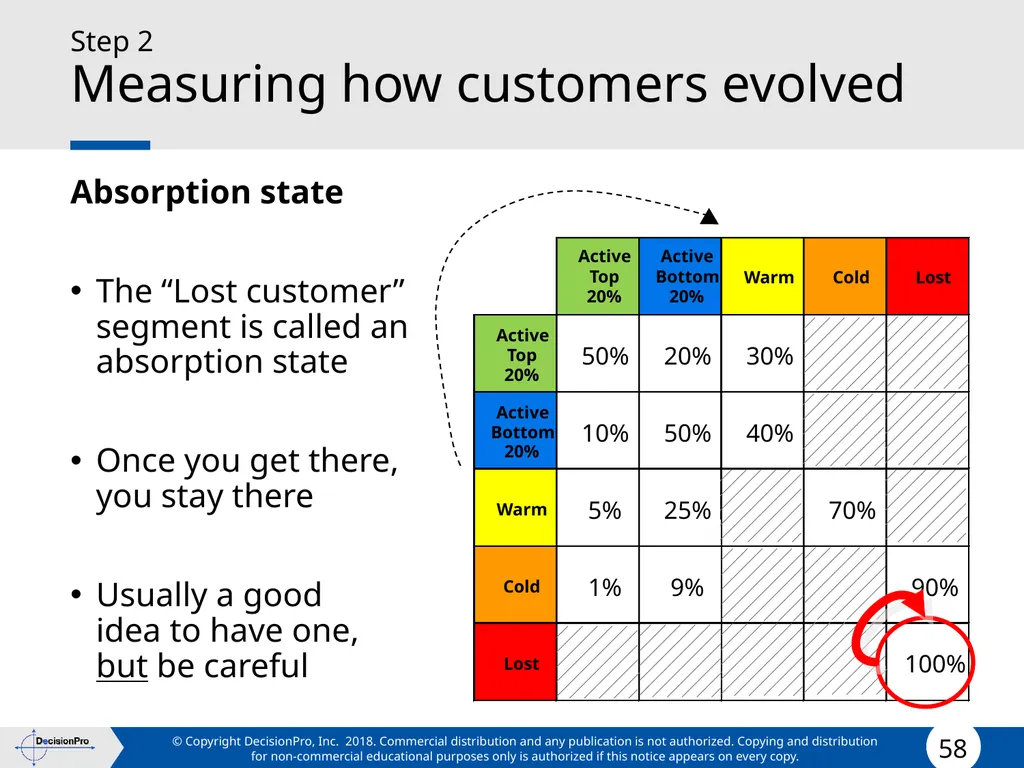
Measuring how customers evolved Absorption state
The “Lost customer” segment is called an absorption state
Once you get there, you stay there
Usually a good idea to have one, but be careful<br>
The “Lost customer” segment is called an absorption state
Once you get there, you stay there
Usually a good idea to have one, but be careful<br>
59
Step 3
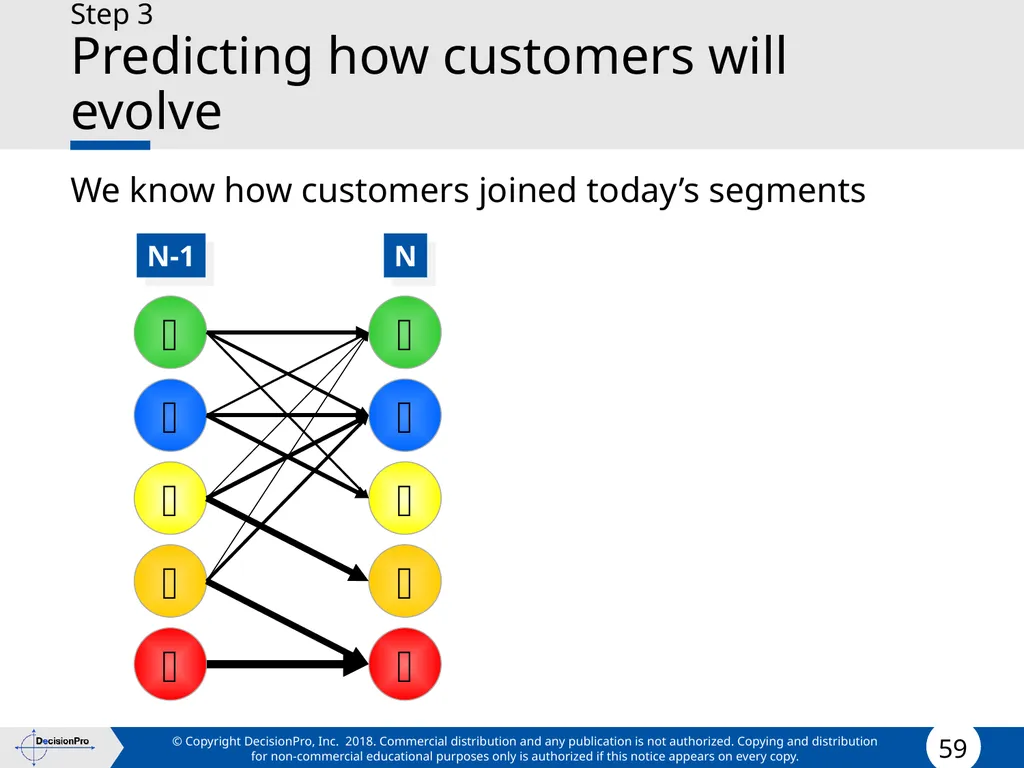
Predicting how customers will evolve We know how customers joined today’s segments N-1 N <br>
60
Step 3
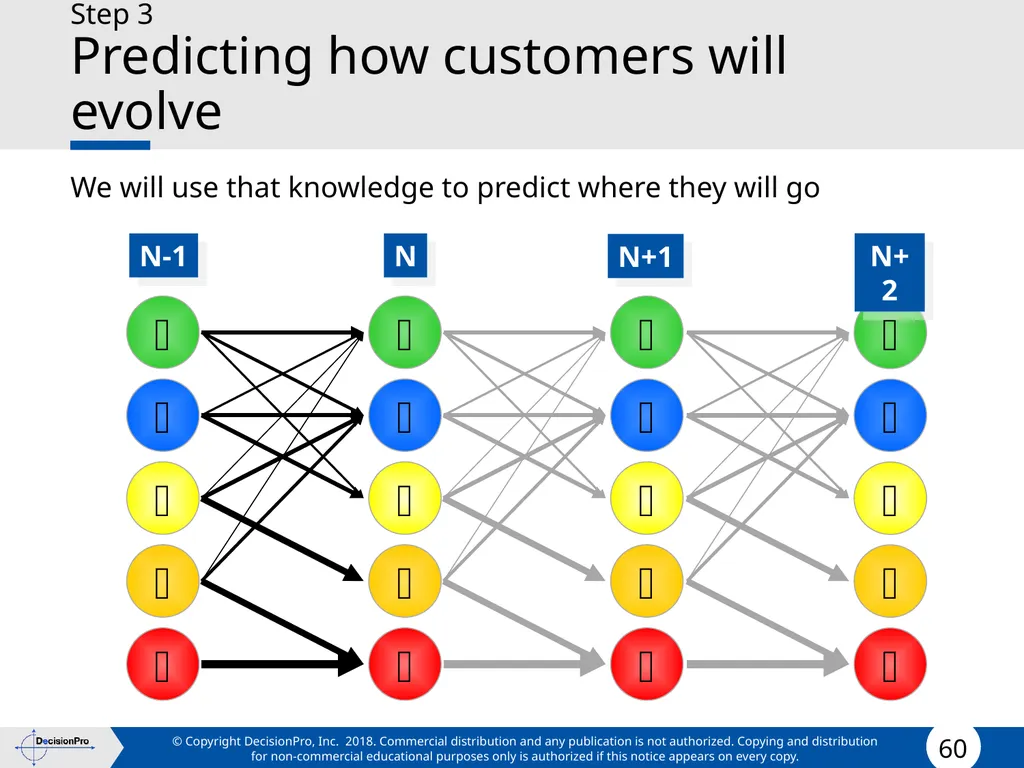
Predicting how customers will evolve We will use that knowledge to predict where they will go N-1 N N+1 N+2<br>
61
Step 3
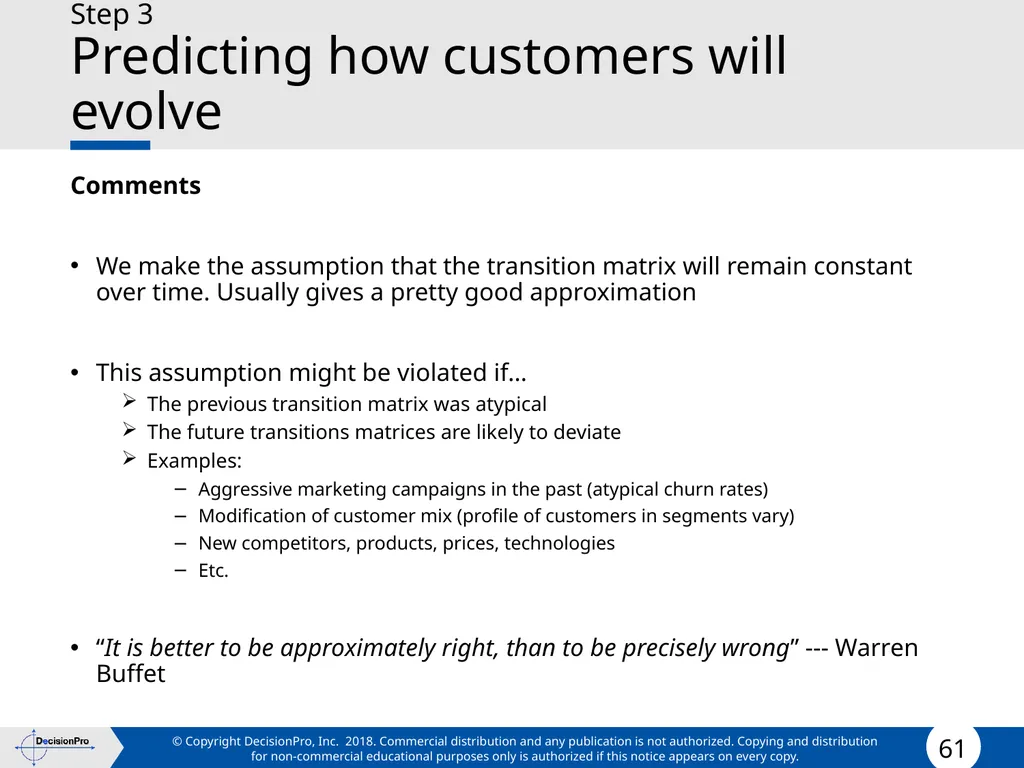
Predicting how customers will evolve Comments
We make the assumption that the transition matrix will remain constant over time. Usually gives a pretty good approximation
This assumption might be violated if…
The previous transition matrix was atypical
The future transitions matrices are likely to deviate
Examples:
Aggressive marketing campaigns in the past (atypical churn rates)
Modification of customer mix (profile of customers in segments vary)
New competitors, products, prices, technologies
Etc.
“It is better to be approximately right, than to be precisely wrong” --- Warren Buffet<br>
We make the assumption that the transition matrix will remain constant over time. Usually gives a pretty good approximation
This assumption might be violated if…
The previous transition matrix was atypical
The future transitions matrices are likely to deviate
Examples:
Aggressive marketing campaigns in the past (atypical churn rates)
Modification of customer mix (profile of customers in segments vary)
New competitors, products, prices, technologies
Etc.
“It is better to be approximately right, than to be precisely wrong” --- Warren Buffet<br>
62
Step 3
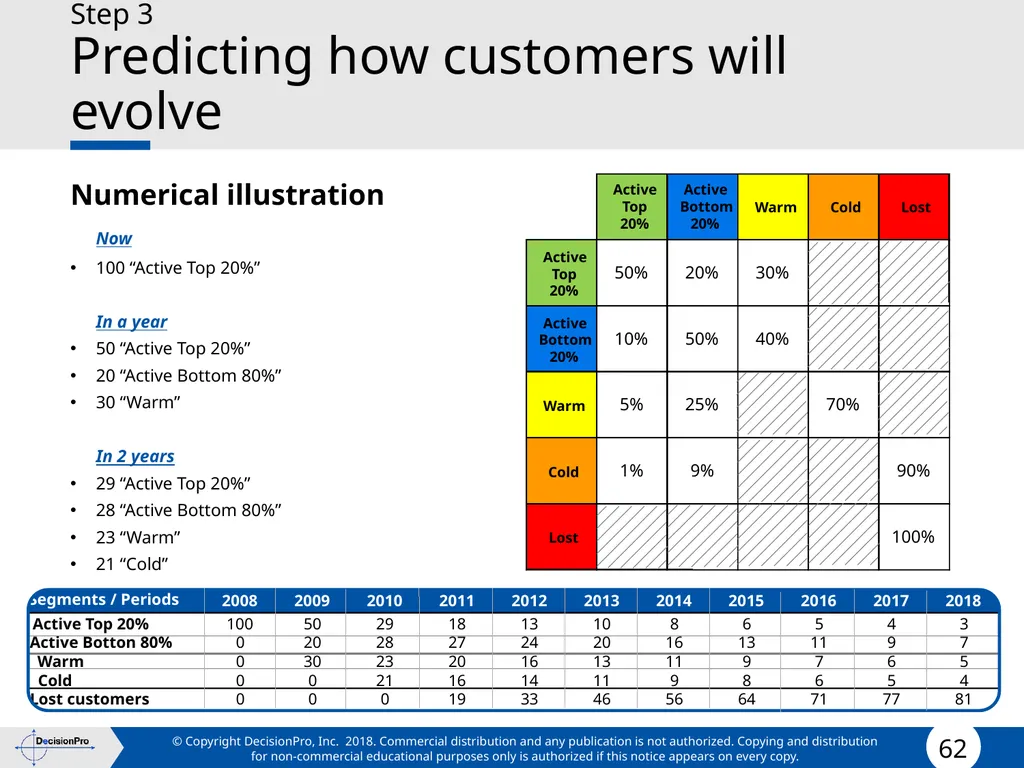
Predicting how customers will evolve Numerical illustration
Now
100 “Active Top 20%”
In a year
50 “Active Top 20%”
20 “Active Bottom 80%”
30 “Warm”
In 2 years
29 “Active Top 20%”
28 “Active Bottom 80%”
23 “Warm”
21 “Cold”<br>
Now
100 “Active Top 20%”
In a year
50 “Active Top 20%”
20 “Active Bottom 80%”
30 “Warm”
In 2 years
29 “Active Top 20%”
28 “Active Bottom 80%”
23 “Warm”
21 “Cold”<br>
63
Step 3
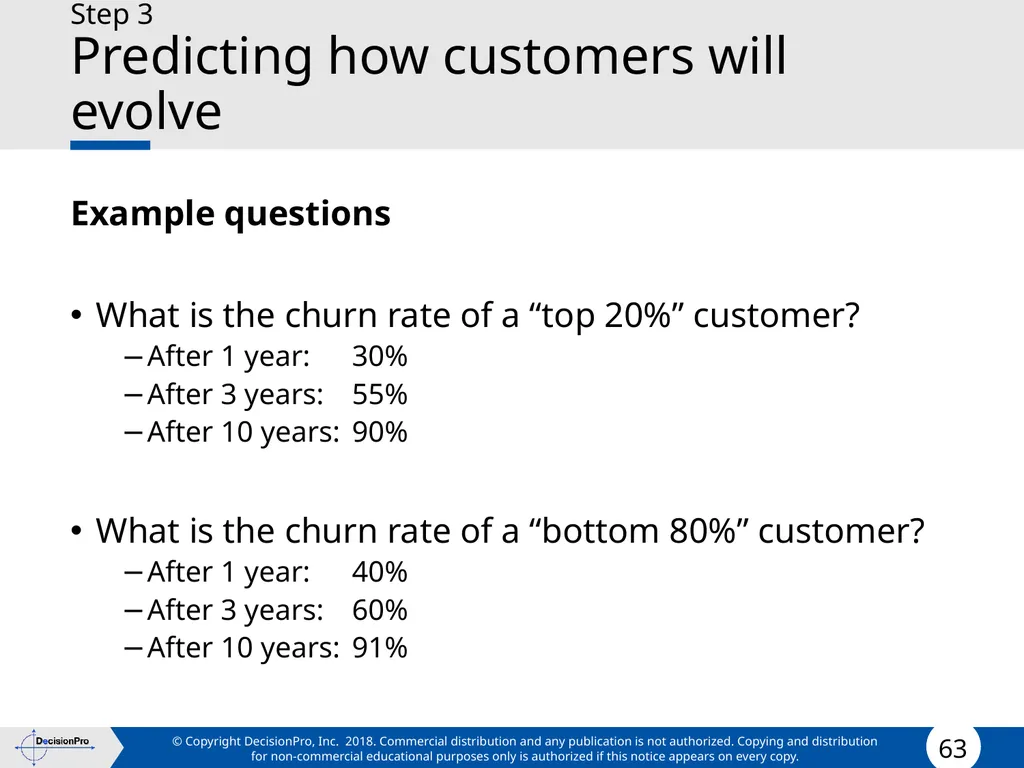
Predicting how customers will evolve Example questions
What is the churn rate of a “top 20%” customer?
After 1 year: 30%
After 3 years: 55%
After 10 years: 90%
What is the churn rate of a “bottom 80%” customer?
After 1 year: 40%
After 3 years: 60%
After 10 years: 91%<br>
What is the churn rate of a “top 20%” customer?
After 1 year: 30%
After 3 years: 55%
After 10 years: 90%
What is the churn rate of a “bottom 80%” customer?
After 1 year: 40%
After 3 years: 60%
After 10 years: 91%<br>
64
Step 4
Discounting future revenues How much will be worth an “Active Top 20%” customer in a year, or five years?
The model assumes that customers in each segments will generate as much revenues and margins tomorrow as they do today
But
A dollar tomorrow is not worth as much as a dollar today
We apply a
Discount Factor
to future revenues<br>
The model assumes that customers in each segments will generate as much revenues and margins tomorrow as they do today
But
A dollar tomorrow is not worth as much as a dollar today
We apply a
Discount Factor
to future revenues<br>
65
Step 4
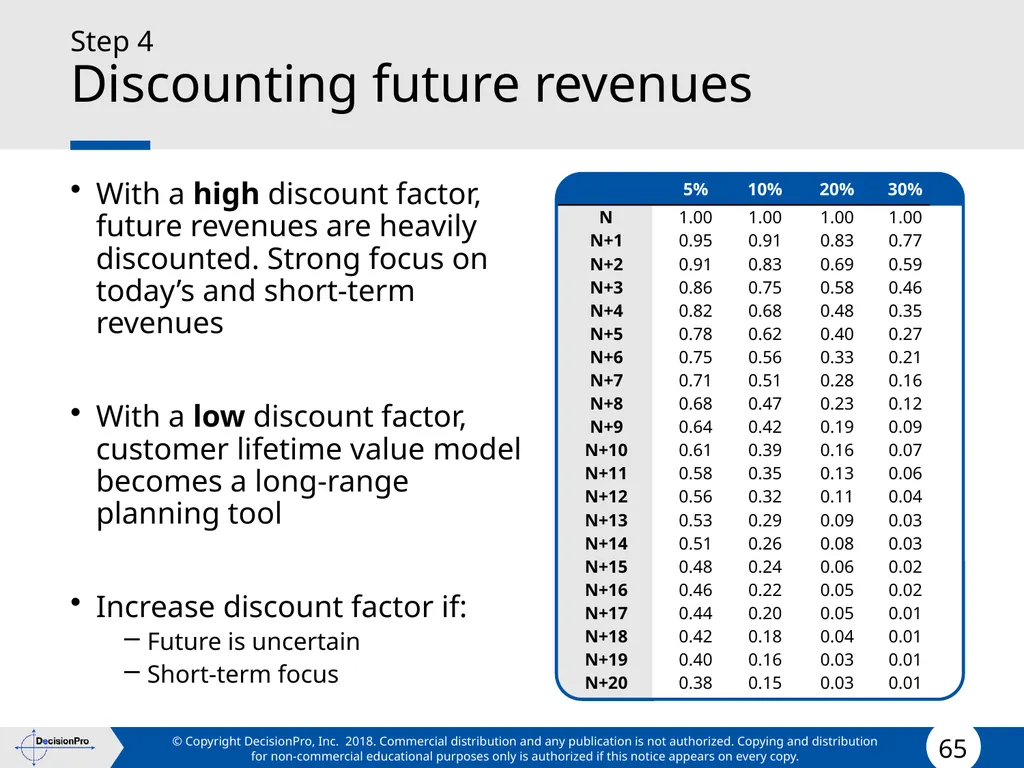
Discounting future revenues With a high discount factor, future revenues are heavily discounted. Strong focus on today’s and short-term revenues
With a low discount factor, customer lifetime value model becomes a long-range planning tool
Increase discount factor if:
Future is uncertain
Short-term focus<br>
With a low discount factor, customer lifetime value model becomes a long-range planning tool
Increase discount factor if:
Future is uncertain
Short-term focus<br>
66
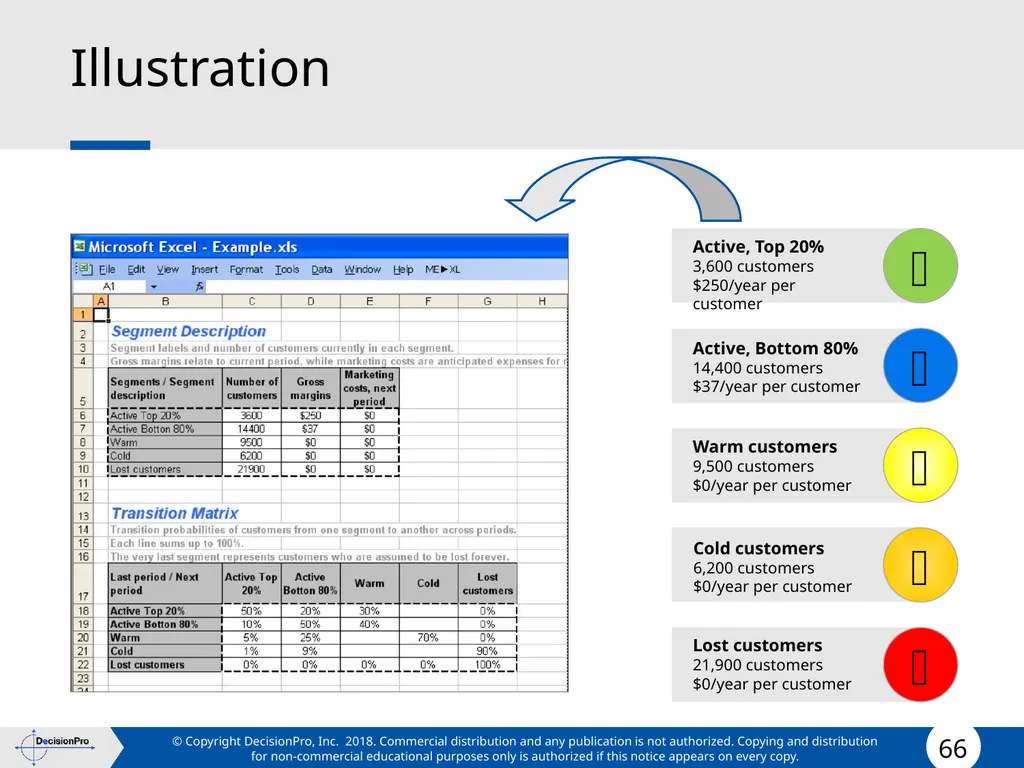
Illustration Active, Top 20%
3,600 customers
$250/year per customer Active, Bottom 80%
14,400 customers
$37/year per customer Warm customers
9,500 customers
$0/year per customer Cold customers
6,200 customers
$0/year per customer Lost customers
21,900 customers
$0/year per customer<br>
3,600 customers
$250/year per customer Active, Bottom 80%
14,400 customers
$37/year per customer Warm customers
9,500 customers
$0/year per customer Cold customers
6,200 customers
$0/year per customer Lost customers
21,900 customers
$0/year per customer<br>
67
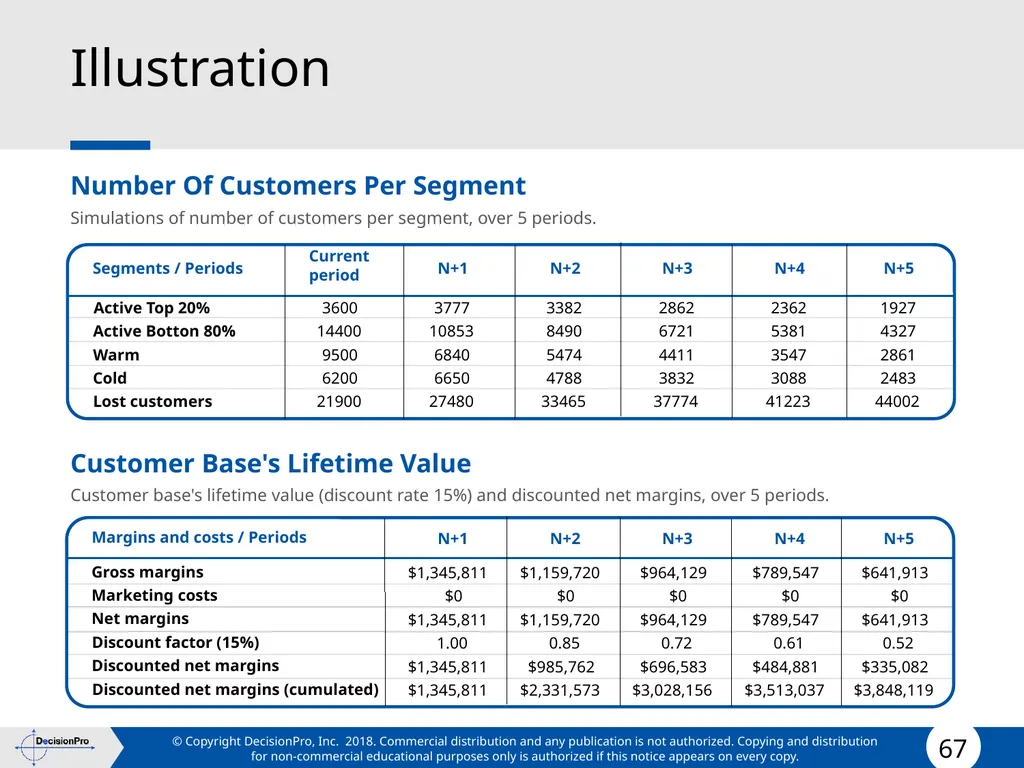
Illustration Number Of Customers Per Segment
Simulations of number of customers per segment, over 5 periods.
Customer Base's Lifetime Value
Customer base's lifetime value (discount rate 15%) and discounted net margins, over 5 periods.<br>
Simulations of number of customers per segment, over 5 periods.
Customer Base's Lifetime Value
Customer base's lifetime value (discount rate 15%) and discounted net margins, over 5 periods.<br>
68
Illustration Question #1
How much is worth a customer in today’s dollars? (15%)
Figures do not include current period, only future revenues<br>
How much is worth a customer in today’s dollars? (15%)
Figures do not include current period, only future revenues<br>
69
Illustration Question #2
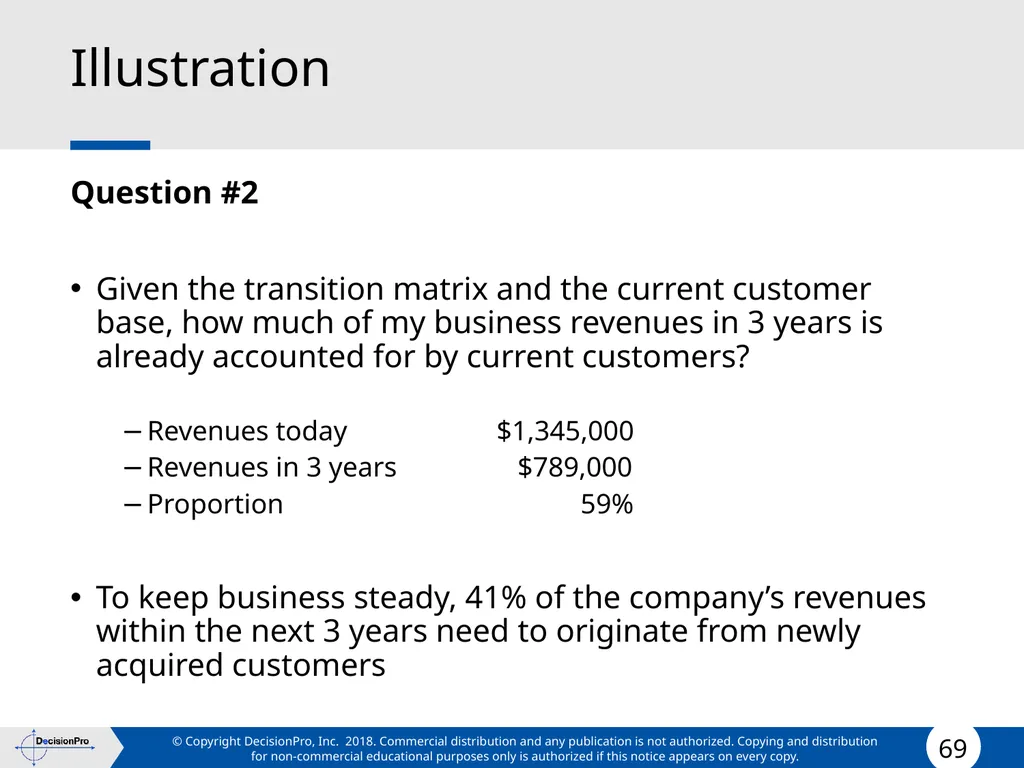
Given the transition matrix and the current customer base, how much of my business revenues in 3 years is already accounted for by current customers?
Revenues today $1,345,000
Revenues in 3 years $789,000
Proportion 59%
To keep business steady, 41% of the company’s revenues within the next 3 years need to originate from newly acquired customers<br>
Given the transition matrix and the current customer base, how much of my business revenues in 3 years is already accounted for by current customers?
Revenues today $1,345,000
Revenues in 3 years $789,000
Proportion 59%
To keep business steady, 41% of the company’s revenues within the next 3 years need to originate from newly acquired customers<br>
70
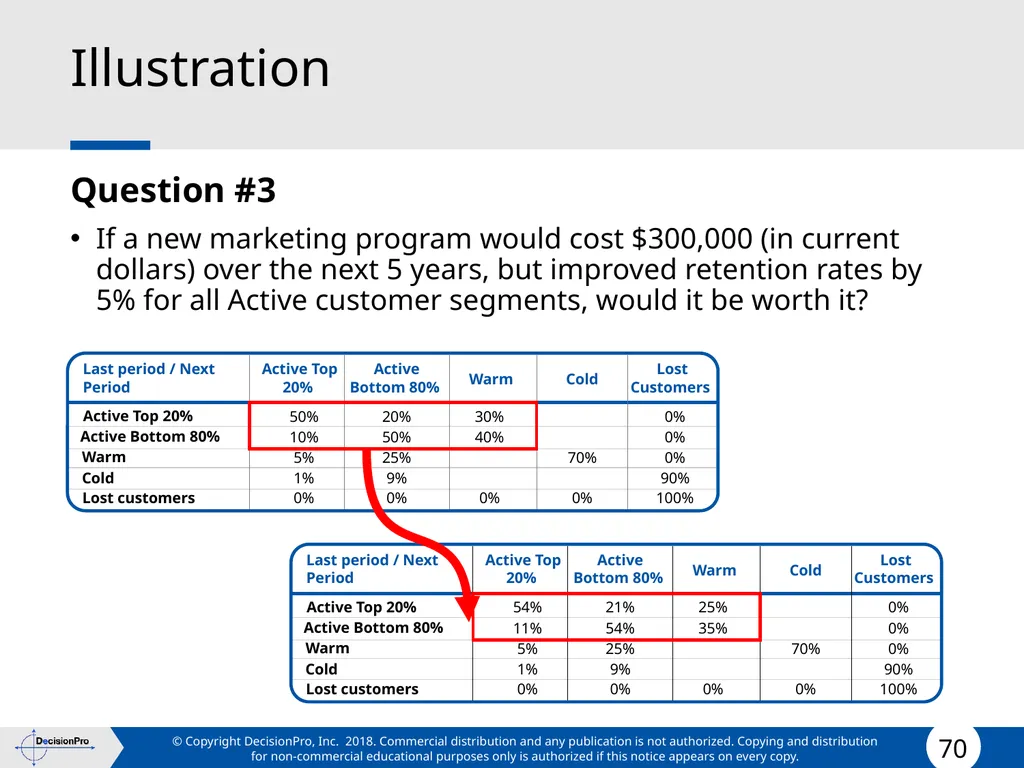
Illustration Question #3
If a new marketing program would cost $300,000 (in current dollars) over the next 5 years, but improved retention rates by 5% for all Active customer segments, would it be worth it?<br>
If a new marketing program would cost $300,000 (in current dollars) over the next 5 years, but improved retention rates by 5% for all Active customer segments, would it be worth it?<br>
71
Illustration Question #3
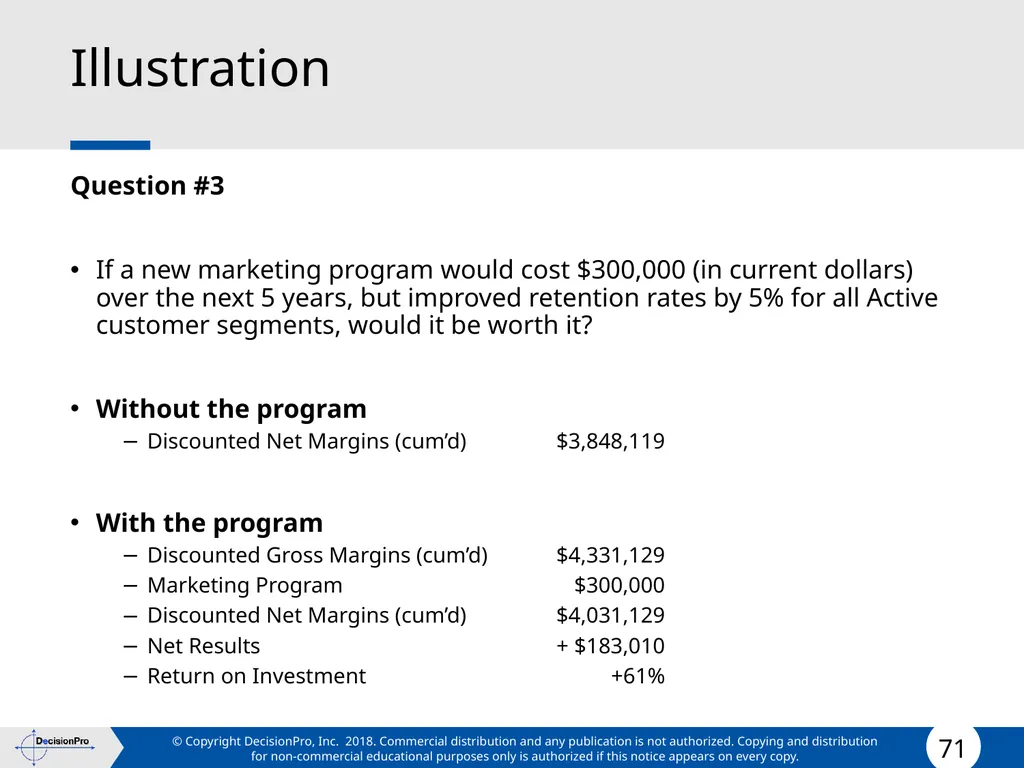
If a new marketing program would cost $300,000 (in current dollars) over the next 5 years, but improved retention rates by 5% for all Active customer segments, would it be worth it?
Without the program
Discounted Net Margins (cum’d) $3,848,119
With the program
Discounted Gross Margins (cum’d) $4,331,129
Marketing Program $300,000
Discounted Net Margins (cum’d) $4,031,129
Net Results + $183,010
Return on Investment +61%<br>
If a new marketing program would cost $300,000 (in current dollars) over the next 5 years, but improved retention rates by 5% for all Active customer segments, would it be worth it?
Without the program
Discounted Net Margins (cum’d) $3,848,119
With the program
Discounted Gross Margins (cum’d) $4,331,129
Marketing Program $300,000
Discounted Net Margins (cum’d) $4,031,129
Net Results + $183,010
Return on Investment +61%<br>
72
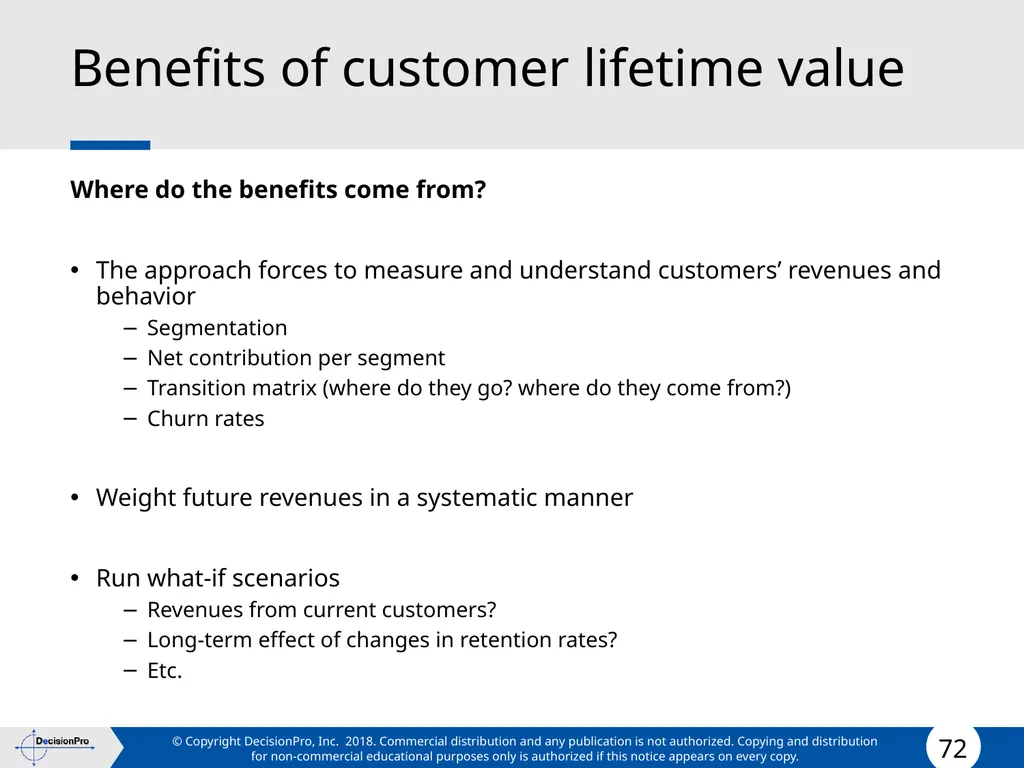
Benefits of customer lifetime value Where do the benefits come from?
The approach forces to measure and understand customers’ revenues and behavior
Segmentation
Net contribution per segment
Transition matrix (where do they go? where do they come from?)
Churn rates
Weight future revenues in a systematic manner
Run what-if scenarios
Revenues from current customers?
Long-term effect of changes in retention rates?
Etc.<br>
The approach forces to measure and understand customers’ revenues and behavior
Segmentation
Net contribution per segment
Transition matrix (where do they go? where do they come from?)
Churn rates
Weight future revenues in a systematic manner
Run what-if scenarios
Revenues from current customers?
Long-term effect of changes in retention rates?
Etc.<br>
73
Summary of Customer Value Assessment Customer value is hidden, but can be assessed using several different techniques.
A company generates “value from customers” by understanding the value of its offerings to its customers.
Behavior-based targeting can generate incremental short-term profits for a company.
To generate long-term and sustainable profits from customers, a company has to understand and manage Customer Lifetime Value (CLV), which includes both the economic value and the relationship value associated with a customer.<br>
A company generates “value from customers” by understanding the value of its offerings to its customers.
Behavior-based targeting can generate incremental short-term profits for a company.
To generate long-term and sustainable profits from customers, a company has to understand and manage Customer Lifetime Value (CLV), which includes both the economic value and the relationship value associated with a customer.<br>