
Vision Zero Update City Council Briefing March 6,
BR
Published · 67 slides · 0 views

1 / 1
Description
Vision Zero Update City Council Briefing March 6, 2024 Ghassan Gus Khankarli, Ph.D. P.E., Director Department of Transportation and Other Department Representatives Presentation Overview 2 Purpose Background Data Behavior Actions
Related Topics
Share
Embed code
Download this presentation From Below
"Vision Zero Update City Council Briefing March 6," is the property of its rightful owner. Permission is granted to download and print the materials on this website for personal, non-commercial use only, and to display it on your personal computer provided you do not modify the materials and that you retain all copyright notices contained in the materials. By downloading content from our website, you accept the terms of this agreement.
Presentation Transcript
01
Vision Zero Update City Council Briefing
March 6, 2024 Ghassan “Gus” Khankarli, Ph.D. P.E., Director
Department of Transportation
and
Other Department Representatives<br>
March 6, 2024 Ghassan “Gus” Khankarli, Ph.D. P.E., Director
Department of Transportation
and
Other Department Representatives<br>
02
Presentation Overview 2 Purpose
Background
Data
Behavior
Actions
Coordination
Forward<br>
Background
Data
Behavior
Actions
Coordination
Forward<br>
03
Purpose 3 The purpose of this presentation is to provide an update about the Vision Zero strategies, implementation progress, and future actions.<br>
04
What is Vision Zero? 4 An internationally recognized strategy to eliminate traffic fatalities and severe injuries relating to automobile users, pedestrians and bicyclists.
Based on the belief that no loss of life is acceptable and that all traffic fatalities and severe injuries are preventable.
Encourages urban design that makes streets as easy as possible to navigate for all roadway users of all physical abilities.
Promotes safe and equitable mobility for all users, such that movement around the transportation network can be done by road users of all walks of life.<br>
Based on the belief that no loss of life is acceptable and that all traffic fatalities and severe injuries are preventable.
Encourages urban design that makes streets as easy as possible to navigate for all roadway users of all physical abilities.
Promotes safe and equitable mobility for all users, such that movement around the transportation network can be done by road users of all walks of life.<br>
05
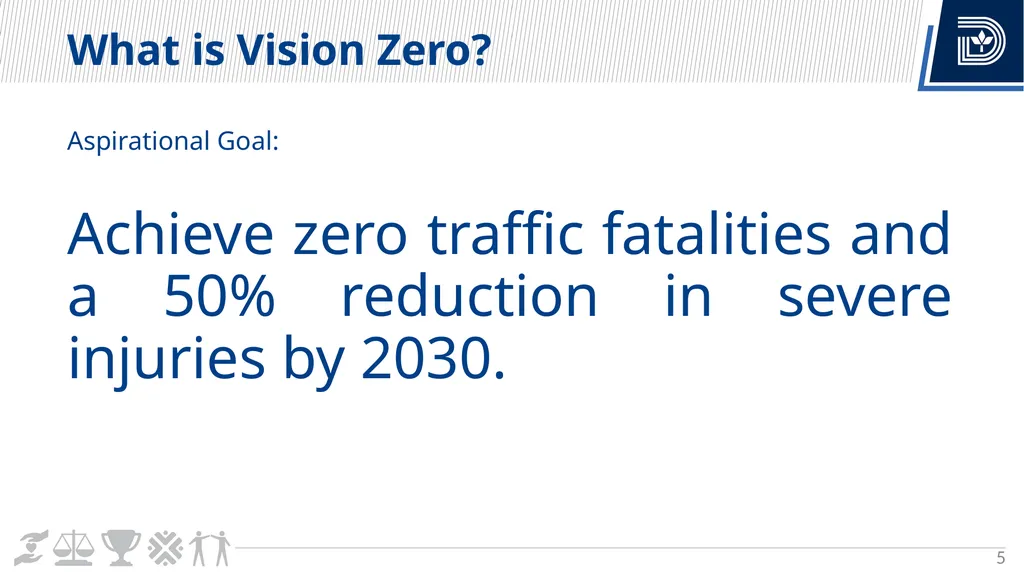
What is Vision Zero? 5 Aspirational Goal:
Achieve zero traffic fatalities and a 50% reduction in severe injuries by 2030.<br>
Achieve zero traffic fatalities and a 50% reduction in severe injuries by 2030.<br>
06
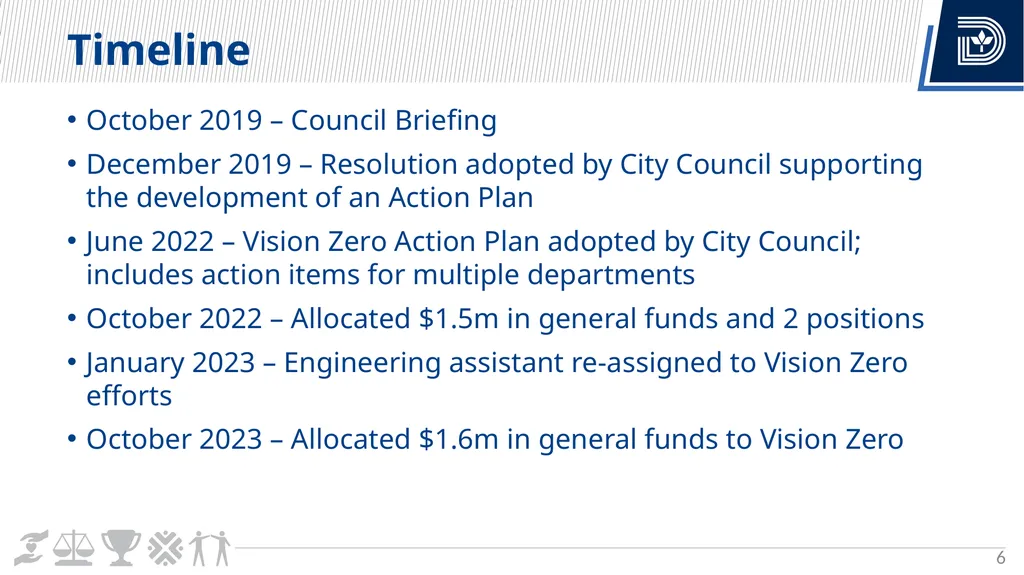
Timeline 6 October 2019 – Council Briefing
December 2019 – Resolution adopted by City Council supporting the development of an Action Plan
June 2022 – Vision Zero Action Plan adopted by City Council; includes action items for multiple departments
October 2022 – Allocated $1.5m in general funds and 2 positions
January 2023 – Engineering assistant re-assigned to Vision Zero efforts
October 2023 – Allocated $1.6m in general funds to Vision Zero<br>
December 2019 – Resolution adopted by City Council supporting the development of an Action Plan
June 2022 – Vision Zero Action Plan adopted by City Council; includes action items for multiple departments
October 2022 – Allocated $1.5m in general funds and 2 positions
January 2023 – Engineering assistant re-assigned to Vision Zero efforts
October 2023 – Allocated $1.6m in general funds to Vision Zero<br>
07
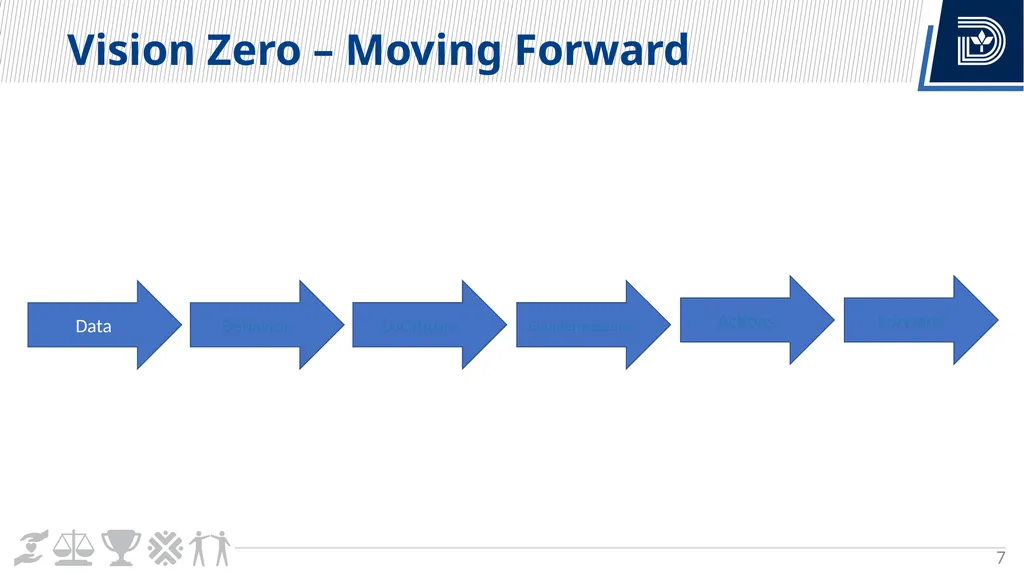
Vision Zero – Moving Forward 7 Data Behavior Locations Countermeasures Actions Forward<br>
08
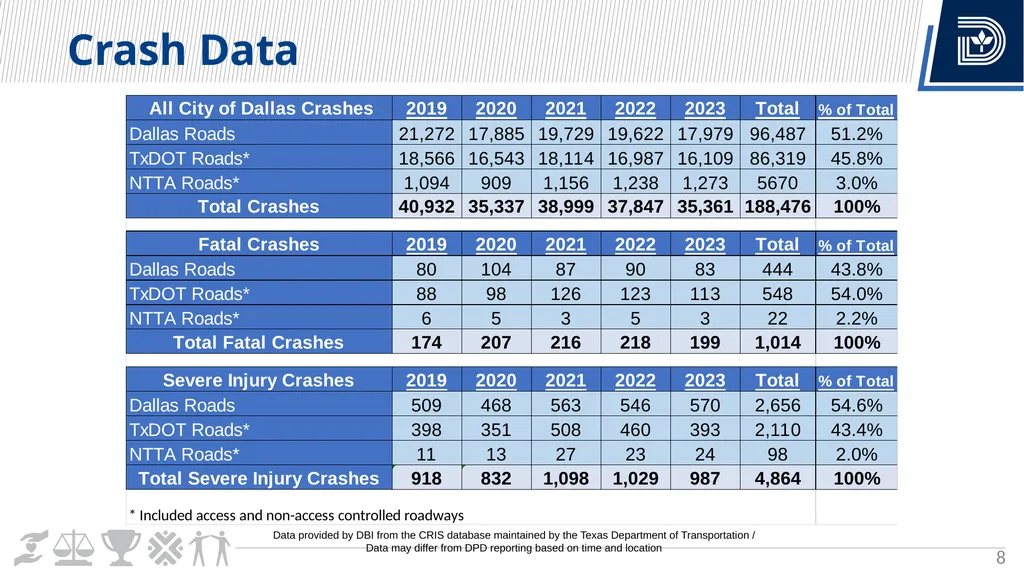
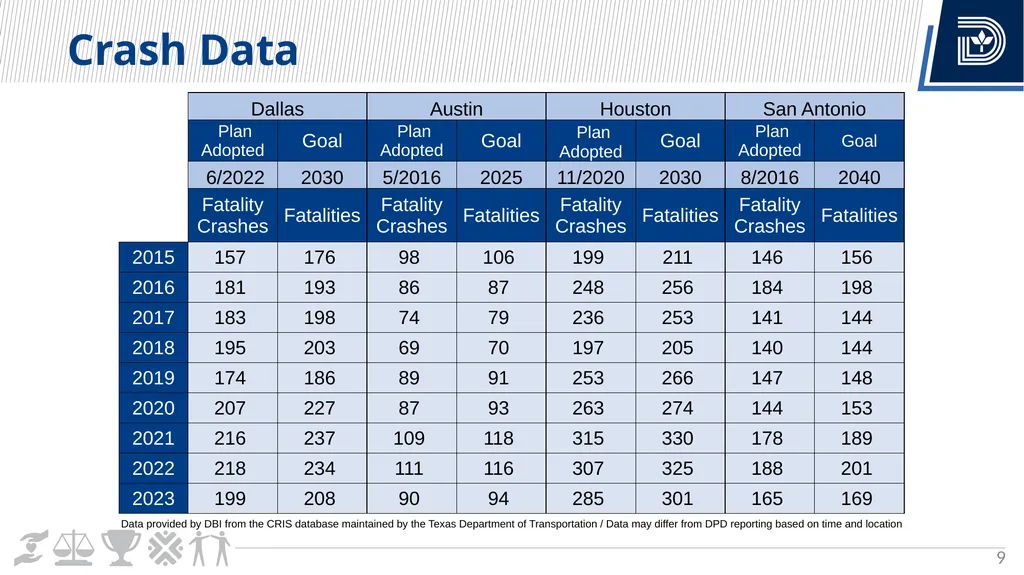
Crash Data 8 Data provided by DBI from the CRIS database maintained by the Texas Department of Transportation / Data may differ from DPD reporting based on time and location<br>
09
Crash Data 9<br>
10
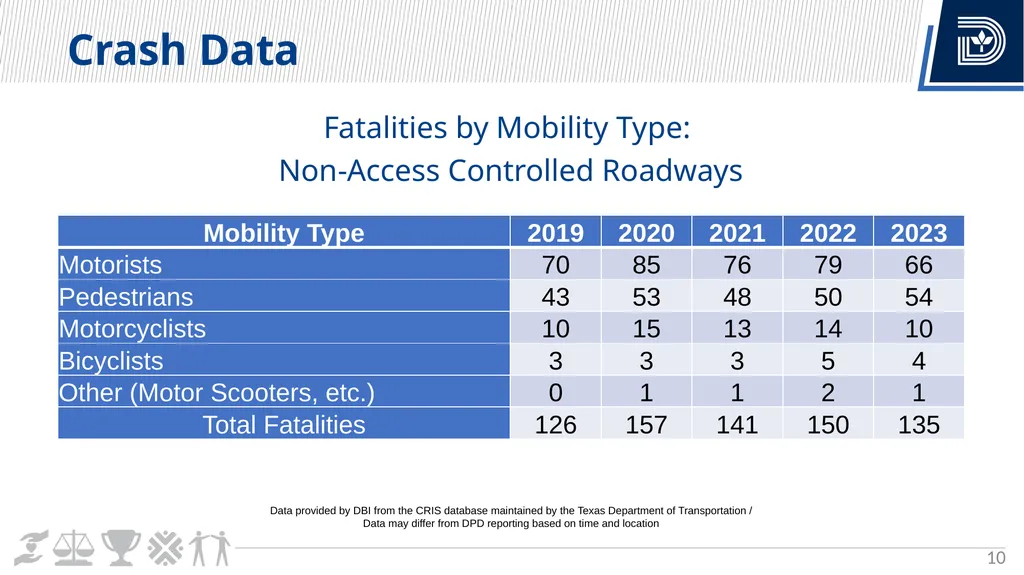
Crash Data 10 Fatalities by Mobility Type:
Non-Access Controlled Roadways Data provided by DBI from the CRIS database maintained by the Texas Department of Transportation / Data may differ from DPD reporting based on time and location<br>
Non-Access Controlled Roadways Data provided by DBI from the CRIS database maintained by the Texas Department of Transportation / Data may differ from DPD reporting based on time and location<br>
11
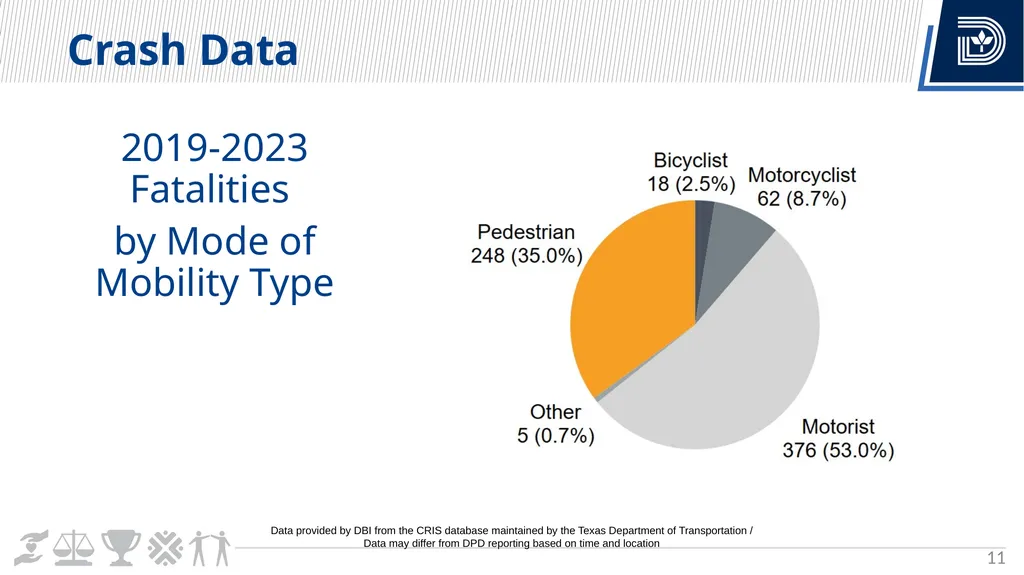
Crash Data 11 2019-2023 Fatalities
by Mode of Mobility Type Data provided by DBI from the CRIS database maintained by the Texas Department of Transportation / Data may differ from DPD reporting based on time and location<br>
by Mode of Mobility Type Data provided by DBI from the CRIS database maintained by the Texas Department of Transportation / Data may differ from DPD reporting based on time and location<br>
12
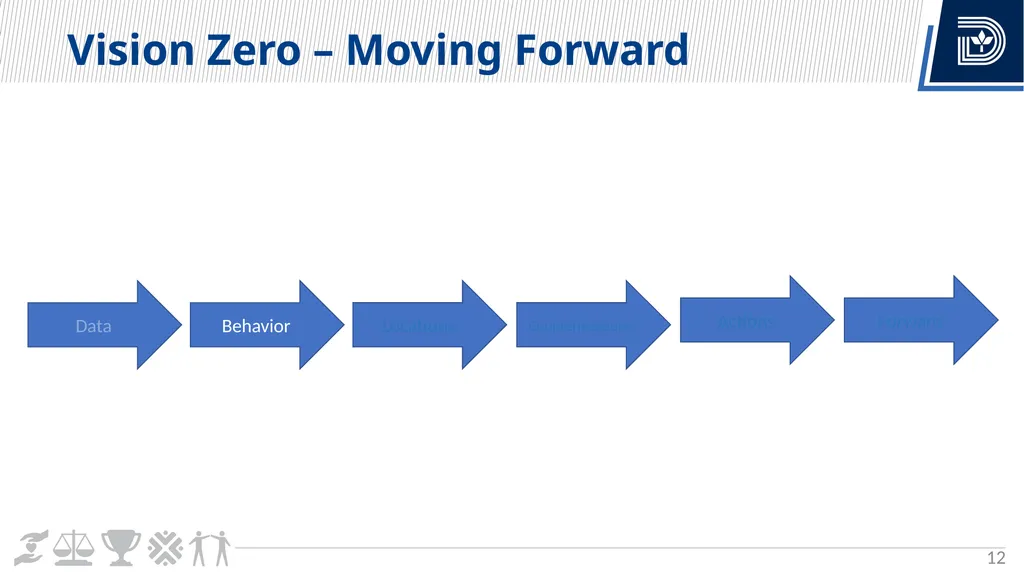
Vision Zero – Moving Forward 12 Data Behavior Locations Countermeasures Actions Forward<br>
13
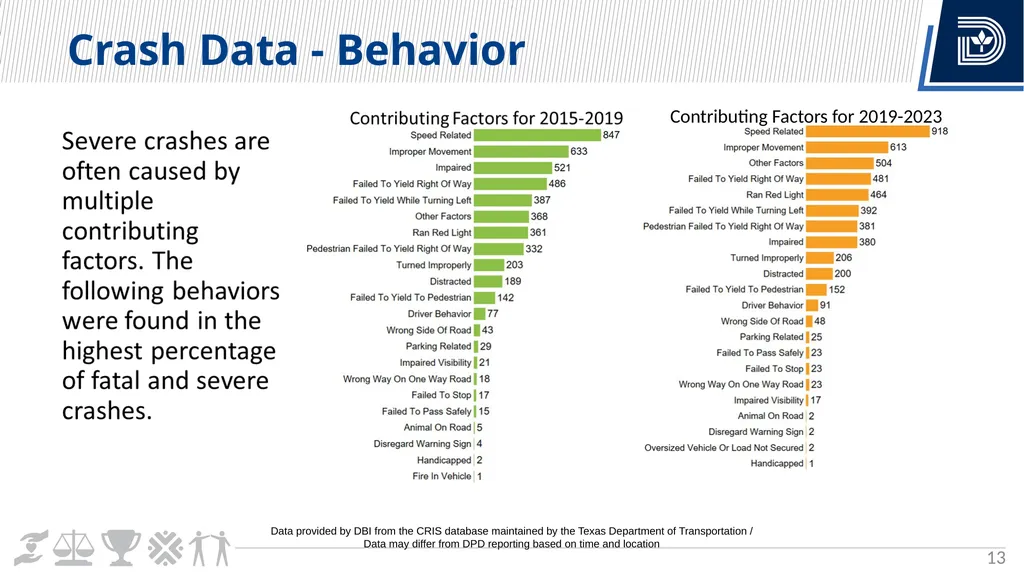
Crash Data - Behavior 13 Contributing Factors for 2019-2023 Data provided by DBI from the CRIS database maintained by the Texas Department of Transportation / Data may differ from DPD reporting based on time and location<br>
14
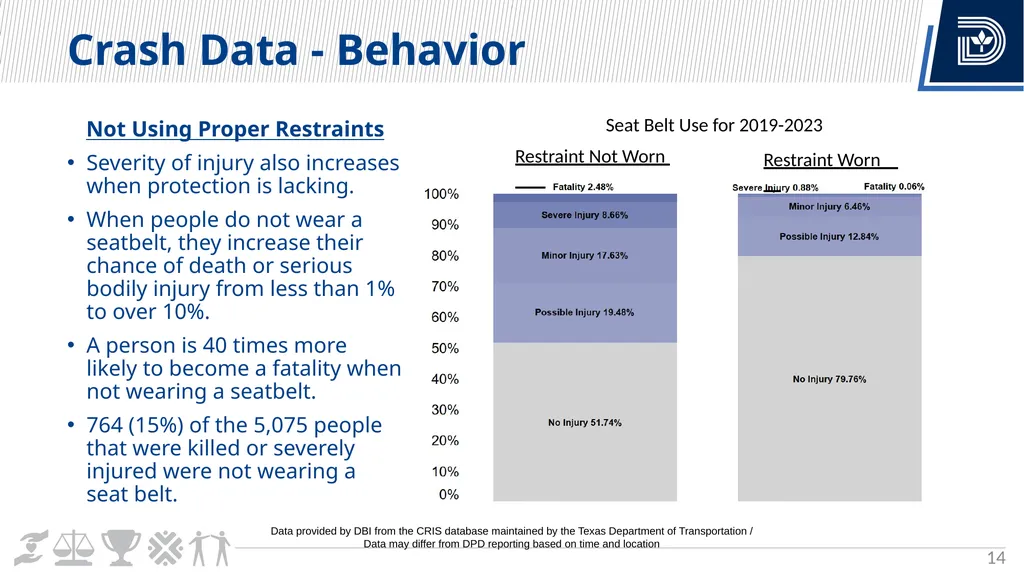
Crash Data - Behavior 14 Not Using Proper Restraints
Severity of injury also increases when protection is lacking.
When people do not wear a seatbelt, they increase their chance of death or serious bodily injury from less than 1% to over 10%.
A person is 40 times more likely to become a fatality when not wearing a seatbelt.
764 (15%) of the 5,075 people that were killed or severely injured were not wearing a seat belt. Seat Belt Use for 2019-2023 Restraint Not Worn Restraint Worn Data provided by DBI from the CRIS database maintained by the Texas Department of Transportation / Data may differ from DPD reporting based on time and location<br>
Severity of injury also increases when protection is lacking.
When people do not wear a seatbelt, they increase their chance of death or serious bodily injury from less than 1% to over 10%.
A person is 40 times more likely to become a fatality when not wearing a seatbelt.
764 (15%) of the 5,075 people that were killed or severely injured were not wearing a seat belt. Seat Belt Use for 2019-2023 Restraint Not Worn Restraint Worn Data provided by DBI from the CRIS database maintained by the Texas Department of Transportation / Data may differ from DPD reporting based on time and location<br>
15
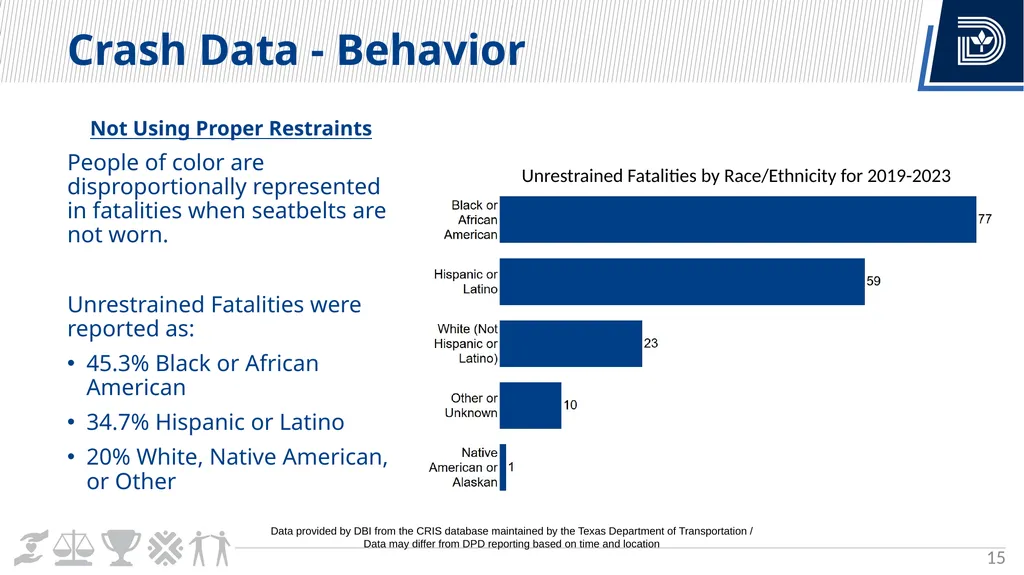
Crash Data - Behavior 15 Not Using Proper Restraints
People of color are disproportionally represented in fatalities when seatbelts are not worn.
Unrestrained Fatalities were reported as:
45.3% Black or African American
34.7% Hispanic or Latino
20% White, Native American, or Other Unrestrained Fatalities by Race/Ethnicity for 2019-2023 Data provided by DBI from the CRIS database maintained by the Texas Department of Transportation / Data may differ from DPD reporting based on time and location<br>
People of color are disproportionally represented in fatalities when seatbelts are not worn.
Unrestrained Fatalities were reported as:
45.3% Black or African American
34.7% Hispanic or Latino
20% White, Native American, or Other Unrestrained Fatalities by Race/Ethnicity for 2019-2023 Data provided by DBI from the CRIS database maintained by the Texas Department of Transportation / Data may differ from DPD reporting based on time and location<br>
16
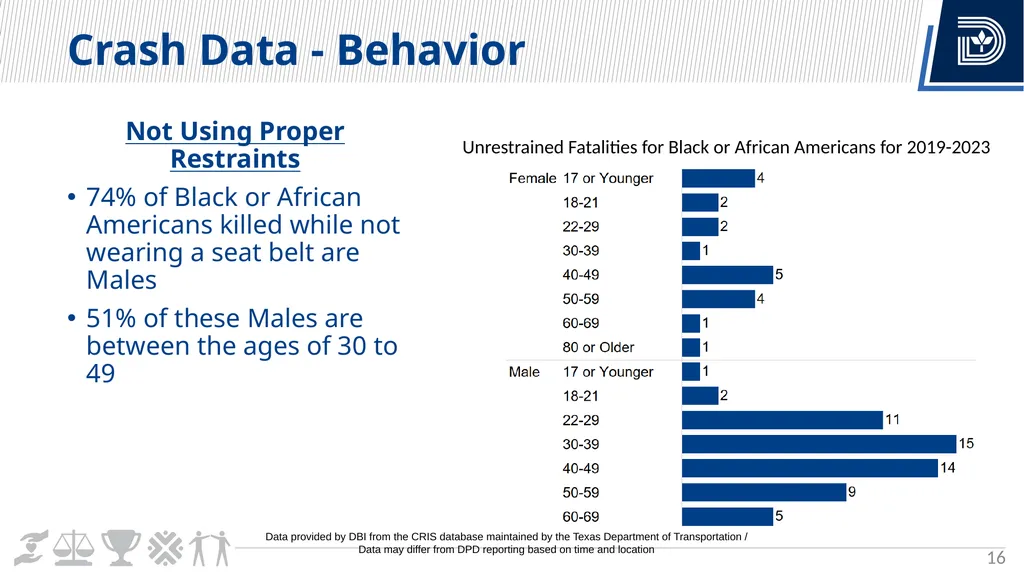
Crash Data - Behavior 16 Not Using Proper Restraints
74% of Black or African Americans killed while not wearing a seat belt are Males
51% of these Males are between the ages of 30 to 49 Unrestrained Fatalities for Black or African Americans for 2019-2023 Data provided by DBI from the CRIS database maintained by the Texas Department of Transportation / Data may differ from DPD reporting based on time and location<br>
74% of Black or African Americans killed while not wearing a seat belt are Males
51% of these Males are between the ages of 30 to 49 Unrestrained Fatalities for Black or African Americans for 2019-2023 Data provided by DBI from the CRIS database maintained by the Texas Department of Transportation / Data may differ from DPD reporting based on time and location<br>
17
Crash Data - Behavior 17 Not Using Proper Restraints
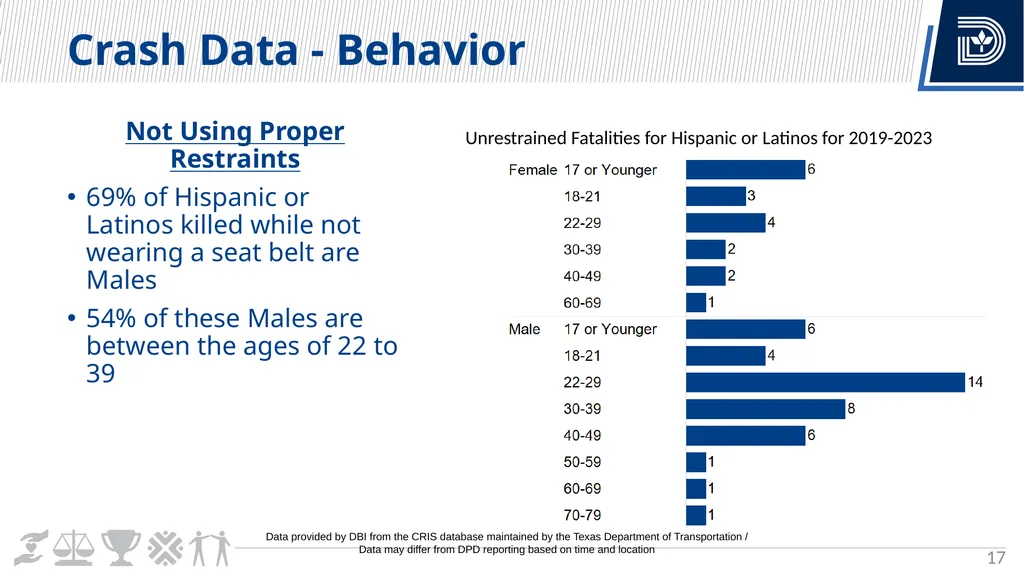
69% of Hispanic or Latinos killed while not wearing a seat belt are Males
54% of these Males are between the ages of 22 to 39 Unrestrained Fatalities for Hispanic or Latinos for 2019-2023 Data provided by DBI from the CRIS database maintained by the Texas Department of Transportation / Data may differ from DPD reporting based on time and location<br>
69% of Hispanic or Latinos killed while not wearing a seat belt are Males
54% of these Males are between the ages of 22 to 39 Unrestrained Fatalities for Hispanic or Latinos for 2019-2023 Data provided by DBI from the CRIS database maintained by the Texas Department of Transportation / Data may differ from DPD reporting based on time and location<br>
18
Crash Data - Behavior 18 Red Light Cameras
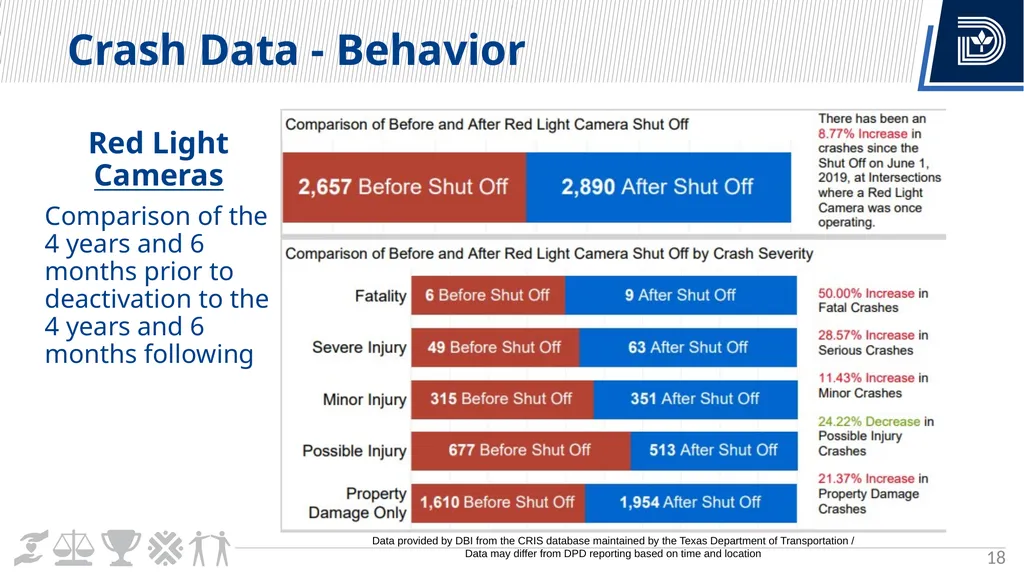
Comparison of the 4 years and 6 months prior to deactivation to the 4 years and 6 months following Data provided by DBI from the CRIS database maintained by the Texas Department of Transportation / Data may differ from DPD reporting based on time and location<br>
Comparison of the 4 years and 6 months prior to deactivation to the 4 years and 6 months following Data provided by DBI from the CRIS database maintained by the Texas Department of Transportation / Data may differ from DPD reporting based on time and location<br>
19
Vision Zero – Moving Forward 19 Data Behavior Locations Actions Coordination Forward<br>
20
Crash Data - Locations 20 High Injury Network (HIN)
Streets where a disproportionate number of severe crashes have occurred.
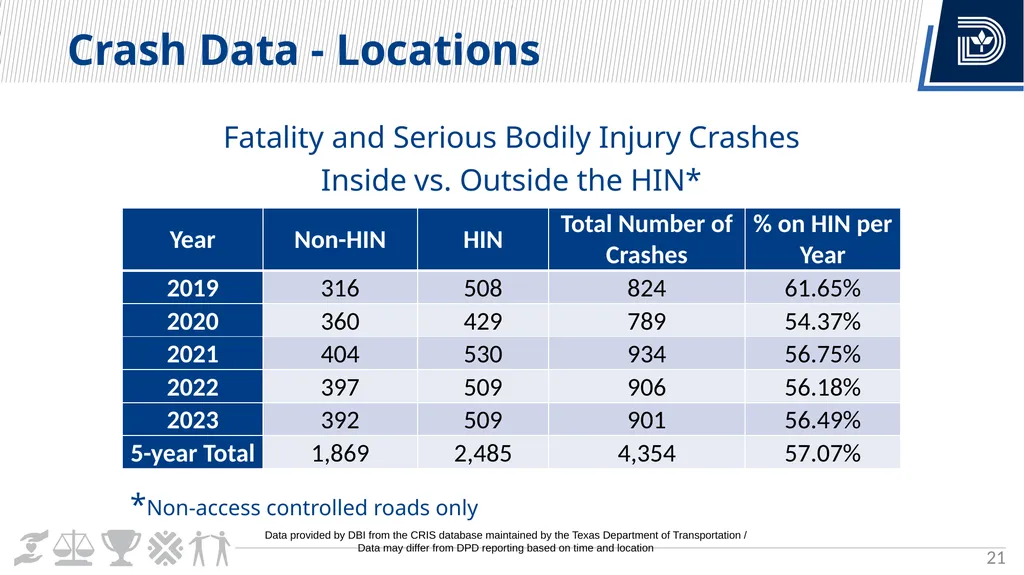
7% of streets accounting for 57% of severe crashes
A High Injury Network can help identify:
Areas where further engineering analysis is needed.
Where infrastructure improvements can be targeted.
Areas where safety education is needed.
Potential police enforcement areas.
Does not prevent improvements to other areas of concern.<br>
Streets where a disproportionate number of severe crashes have occurred.
7% of streets accounting for 57% of severe crashes
A High Injury Network can help identify:
Areas where further engineering analysis is needed.
Where infrastructure improvements can be targeted.
Areas where safety education is needed.
Potential police enforcement areas.
Does not prevent improvements to other areas of concern.<br>
21
Crash Data - Locations 21 Fatality and Serious Bodily Injury Crashes
Inside vs. Outside the HIN* *Non-access controlled roads only Data provided by DBI from the CRIS database maintained by the Texas Department of Transportation / Data may differ from DPD reporting based on time and location<br>
Inside vs. Outside the HIN* *Non-access controlled roads only Data provided by DBI from the CRIS database maintained by the Texas Department of Transportation / Data may differ from DPD reporting based on time and location<br>
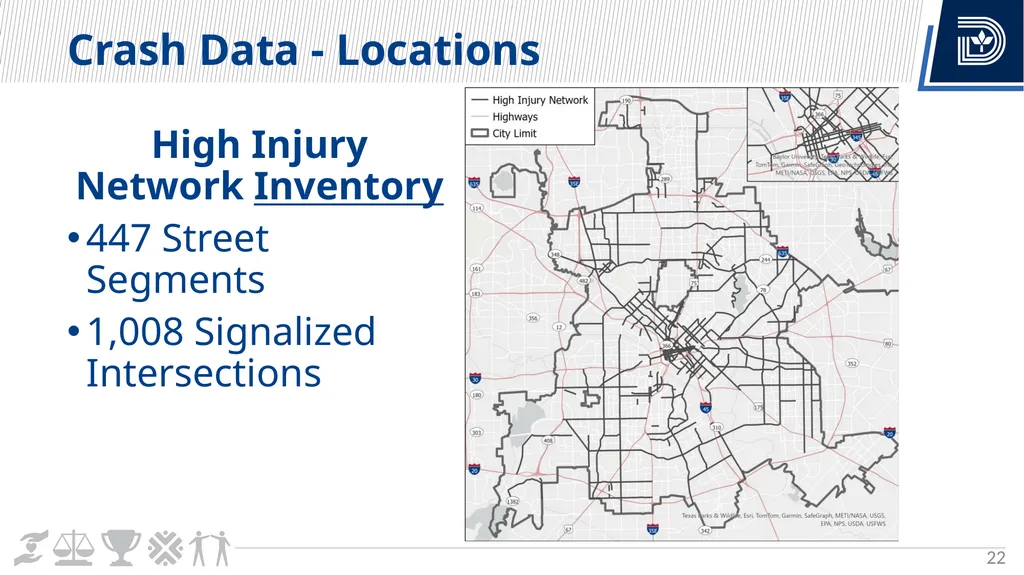
22
Crash Data - Locations 22 High Injury Network Inventory
447 Street Segments
1,008 Signalized Intersections<br>
447 Street Segments
1,008 Signalized Intersections<br>
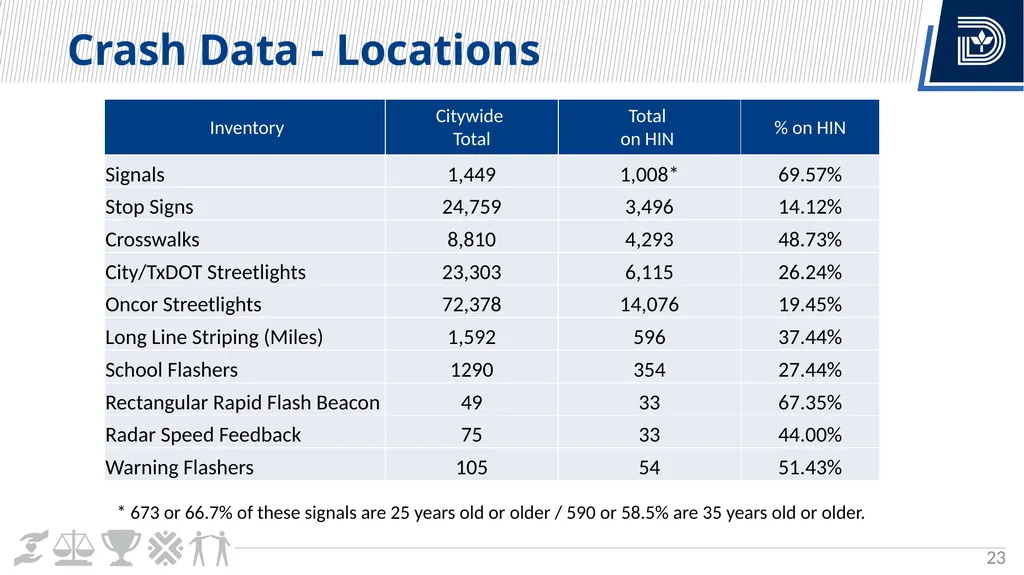
23
Crash Data - Locations 23 * 673 or 66.7% of these signals are 25 years old or older / 590 or 58.5% are 35 years old or older.<br>
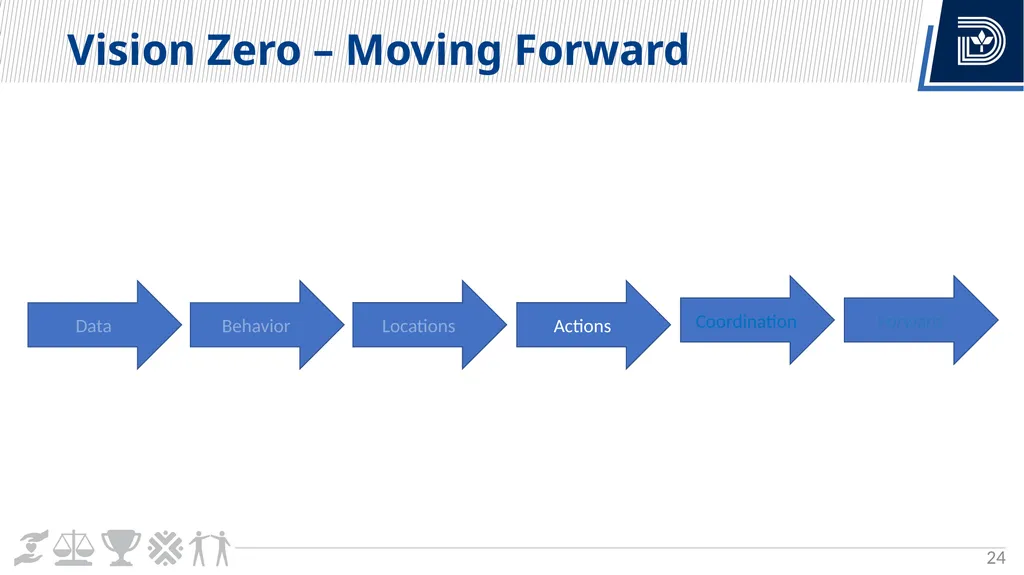
24
Vision Zero – Moving Forward 24 Data Behavior Locations Actions Coordination Forward<br>
25
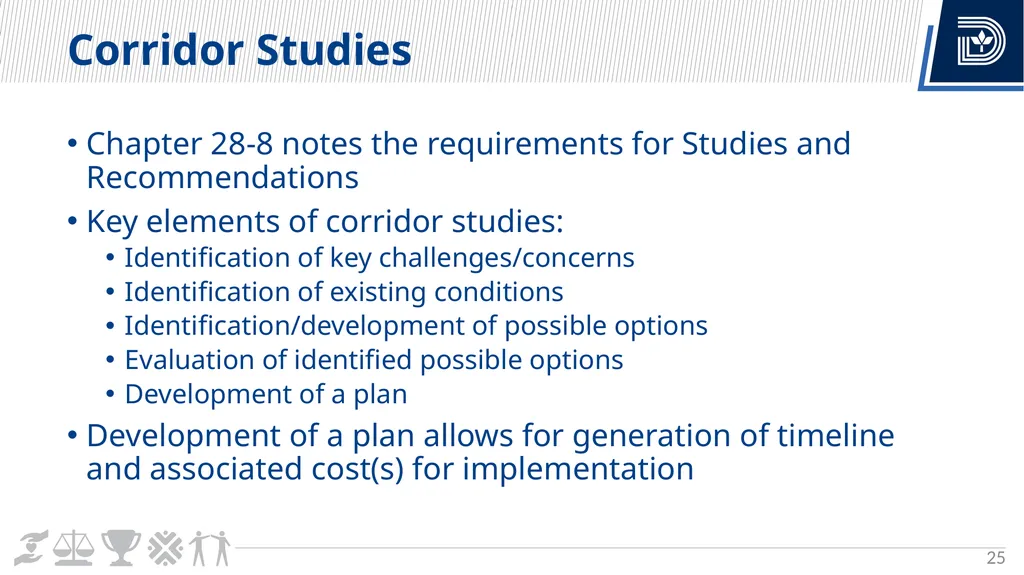
Corridor Studies 25 Chapter 28-8 notes the requirements for Studies and Recommendations
Key elements of corridor studies:
Identification of key challenges/concerns
Identification of existing conditions
Identification/development of possible options
Evaluation of identified possible options
Development of a plan
Development of a plan allows for generation of timeline and associated cost(s) for implementation<br>
Key elements of corridor studies:
Identification of key challenges/concerns
Identification of existing conditions
Identification/development of possible options
Evaluation of identified possible options
Development of a plan
Development of a plan allows for generation of timeline and associated cost(s) for implementation<br>
26
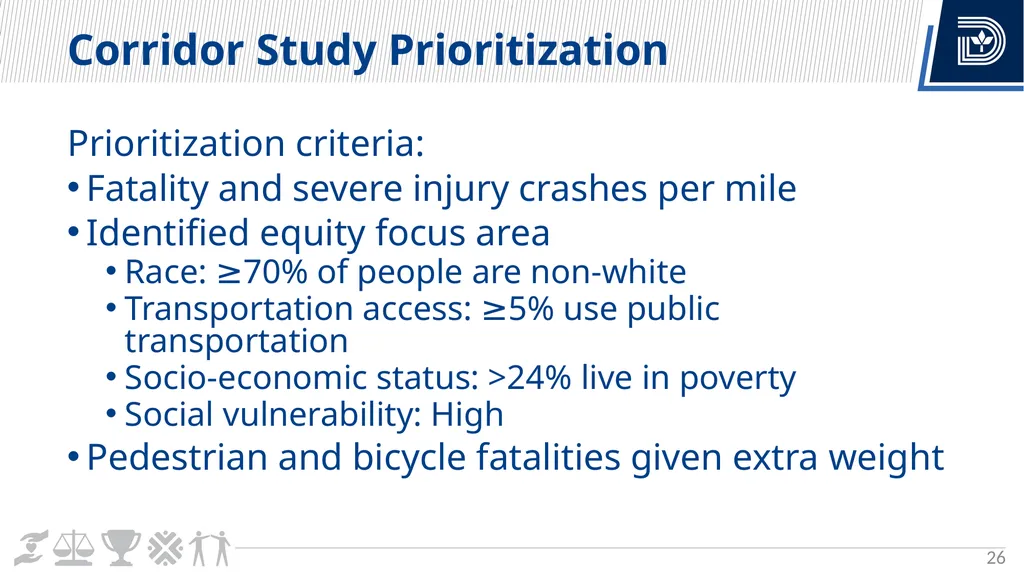
Corridor Study Prioritization 26 Prioritization criteria:
Fatality and severe injury crashes per mile
Identified equity focus area
Race: ≥70% of people are non-white
Transportation access: ≥5% use public transportation
Socio-economic status: >24% live in poverty
Social vulnerability: High
Pedestrian and bicycle fatalities given extra weight<br>
Fatality and severe injury crashes per mile
Identified equity focus area
Race: ≥70% of people are non-white
Transportation access: ≥5% use public transportation
Socio-economic status: >24% live in poverty
Social vulnerability: High
Pedestrian and bicycle fatalities given extra weight<br>
27
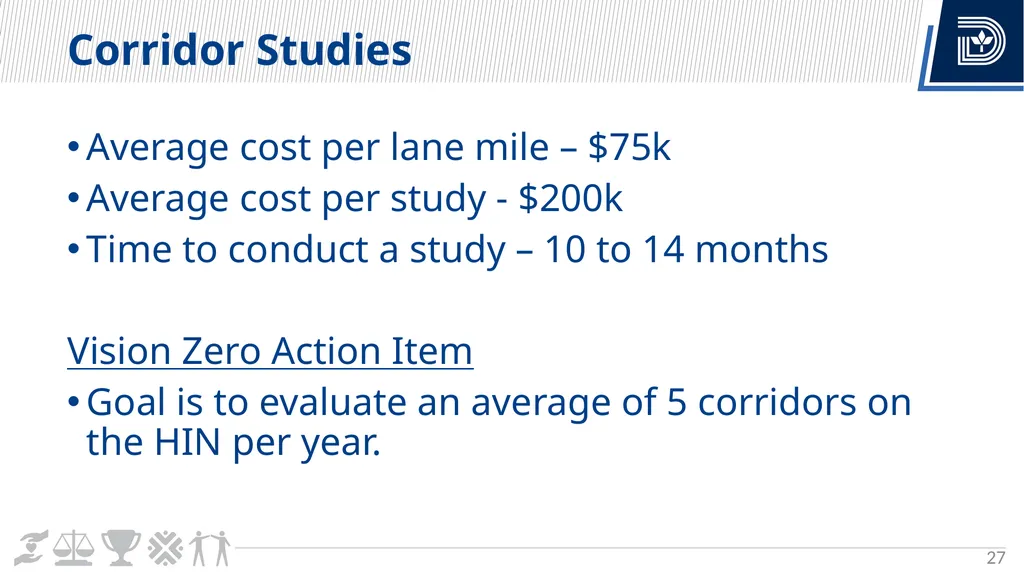
Corridor Studies 27 Average cost per lane mile – $75k
Average cost per study - $200k
Time to conduct a study – 10 to 14 months
Vision Zero Action Item
Goal is to evaluate an average of 5 corridors on the HIN per year.<br>
Average cost per study - $200k
Time to conduct a study – 10 to 14 months
Vision Zero Action Item
Goal is to evaluate an average of 5 corridors on the HIN per year.<br>
28
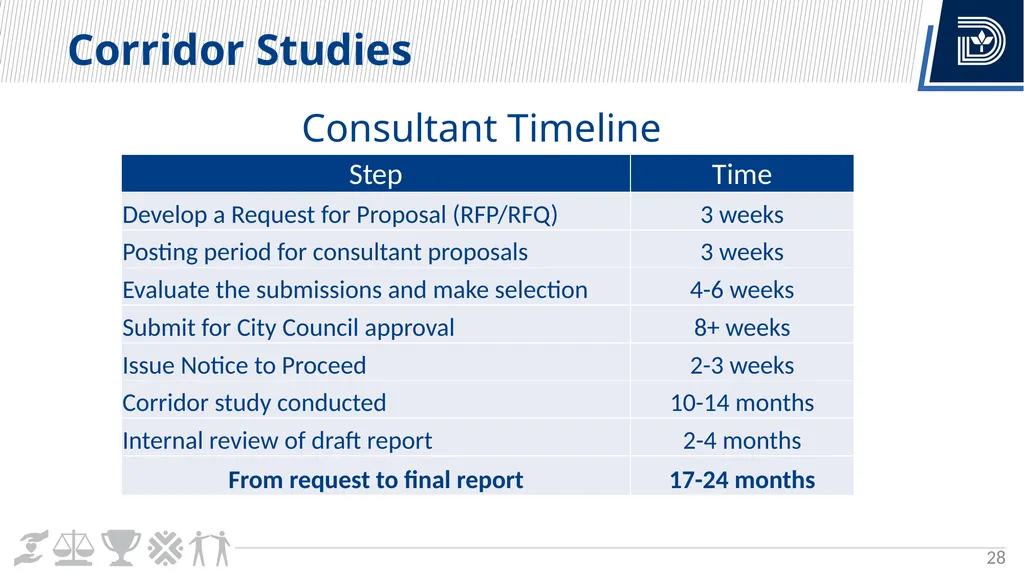
Corridor Studies 28 Consultant Timeline<br>
29
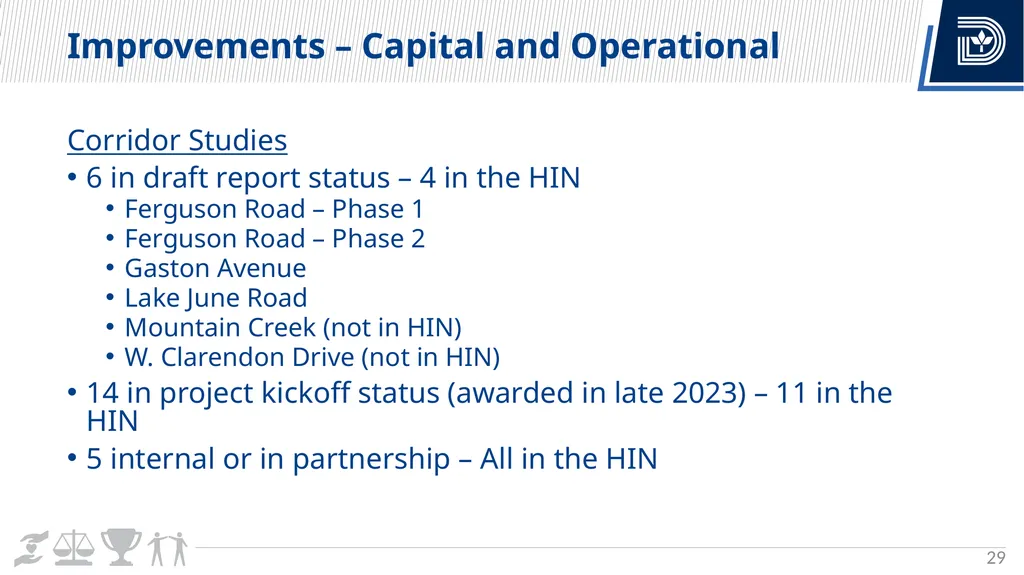
Improvements – Capital and Operational 29 Corridor Studies
6 in draft report status – 4 in the HIN
Ferguson Road – Phase 1
Ferguson Road – Phase 2
Gaston Avenue
Lake June Road
Mountain Creek (not in HIN)
W. Clarendon Drive (not in HIN)
14 in project kickoff status (awarded in late 2023) – 11 in the HIN
5 internal or in partnership – All in the HIN<br>
6 in draft report status – 4 in the HIN
Ferguson Road – Phase 1
Ferguson Road – Phase 2
Gaston Avenue
Lake June Road
Mountain Creek (not in HIN)
W. Clarendon Drive (not in HIN)
14 in project kickoff status (awarded in late 2023) – 11 in the HIN
5 internal or in partnership – All in the HIN<br>
30
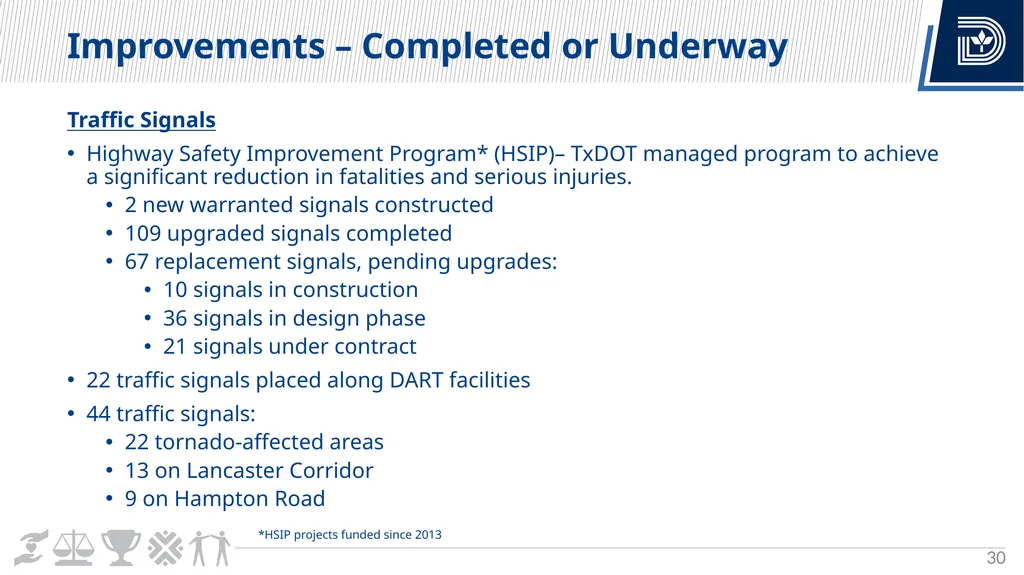
Improvements – Completed or Underway 30 Traffic Signals
Highway Safety Improvement Program* (HSIP)– TxDOT managed program to achieve a significant reduction in fatalities and serious injuries.
2 new warranted signals constructed
109 upgraded signals completed
67 replacement signals, pending upgrades:
10 signals in construction
36 signals in design phase
21 signals under contract
22 traffic signals placed along DART facilities
44 traffic signals:
22 tornado-affected areas
13 on Lancaster Corridor
9 on Hampton Road *HSIP projects funded since 2013<br>
Highway Safety Improvement Program* (HSIP)– TxDOT managed program to achieve a significant reduction in fatalities and serious injuries.
2 new warranted signals constructed
109 upgraded signals completed
67 replacement signals, pending upgrades:
10 signals in construction
36 signals in design phase
21 signals under contract
22 traffic signals placed along DART facilities
44 traffic signals:
22 tornado-affected areas
13 on Lancaster Corridor
9 on Hampton Road *HSIP projects funded since 2013<br>
31
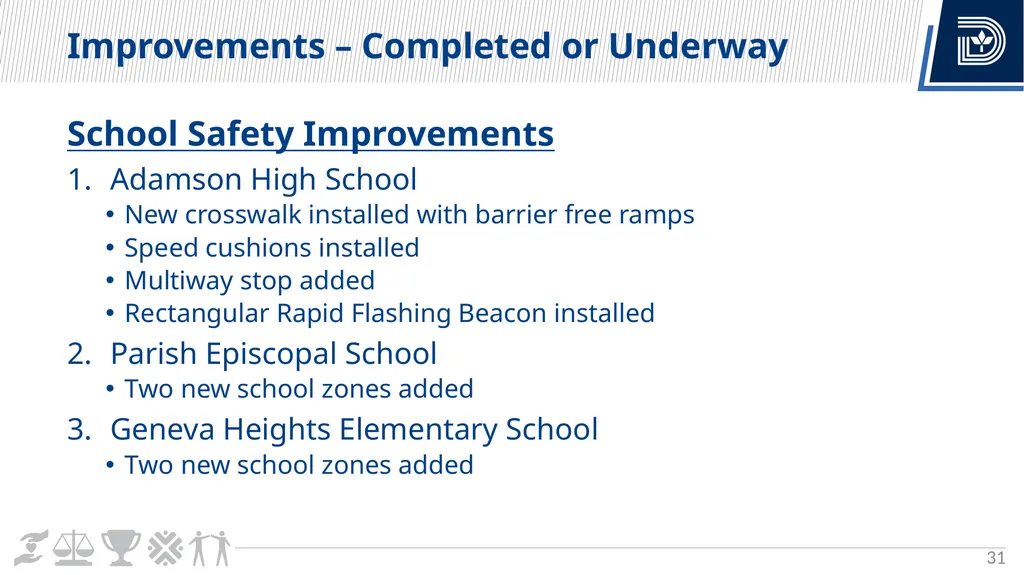
Improvements – Completed or Underway 31 School Safety Improvements
Adamson High School
New crosswalk installed with barrier free ramps
Speed cushions installed
Multiway stop added
Rectangular Rapid Flashing Beacon installed
Parish Episcopal School
Two new school zones added
Geneva Heights Elementary School
Two new school zones added<br>
Adamson High School
New crosswalk installed with barrier free ramps
Speed cushions installed
Multiway stop added
Rectangular Rapid Flashing Beacon installed
Parish Episcopal School
Two new school zones added
Geneva Heights Elementary School
Two new school zones added<br>
32
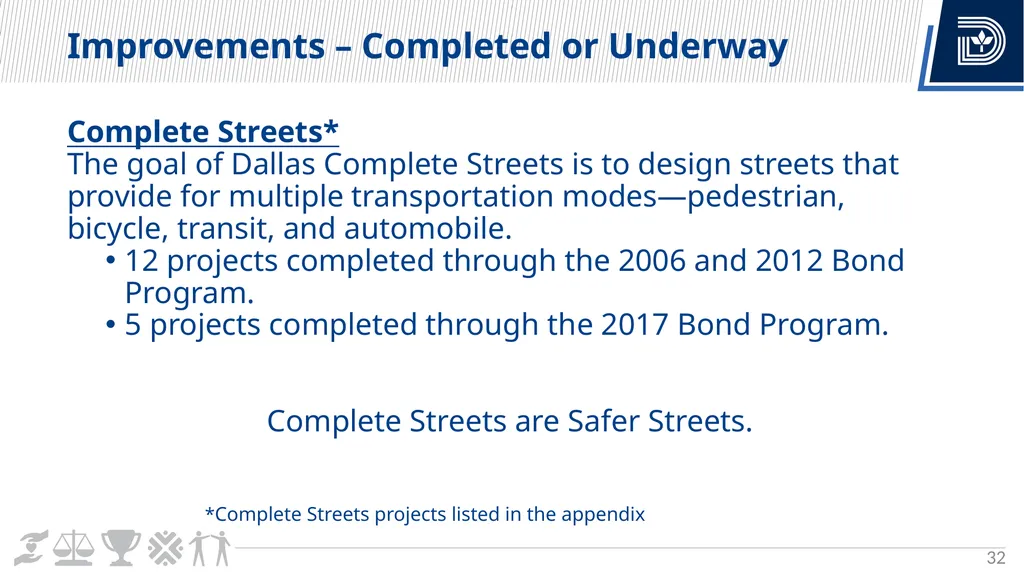
Improvements – Completed or Underway 32 Complete Streets*
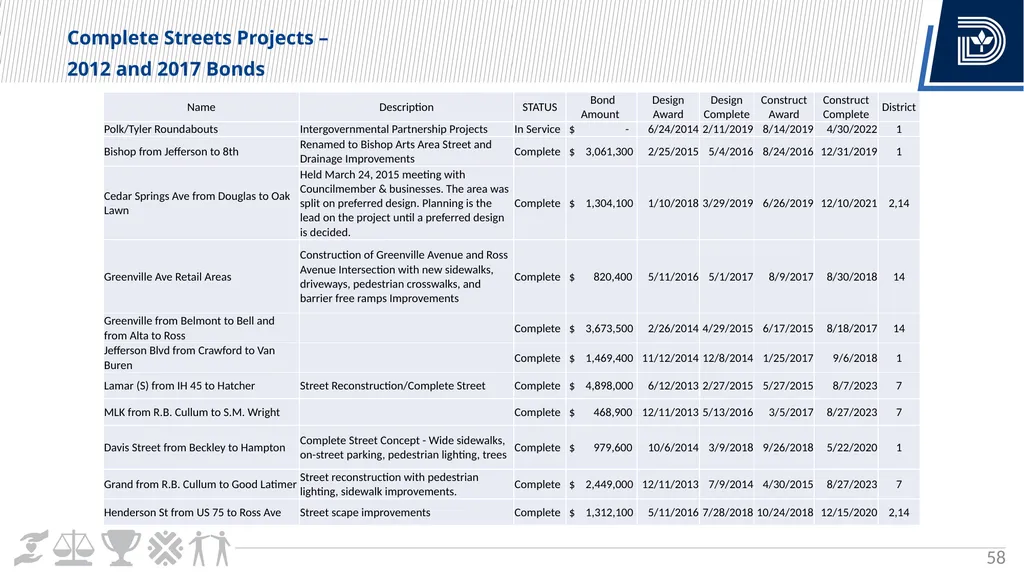
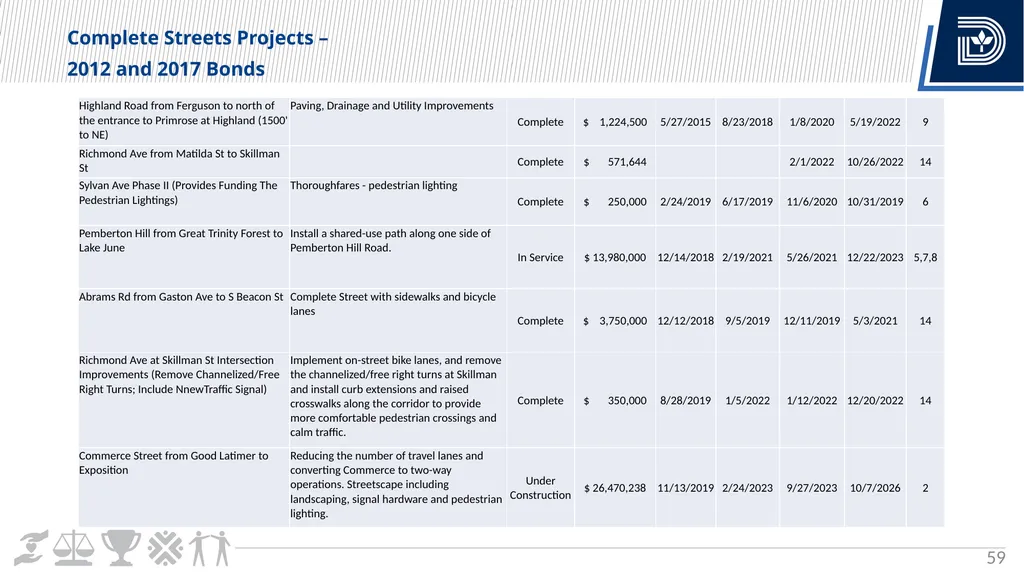
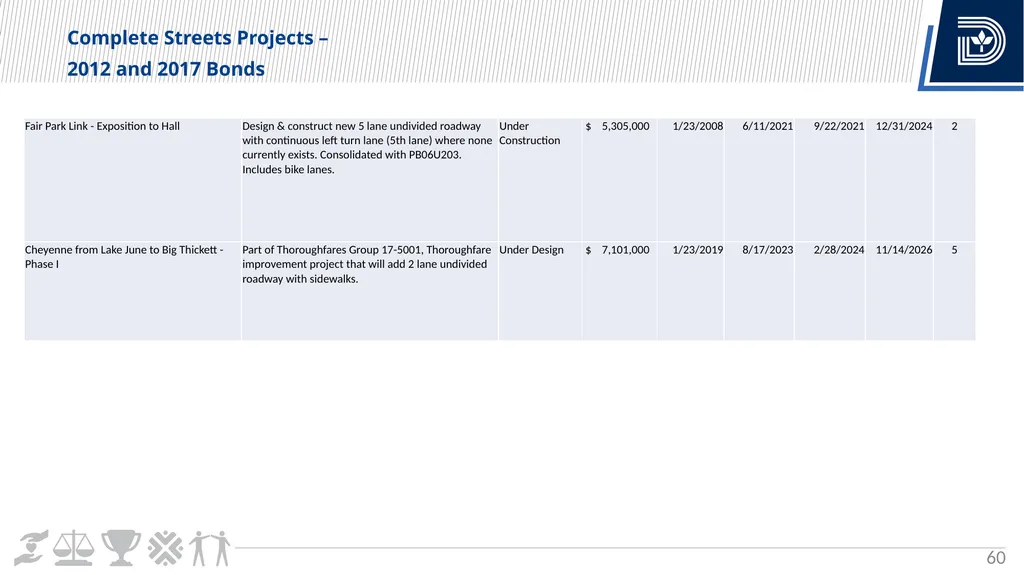
The goal of Dallas Complete Streets is to design streets that provide for multiple transportation modes—pedestrian, bicycle, transit, and automobile.
12 projects completed through the 2006 and 2012 Bond Program.
5 projects completed through the 2017 Bond Program.
Complete Streets are Safer Streets. *Complete Streets projects listed in the appendix<br>
The goal of Dallas Complete Streets is to design streets that provide for multiple transportation modes—pedestrian, bicycle, transit, and automobile.
12 projects completed through the 2006 and 2012 Bond Program.
5 projects completed through the 2017 Bond Program.
Complete Streets are Safer Streets. *Complete Streets projects listed in the appendix<br>
33
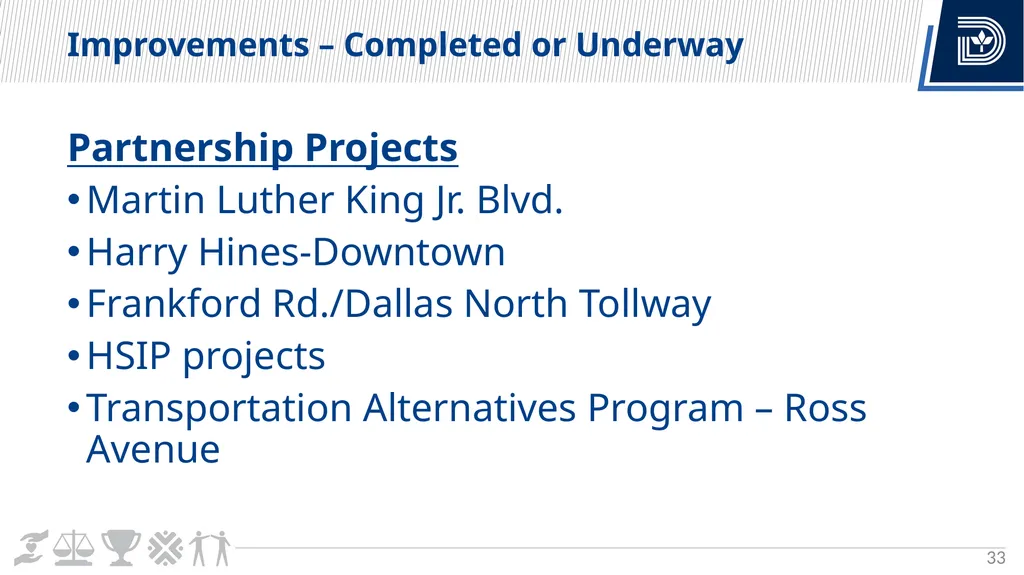
Improvements – Completed or Underway 33 Partnership Projects
Martin Luther King Jr. Blvd.
Harry Hines-Downtown
Frankford Rd./Dallas North Tollway
HSIP projects
Transportation Alternatives Program – Ross Avenue<br>
Martin Luther King Jr. Blvd.
Harry Hines-Downtown
Frankford Rd./Dallas North Tollway
HSIP projects
Transportation Alternatives Program – Ross Avenue<br>
34
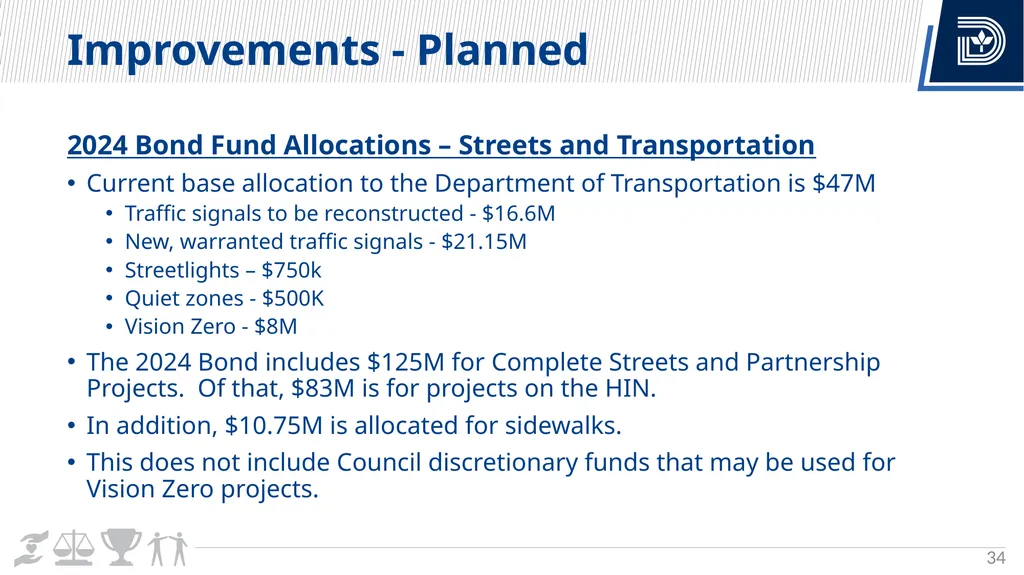
Improvements - Planned 34 2024 Bond Fund Allocations – Streets and Transportation
Current base allocation to the Department of Transportation is $47M
Traffic signals to be reconstructed - $16.6M
New, warranted traffic signals - $21.15M
Streetlights – $750k
Quiet zones - $500K
Vision Zero - $8M
The 2024 Bond includes $125M for Complete Streets and Partnership Projects. Of that, $83M is for projects on the HIN.
In addition, $10.75M is allocated for sidewalks.
This does not include Council discretionary funds that may be used for Vision Zero projects.<br>
Current base allocation to the Department of Transportation is $47M
Traffic signals to be reconstructed - $16.6M
New, warranted traffic signals - $21.15M
Streetlights – $750k
Quiet zones - $500K
Vision Zero - $8M
The 2024 Bond includes $125M for Complete Streets and Partnership Projects. Of that, $83M is for projects on the HIN.
In addition, $10.75M is allocated for sidewalks.
This does not include Council discretionary funds that may be used for Vision Zero projects.<br>
35
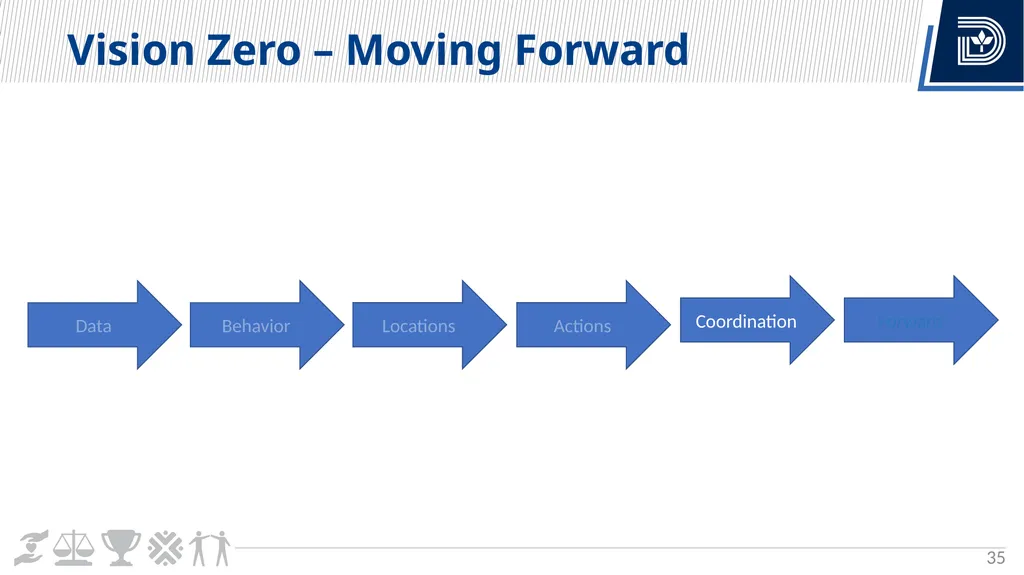
Vision Zero – Moving Forward 35 Data Behavior Locations Actions Coordination Forward<br>
36
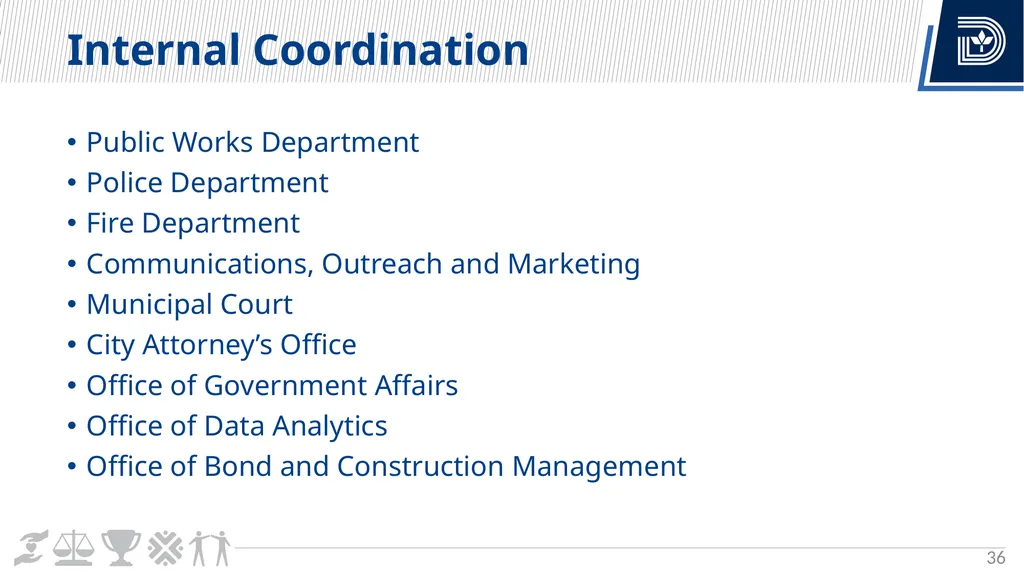
Internal Coordination 36 Public Works Department
Police Department
Fire Department
Communications, Outreach and Marketing
Municipal Court
City Attorney’s Office
Office of Government Affairs
Office of Data Analytics
Office of Bond and Construction Management<br>
Police Department
Fire Department
Communications, Outreach and Marketing
Municipal Court
City Attorney’s Office
Office of Government Affairs
Office of Data Analytics
Office of Bond and Construction Management<br>
37
Enforcement Action Items 37 Dallas Police Department (DPD) has started or completed 10 of 12 Vision Zero Action items.
Over 1,800 citations have been issued in High Injury Network (HIN) locations since November 2022.
DPD utilizes the STEP Grant to provide additional enforcement in HIN locations.
DPD conducts education through social media, variable message signs and speed feedback trailers .
Police recruits now receive a block of instruction on the overview of Vision Zero.
Collaboration continues with DDOT on recommendations for road engineering at HIN locations.<br>
Over 1,800 citations have been issued in High Injury Network (HIN) locations since November 2022.
DPD utilizes the STEP Grant to provide additional enforcement in HIN locations.
DPD conducts education through social media, variable message signs and speed feedback trailers .
Police recruits now receive a block of instruction on the overview of Vision Zero.
Collaboration continues with DDOT on recommendations for road engineering at HIN locations.<br>
38
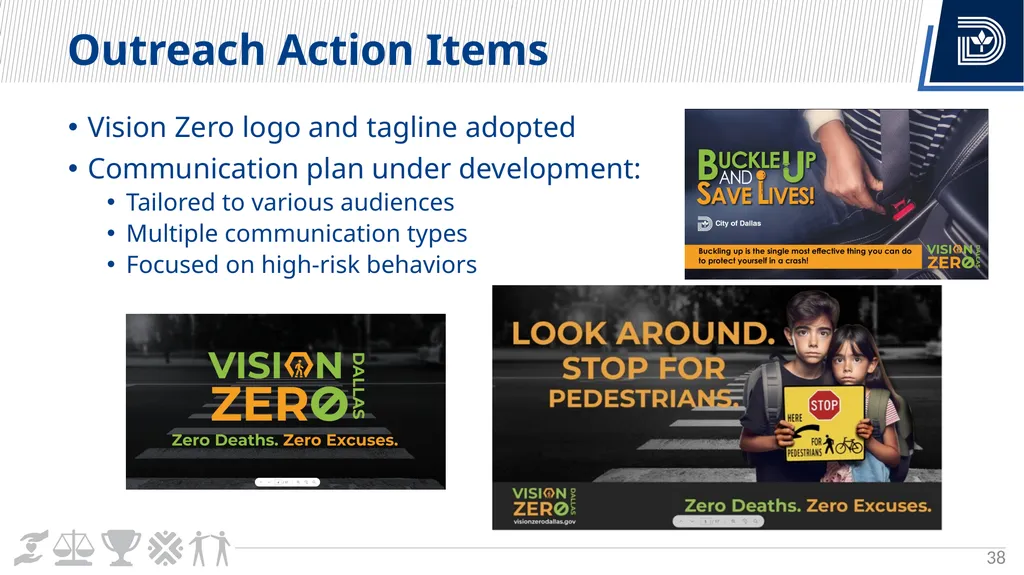
Outreach Action Items 38 Vision Zero logo and tagline adopted
Communication plan under development:
Tailored to various audiences
Multiple communication types
Focused on high-risk behaviors<br>
Communication plan under development:
Tailored to various audiences
Multiple communication types
Focused on high-risk behaviors<br>
39
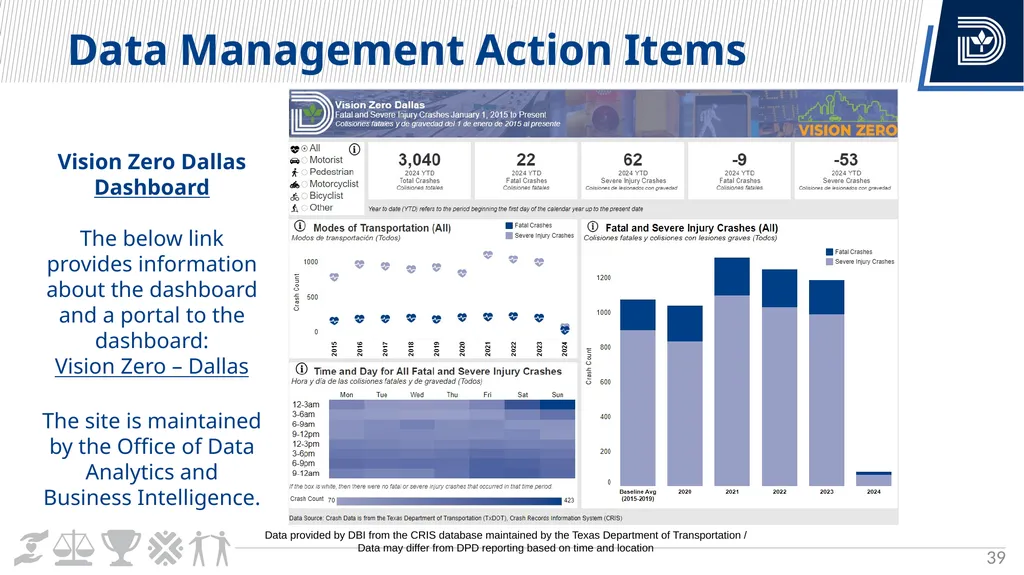
Data Management Action Items 39 Vision Zero Dallas
Dashboard
The below link provides information about the dashboard and a portal to the dashboard:
Vision Zero – Dallas
The site is maintained by the Office of Data Analytics and Business Intelligence. Data provided by DBI from the CRIS database maintained by the Texas Department of Transportation / Data may differ from DPD reporting based on time and location<br>
Dashboard
The below link provides information about the dashboard and a portal to the dashboard:
Vision Zero – Dallas
The site is maintained by the Office of Data Analytics and Business Intelligence. Data provided by DBI from the CRIS database maintained by the Texas Department of Transportation / Data may differ from DPD reporting based on time and location<br>
40
State Legislative Action Items 40 88th Session Legislative Priorities (2023)
Allow municipalities to lower the prima facie speed limit in residential areas from 30 to 25 miles per hour.
Enhance and fund mobility infrastructure, including but not limited to bike and pedestrian improvements.
89th Legislative Priorities (2025)
Allow municipalities to lower the prima facie speed limit in residential areas from 30 to 25 miles per hour.
Authorize additional options on recognized hazardous roadways.<br>
Allow municipalities to lower the prima facie speed limit in residential areas from 30 to 25 miles per hour.
Enhance and fund mobility infrastructure, including but not limited to bike and pedestrian improvements.
89th Legislative Priorities (2025)
Allow municipalities to lower the prima facie speed limit in residential areas from 30 to 25 miles per hour.
Authorize additional options on recognized hazardous roadways.<br>
41
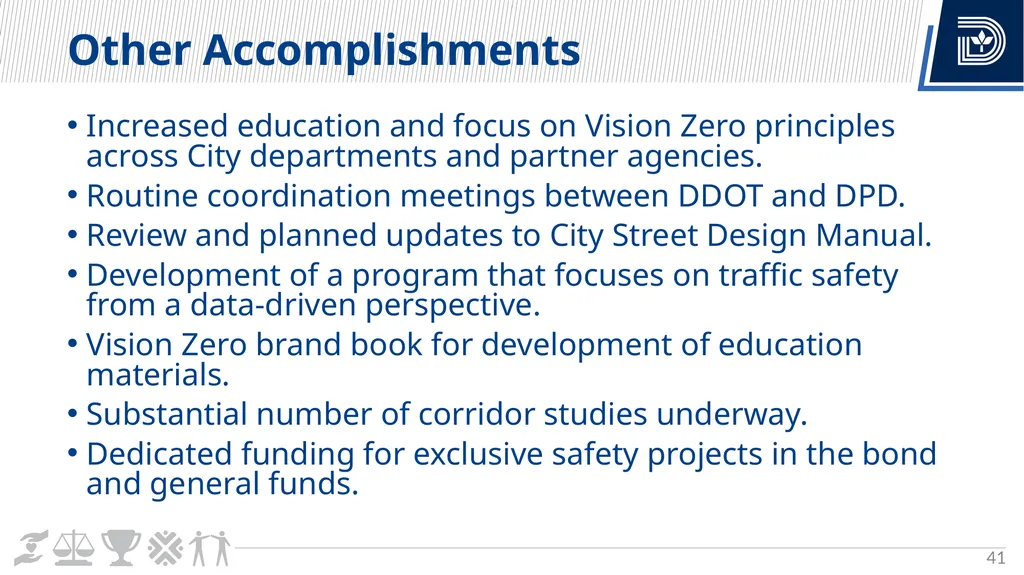
Other Accomplishments 41 Increased education and focus on Vision Zero principles across City departments and partner agencies.
Routine coordination meetings between DDOT and DPD.
Review and planned updates to City Street Design Manual.
Development of a program that focuses on traffic safety from a data-driven perspective.
Vision Zero brand book for development of education materials.
Substantial number of corridor studies underway.
Dedicated funding for exclusive safety projects in the bond and general funds.<br>
Routine coordination meetings between DDOT and DPD.
Review and planned updates to City Street Design Manual.
Development of a program that focuses on traffic safety from a data-driven perspective.
Vision Zero brand book for development of education materials.
Substantial number of corridor studies underway.
Dedicated funding for exclusive safety projects in the bond and general funds.<br>
42
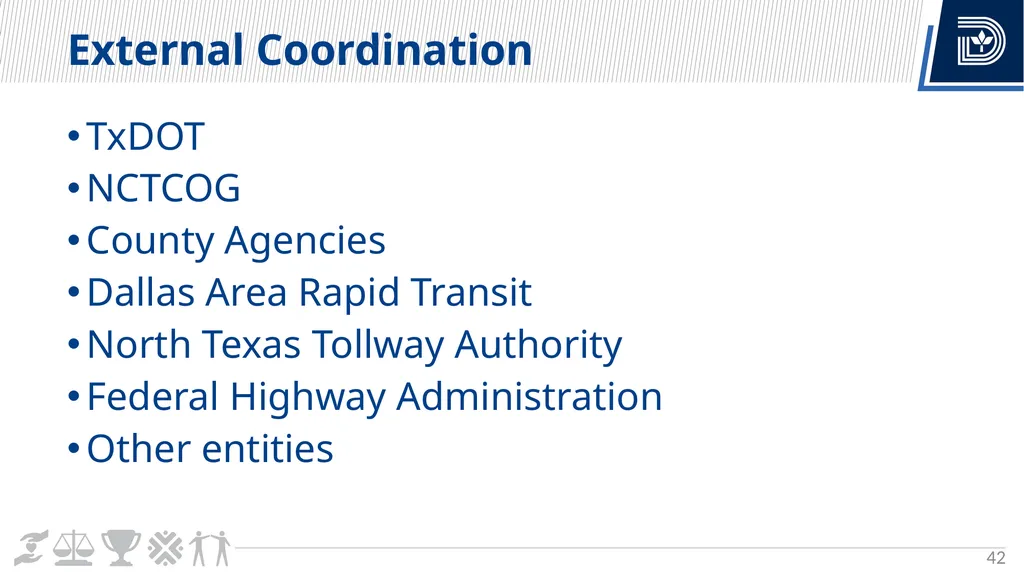
External Coordination 42 TxDOT
NCTCOG
County Agencies
Dallas Area Rapid Transit
North Texas Tollway Authority
Federal Highway Administration
Other entities<br>
NCTCOG
County Agencies
Dallas Area Rapid Transit
North Texas Tollway Authority
Federal Highway Administration
Other entities<br>
43
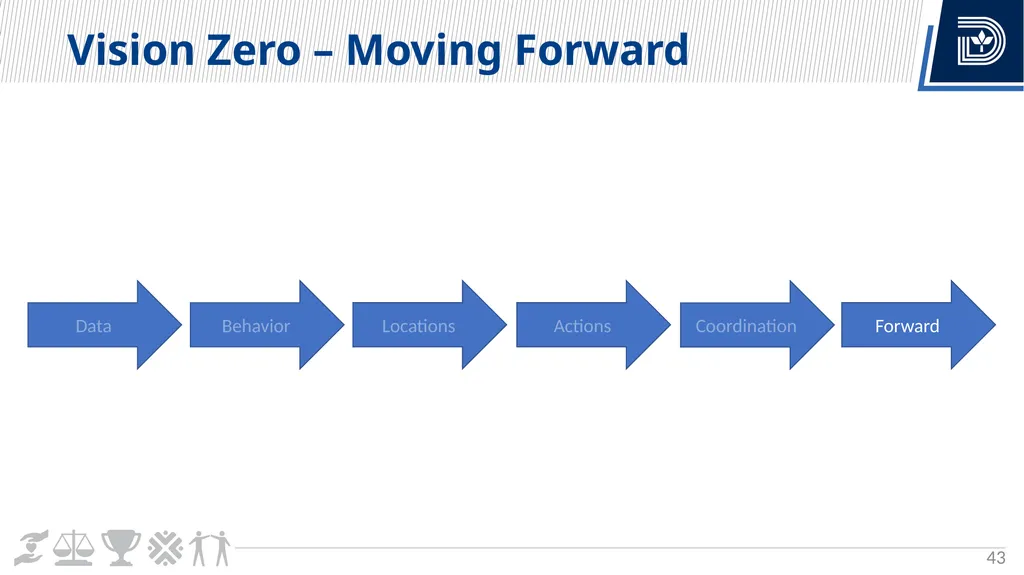
Vision Zero – Moving Forward 43 Data Behavior Locations Actions Coordination Forward<br>
44
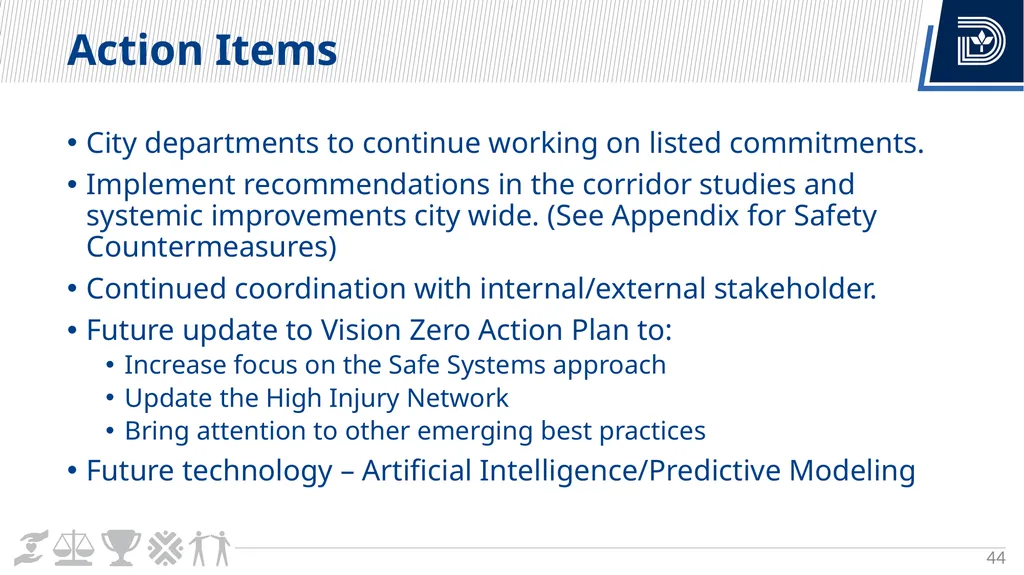
Action Items 44 City departments to continue working on listed commitments.
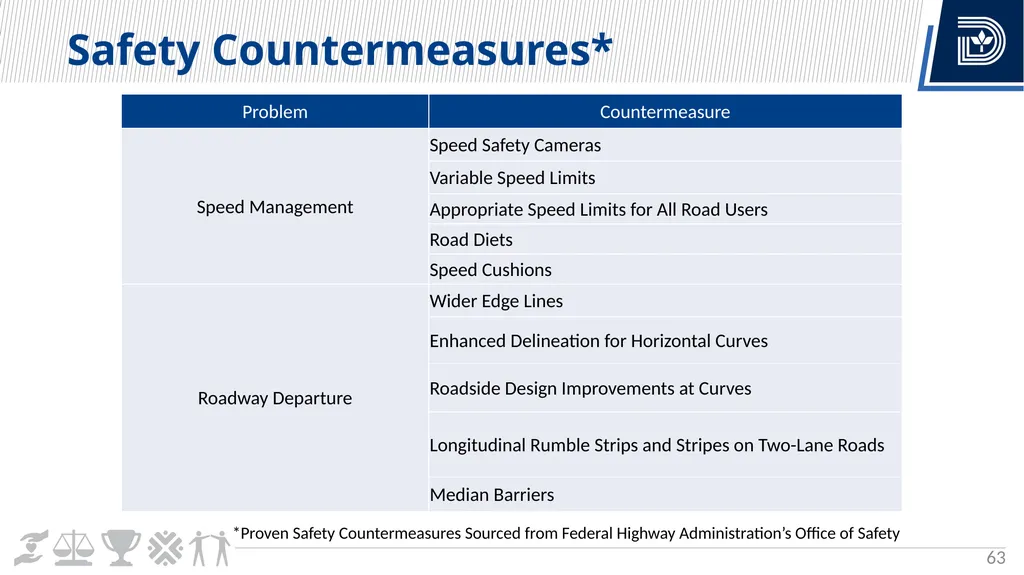
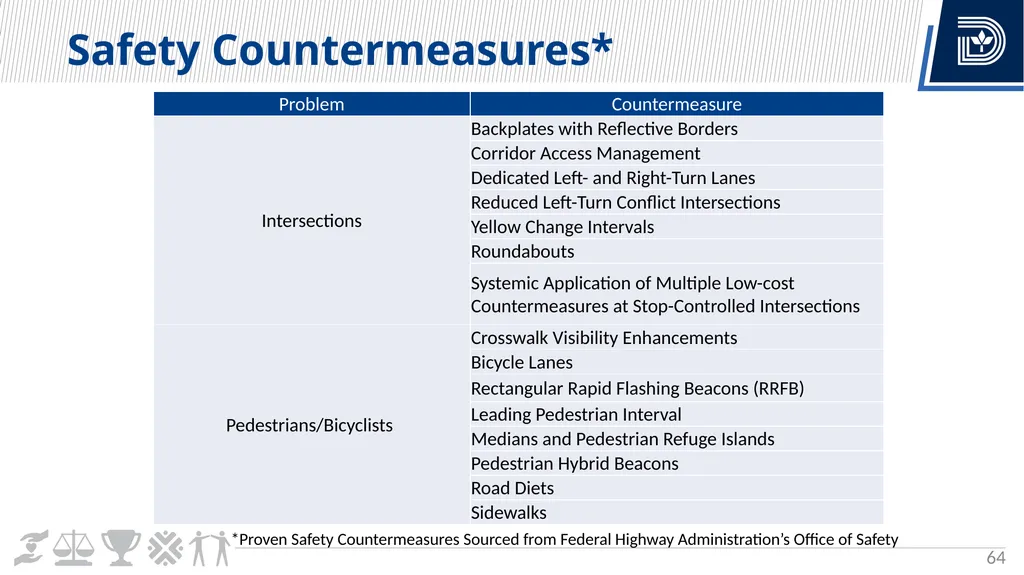
Implement recommendations in the corridor studies and systemic improvements city wide. (See Appendix for Safety Countermeasures)
Continued coordination with internal/external stakeholder.
Future update to Vision Zero Action Plan to:
Increase focus on the Safe Systems approach
Update the High Injury Network
Bring attention to other emerging best practices
Future technology – Artificial Intelligence/Predictive Modeling<br>
Implement recommendations in the corridor studies and systemic improvements city wide. (See Appendix for Safety Countermeasures)
Continued coordination with internal/external stakeholder.
Future update to Vision Zero Action Plan to:
Increase focus on the Safe Systems approach
Update the High Injury Network
Bring attention to other emerging best practices
Future technology – Artificial Intelligence/Predictive Modeling<br>
45
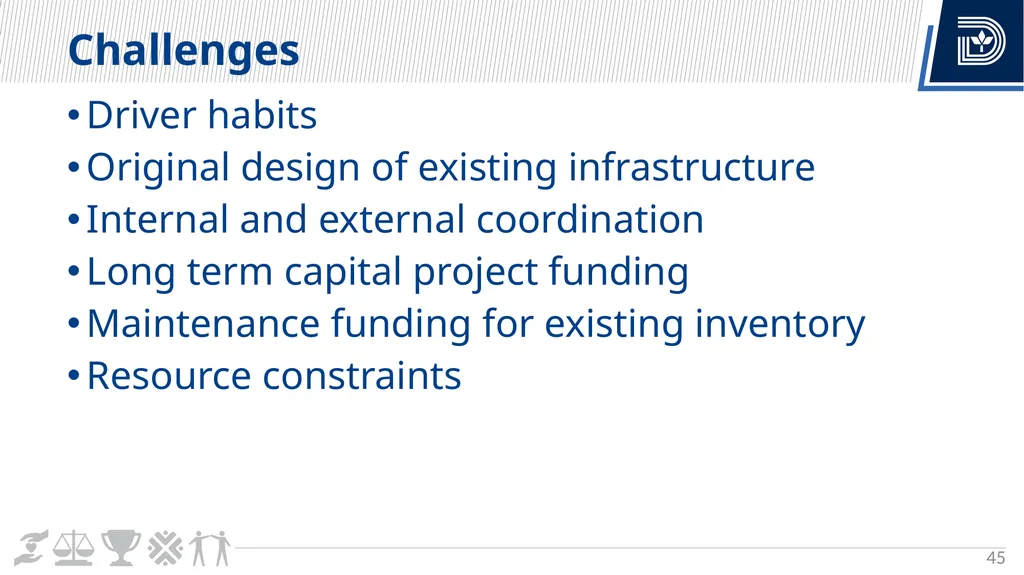
Challenges 45 Driver habits
Original design of existing infrastructure
Internal and external coordination
Long term capital project funding
Maintenance funding for existing inventory
Resource constraints<br>
Original design of existing infrastructure
Internal and external coordination
Long term capital project funding
Maintenance funding for existing inventory
Resource constraints<br>
46
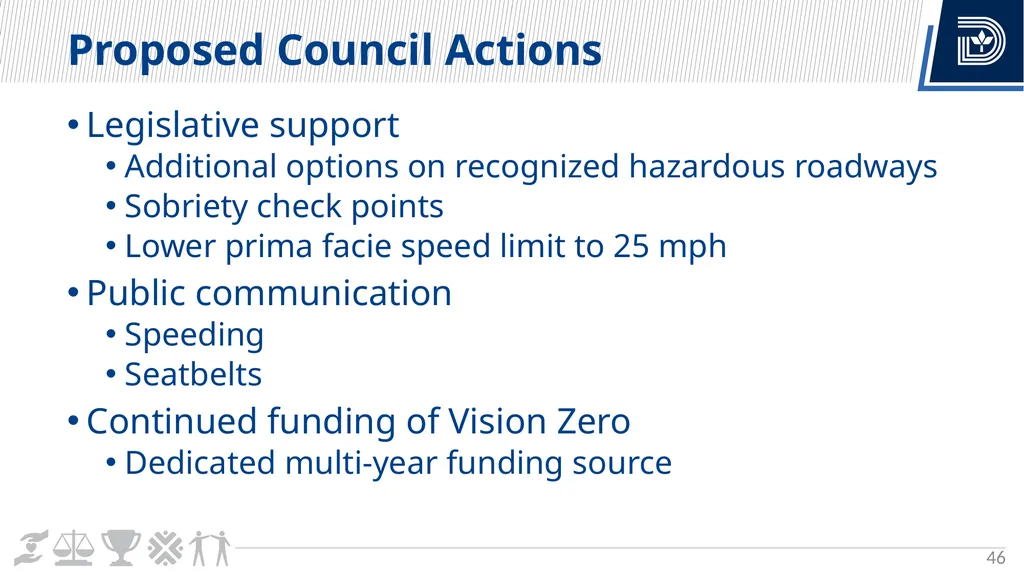
Proposed Council Actions 46 Legislative support
Additional options on recognized hazardous roadways
Sobriety check points
Lower prima facie speed limit to 25 mph
Public communication
Speeding
Seatbelts
Continued funding of Vision Zero
Dedicated multi-year funding source<br>
Additional options on recognized hazardous roadways
Sobriety check points
Lower prima facie speed limit to 25 mph
Public communication
Speeding
Seatbelts
Continued funding of Vision Zero
Dedicated multi-year funding source<br>
47
47 Closing comments
Questions?<br>
Questions?<br>
48
Vision Zero Update City Council Briefing
March 6, 2024 Ghassan “Gus” Khankarli, Ph.D. P.E., Director
Department of Transportation
and
Other Department Representatives<br>
March 6, 2024 Ghassan “Gus” Khankarli, Ph.D. P.E., Director
Department of Transportation
and
Other Department Representatives<br>
49
49 Appendix<br>
50
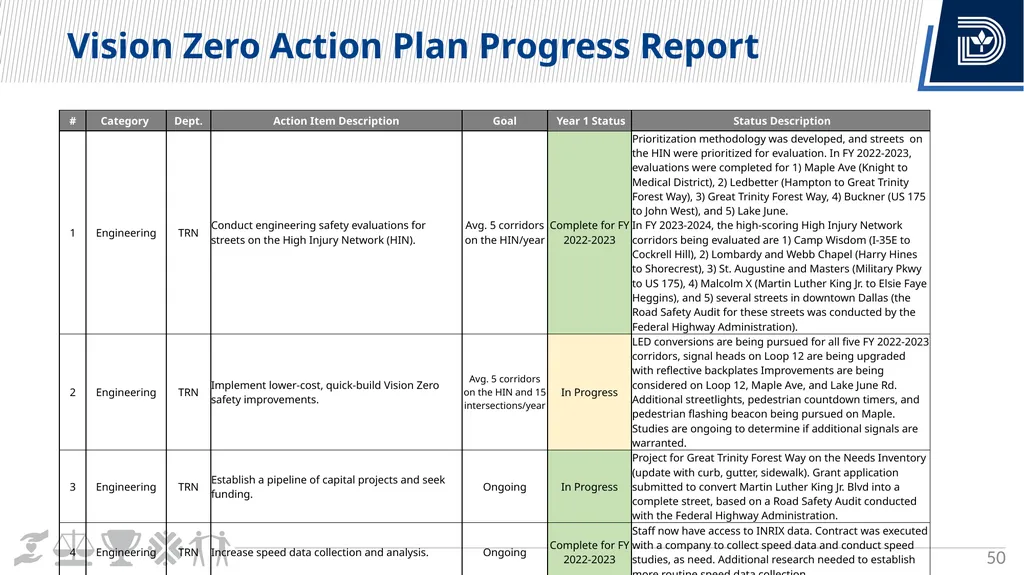
Vision Zero Action Plan Progress Report 50<br>
51
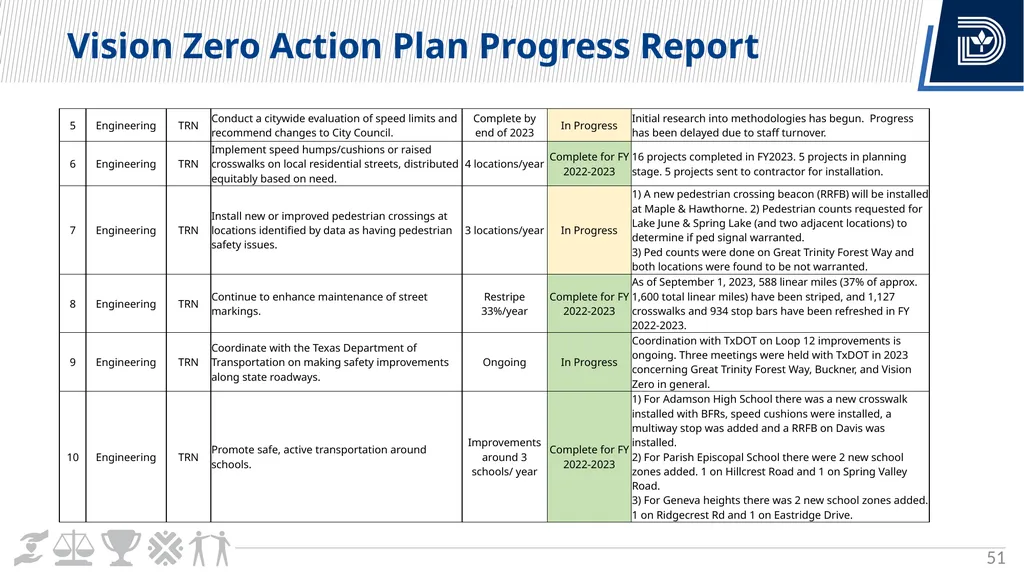
Vision Zero Action Plan Progress Report 51<br>
52
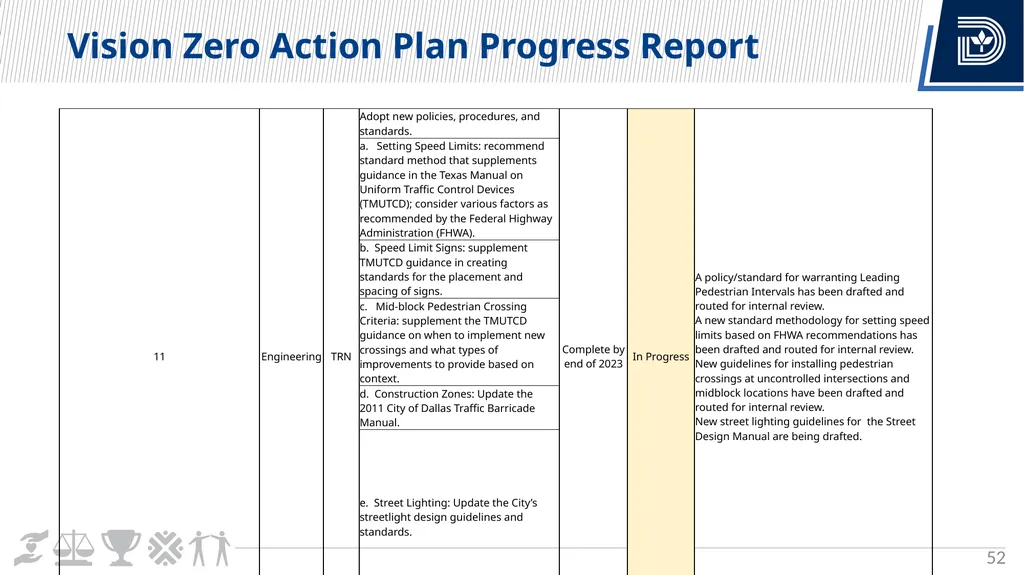
Vision Zero Action Plan Progress Report 52<br>
53
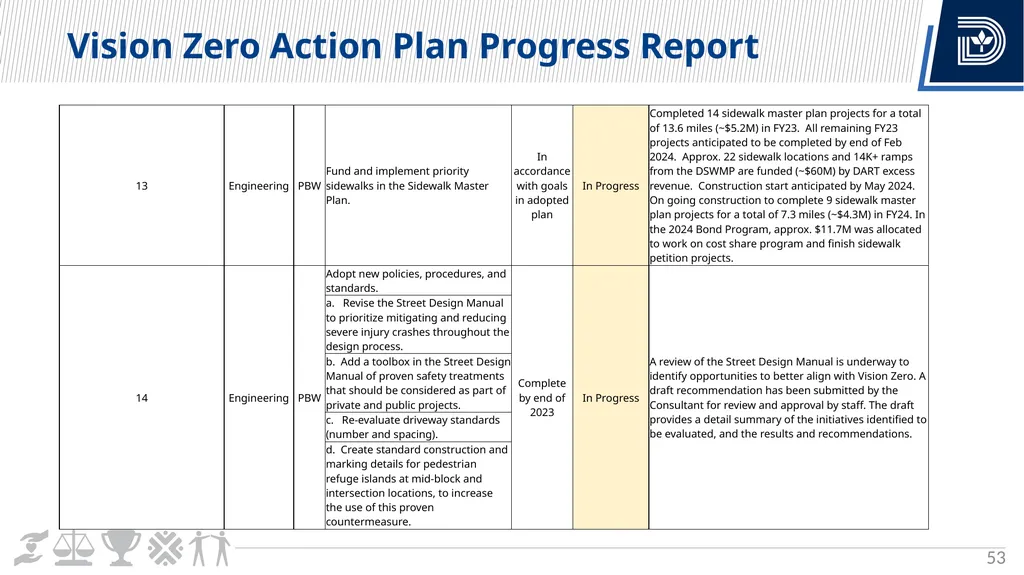
Vision Zero Action Plan Progress Report 53<br>
54
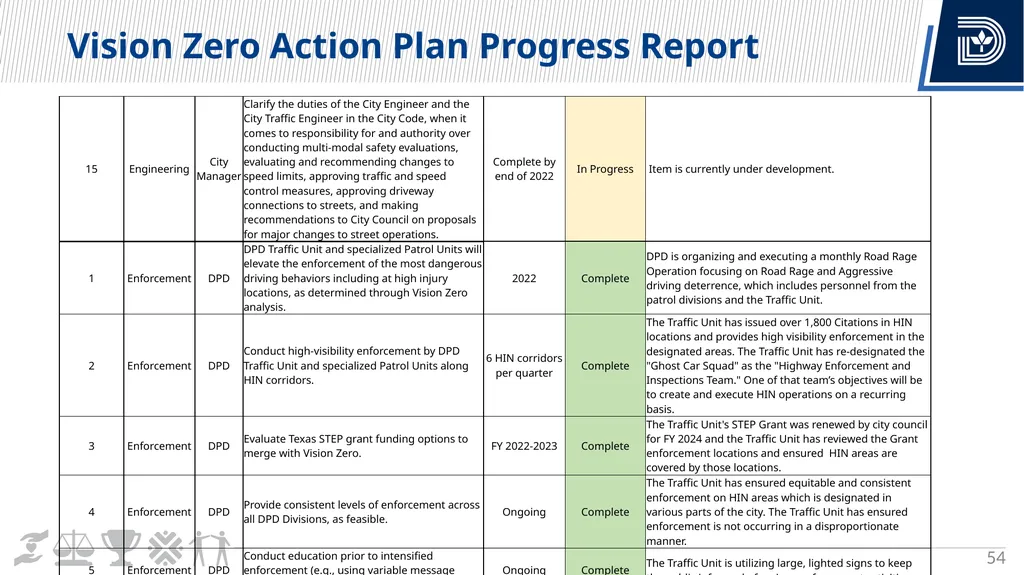
Vision Zero Action Plan Progress Report 54<br>
55
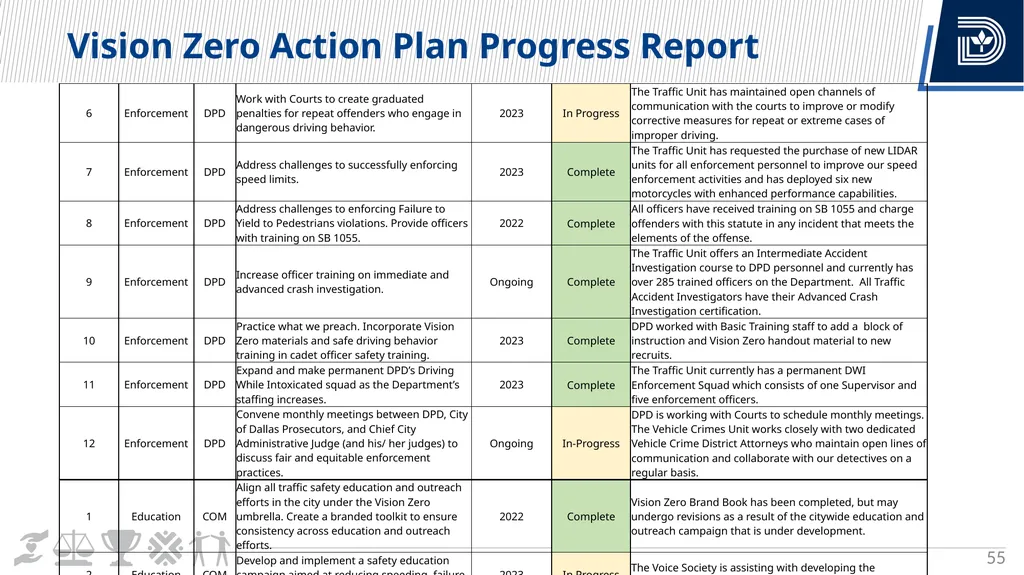
Vision Zero Action Plan Progress Report 55<br>
56
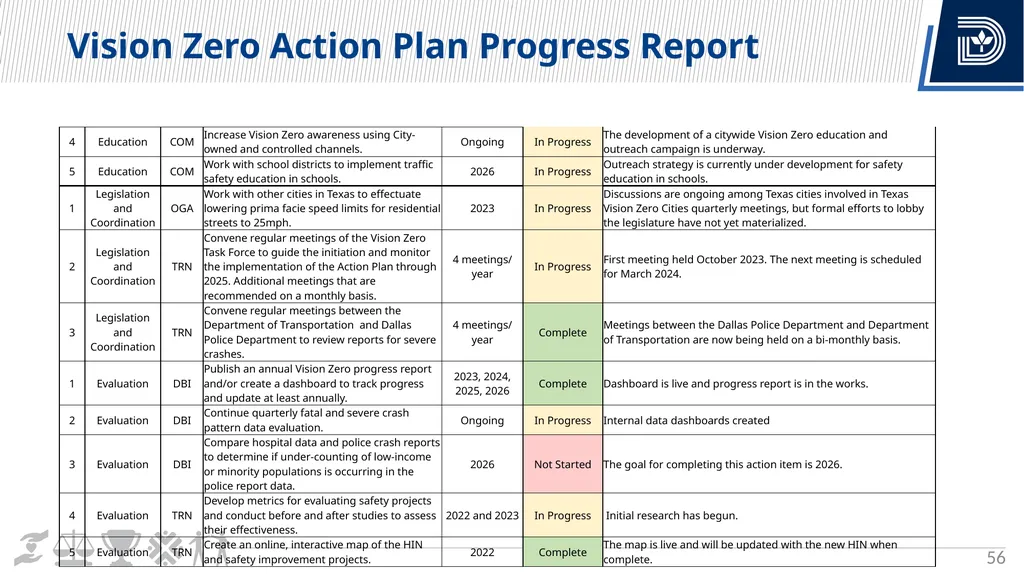
Vision Zero Action Plan Progress Report 56<br>
57
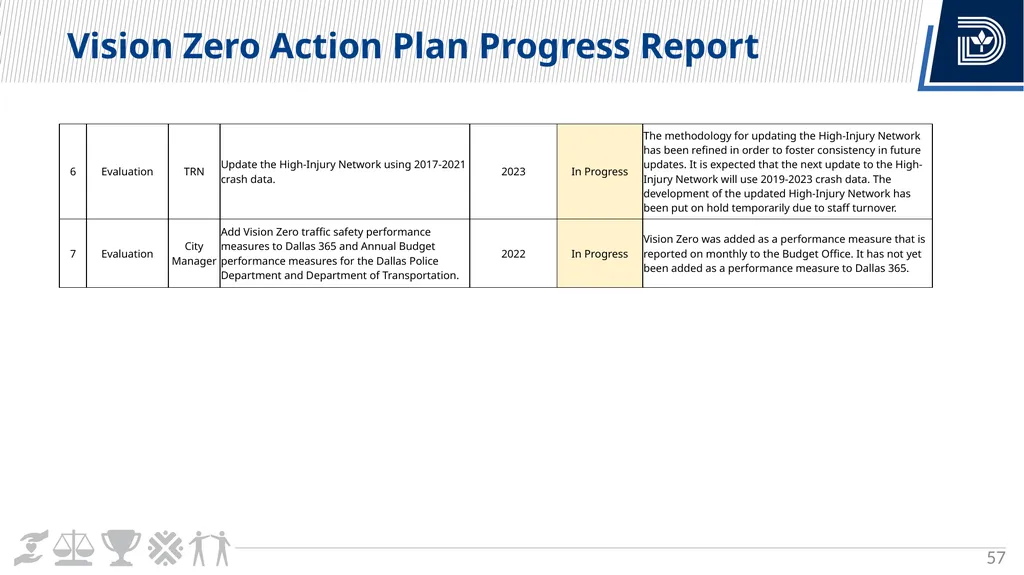
Vision Zero Action Plan Progress Report 57<br>
58
Complete Streets Projects –
2012 and 2017 Bonds 58<br>
2012 and 2017 Bonds 58<br>
59
Complete Streets Projects –
2012 and 2017 Bonds 59<br>
2012 and 2017 Bonds 59<br>
60
Complete Streets Projects –
2012 and 2017 Bonds 60<br>
2012 and 2017 Bonds 60<br>
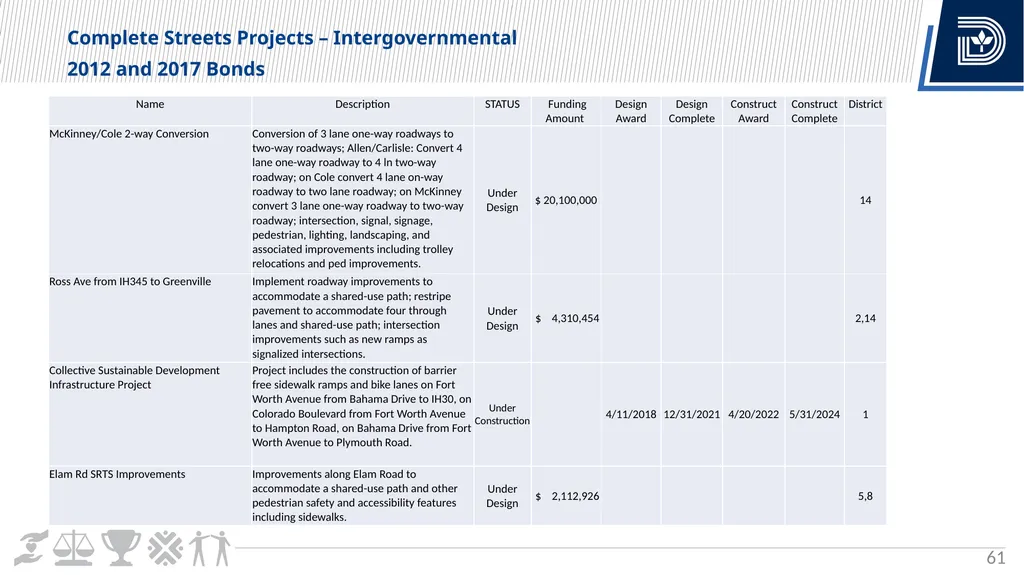
61
Complete Streets Projects – Intergovernmental
2012 and 2017 Bonds 61<br>
2012 and 2017 Bonds 61<br>
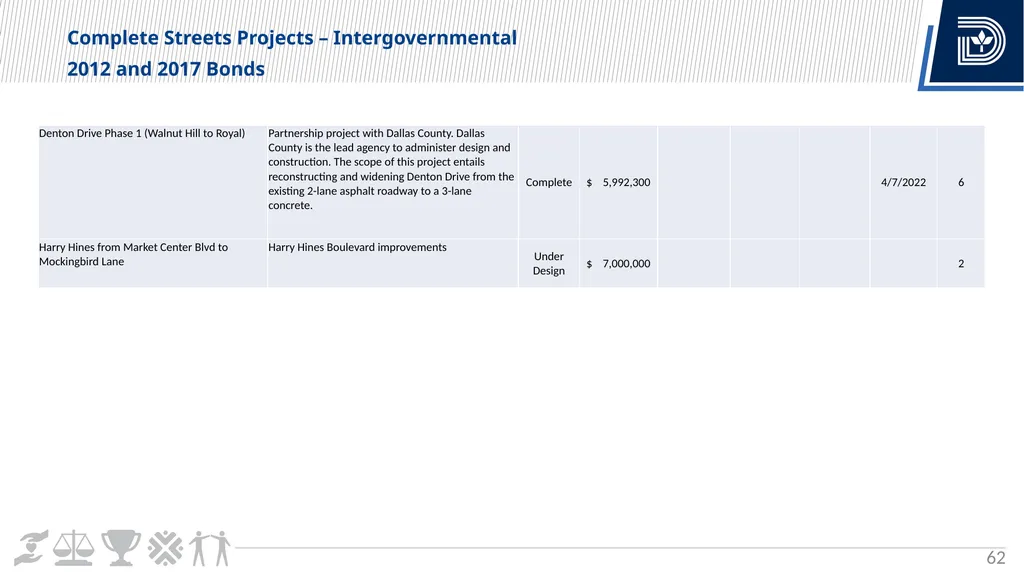
62
Complete Streets Projects – Intergovernmental
2012 and 2017 Bonds 62<br>
2012 and 2017 Bonds 62<br>
63
Safety Countermeasures* 63 *Proven Safety Countermeasures Sourced from Federal Highway Administration’s Office of Safety<br>
64
Safety Countermeasures* 64 *Proven Safety Countermeasures Sourced from Federal Highway Administration’s Office of Safety<br>
65
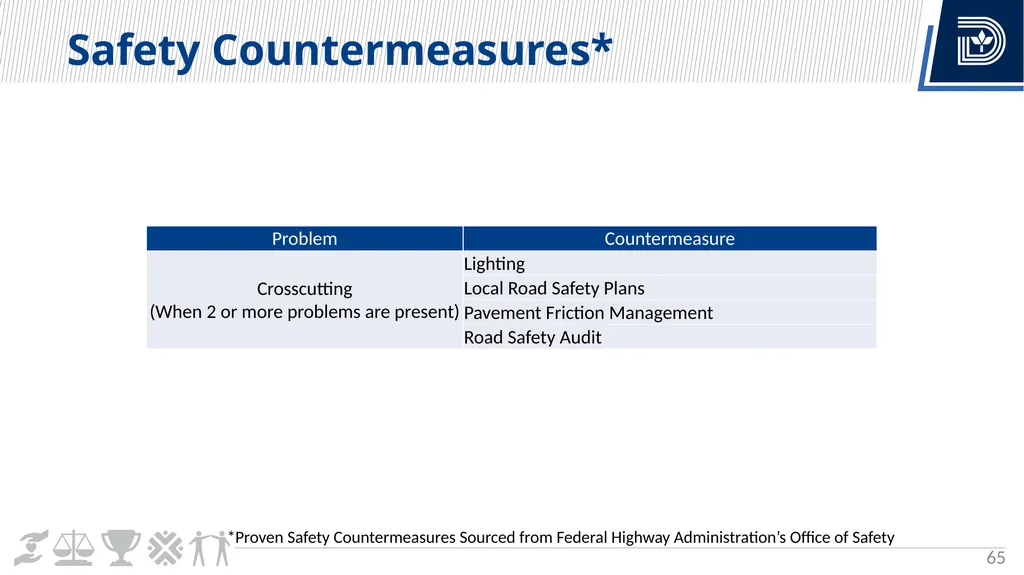
Safety Countermeasures* 65 *Proven Safety Countermeasures Sourced from Federal Highway Administration’s Office of Safety<br>
66
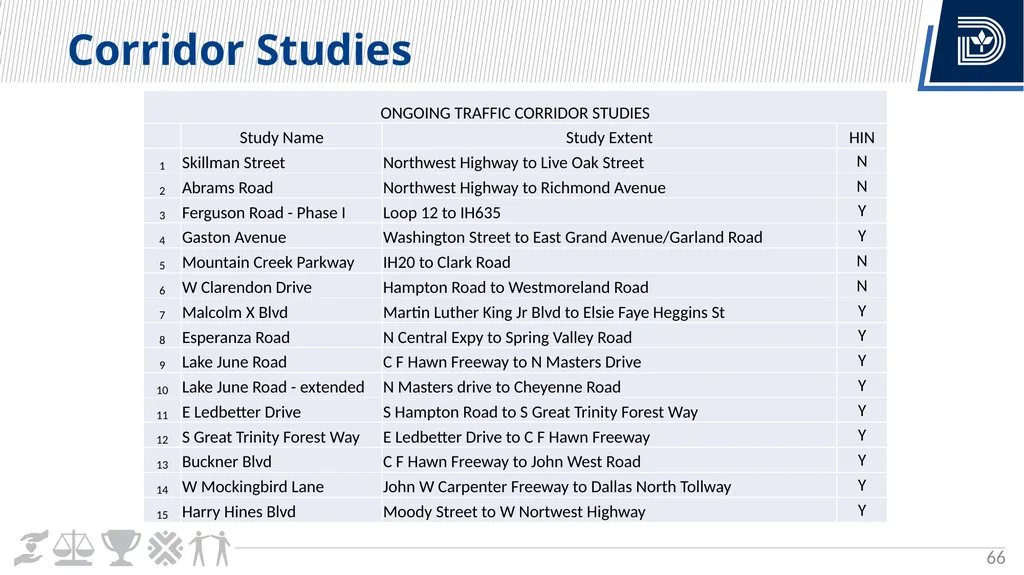
Corridor Studies 66<br>
67
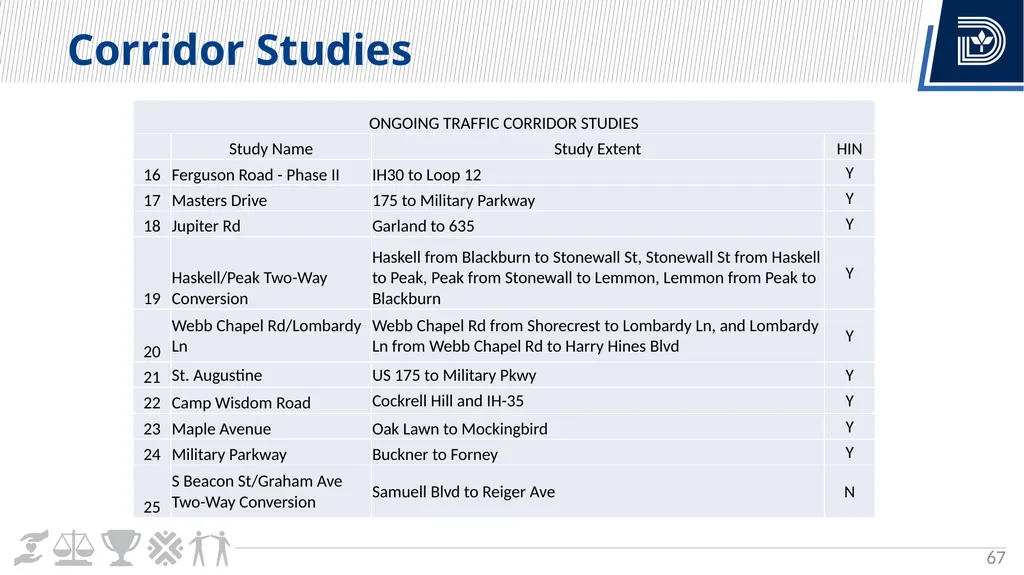
Corridor Studies 67<br>