Your companys product here Positioning Map Three Ways to Create a Positioning Map SEGMETNATION MAP, TWO AXIS Determine two measurable dimensions or determinant attributes (can be quantity or quality) that will indicate who competes
"[Your company’s product here] Positioning Map" is the property of its rightful owner. Permission is granted to
download and print the materials on this website for personal, non-commercial use only, and to display it
on your personal computer provided you do not modify the materials and that you retain all copyright
notices contained in the materials. By downloading content from our website, you accept the terms of this
agreement.
Presentation Transcript
01
[Your company’s product here] Positioning Map<br>
02
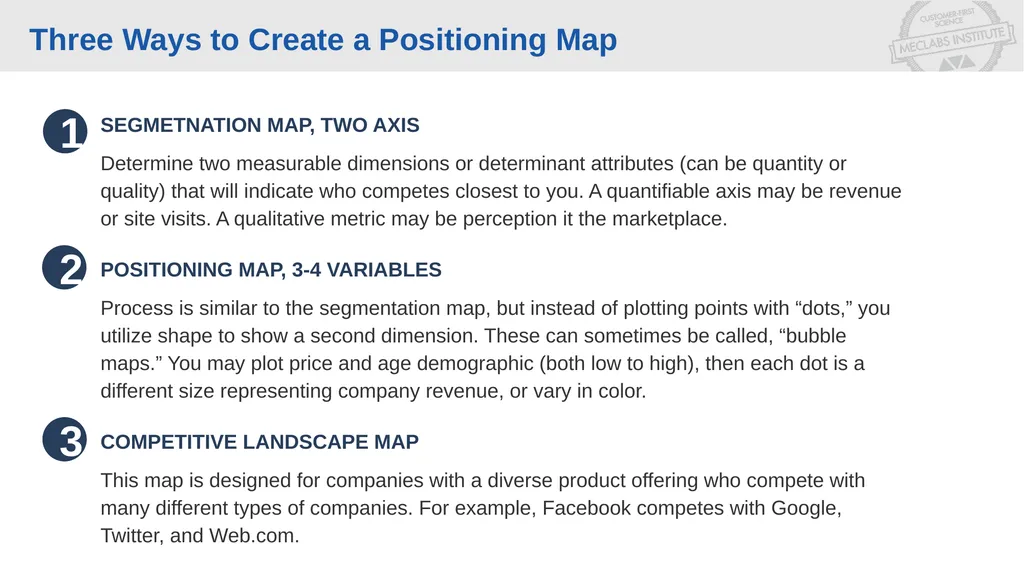
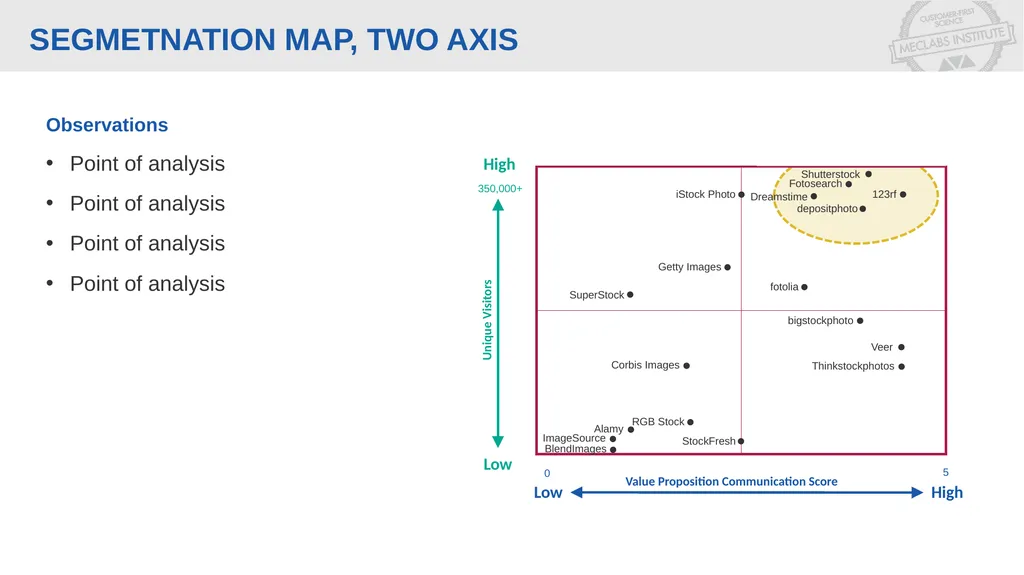
Three Ways to Create a Positioning Map SEGMETNATION MAP, TWO AXIS
Determine two measurable dimensions or determinant attributes (can be quantity or quality) that will indicate who competes closest to you. A quantifiable axis may be revenue or site visits. A qualitative metric may be perception it the marketplace.
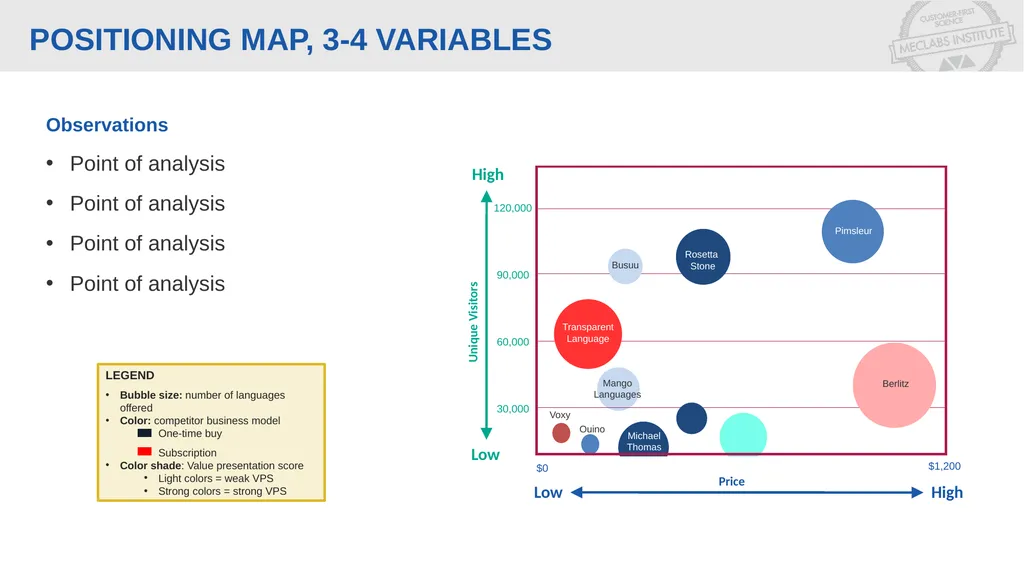
POSITIONING MAP, 3-4 VARIABLES
Process is similar to the segmentation map, but instead of plotting points with “dots,” you utilize shape to show a second dimension. These can sometimes be called, “bubble maps.” You may plot price and age demographic (both low to high), then each dot is a different size representing company revenue, or vary in color.
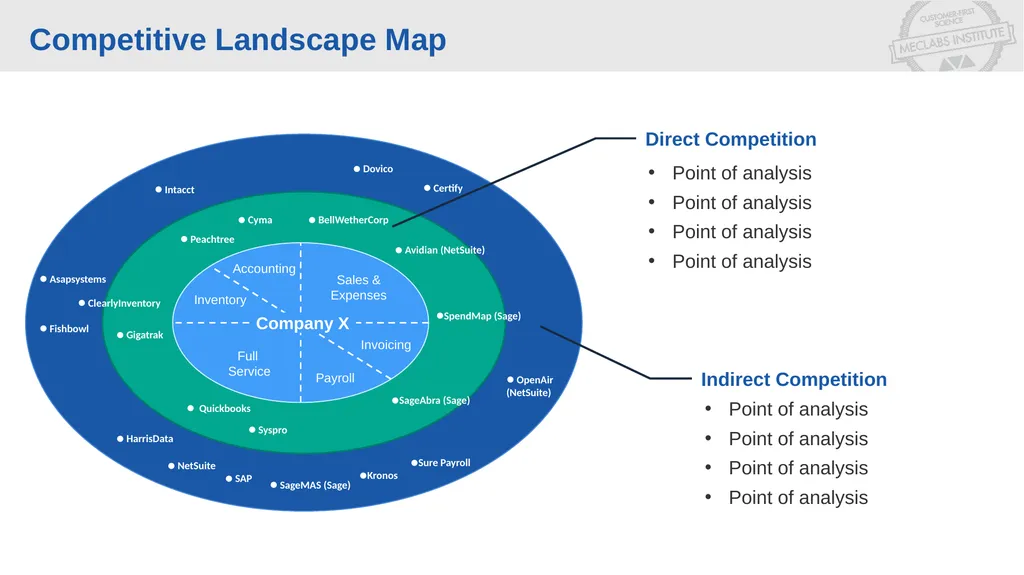
COMPETITIVE LANDSCAPE MAP
This map is designed for companies with a diverse product offering who compete with many different types of companies. For example, Facebook competes with Google, Twitter, and Web.com. 1 2 3<br>
03
PROCESS To segment the competitors, follow a 3 step process:
Identify attributes
Gather and organize data
Segment
Why do we segment competitors?
Segmenting competitors enables you to perceive and take advantage of differences between product offerings to better meet the needs and increase the conversion of customers visiting your site
A segmentation of competitors will help indicate what currently drives success in the industry and may lend insights into your company’s unique value proposition<br>
04
STEP ONE Step 1: Identify Attributes
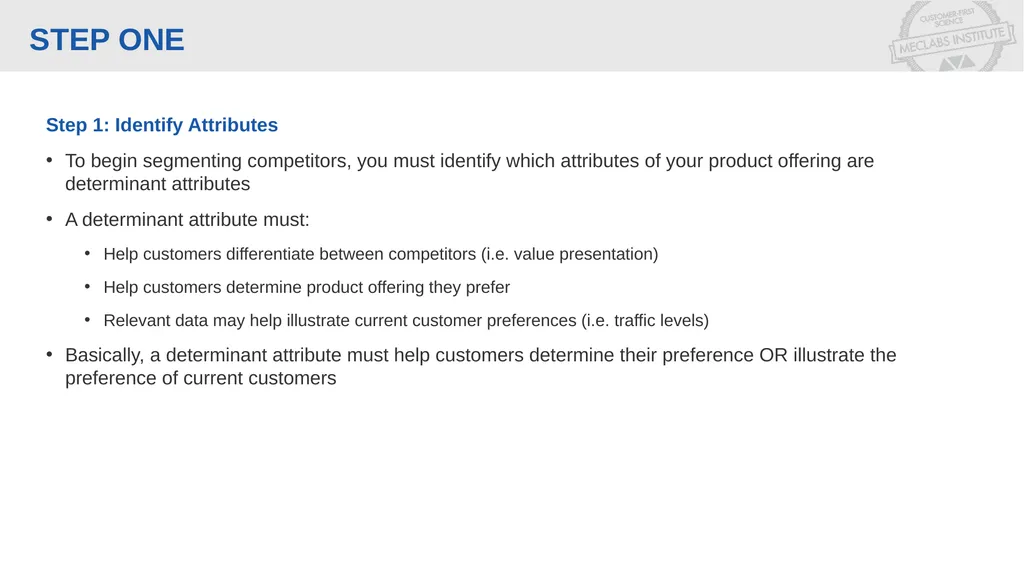
To begin segmenting competitors, you must identify which attributes of your product offering are determinant attributes
A determinant attribute must:
Help customers differentiate between competitors (i.e. value presentation)
Help customers determine product offering they prefer
Relevant data may help illustrate current customer preferences (i.e. traffic levels)
Basically, a determinant attribute must help customers determine their preference OR illustrate the preference of current customers<br>
05
STEP ONE Step 1: Identify Attributes
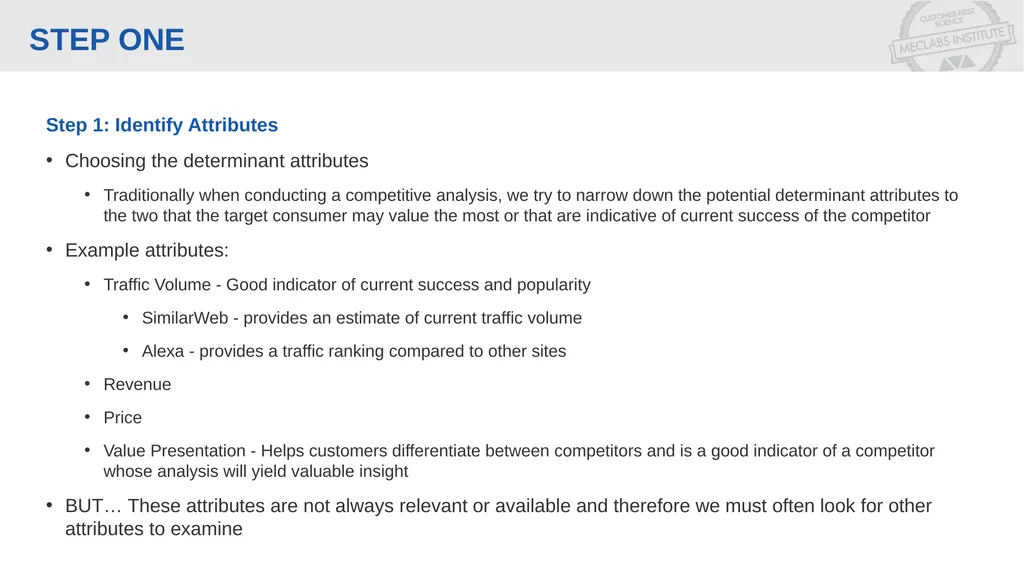
Choosing the determinant attributes
Traditionally when conducting a competitive analysis, we try to narrow down the potential determinant attributes to the two that the target consumer may value the most or that are indicative of current success of the competitor
Example attributes:
Traffic Volume - Good indicator of current success and popularity
SimilarWeb - provides an estimate of current traffic volume
Alexa - provides a traffic ranking compared to other sites
Revenue
Price
Value Presentation - Helps customers differentiate between competitors and is a good indicator of a competitor whose analysis will yield valuable insight
BUT… These attributes are not always relevant or available and therefore we must often look for other attributes to examine<br>
06
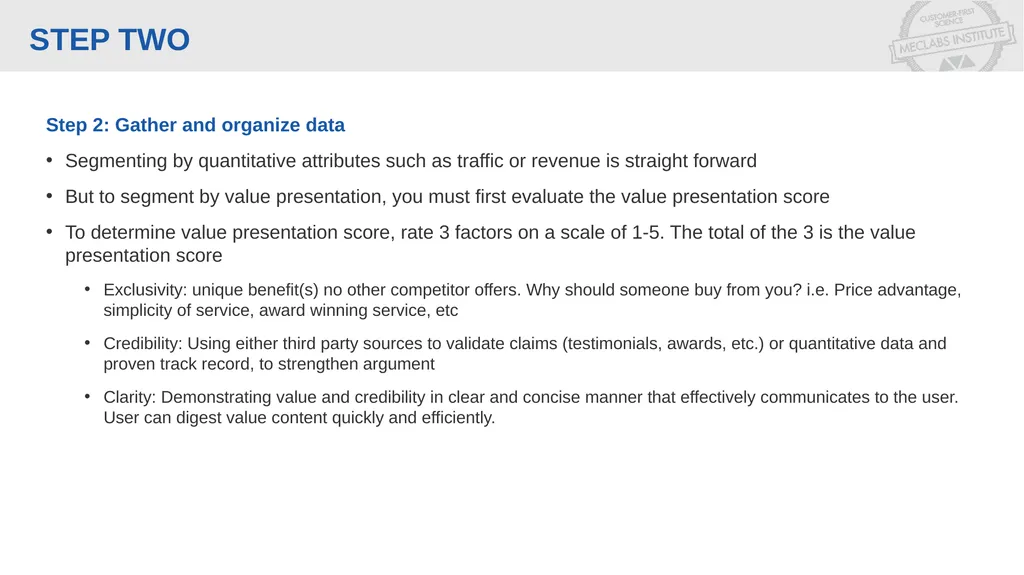
STEP TWO Step 2: Gather and organize data
Segmenting by quantitative attributes such as traffic or revenue is straight forward
But to segment by value presentation, you must first evaluate the value presentation score
To determine value presentation score, rate 3 factors on a scale of 1-5. The total of the 3 is the value presentation score
Exclusivity: unique benefit(s) no other competitor offers. Why should someone buy from you? i.e. Price advantage, simplicity of service, award winning service, etc
Credibility: Using either third party sources to validate claims (testimonials, awards, etc.) or quantitative data and proven track record, to strengthen argument
Clarity: Demonstrating value and credibility in clear and concise manner that effectively communicates to the user. User can digest value content quickly and efficiently.<br>
07
SEGMETNATION MAP, TWO AXIS Observations
Point of analysis
Point of analysis
Point of analysis
Point of analysis Low High Unique Visitors High Value Proposition Communication Score 5 0 350,000+ Shutterstock Fotosearch BlendImages 123rf depositphoto fotolia bigstockphoto Veer Thinkstockphotos Corbis Images Dreamstime StockFresh RGB Stock SuperStock Alamy ImageSource iStock Photo Getty Images Low<br>
08
POSITIONING MAP, 3-4 VARIABLES Observations
Point of analysis
Point of analysis
Point of analysis
Point of analysis Low High Unique Visitors High $1,200 $0 Low Pimsleur 120,000 60,000 Price 90,000 30,000 Voxy Ouino Michael Thomas Pimsleur Berlitz Rosetta
Stone Transparent Language Mango Languages Busuu<br>
09
Competitive Landscape Map Payroll Inventory Sales &
Expenses Invoicing Peachtree Accounting Intacct Cyma NetSuite HarrisData Syspro SAP SageMAS (Sage) Fishbowl Asapsystems Gigatrak ClearlyInventory SpendMap (Sage) OpenAir
(NetSuite) Sure Payroll SageAbra (Sage) Kronos BellWetherCorp Avidian (NetSuite) Certify Dovico Indirect Competition Direct Competition Quickbooks Point of analysis
Point of analysis
Point of analysis
Point of analysis Point of analysis
Point of analysis
Point of analysis
Point of analysis Full
Service Company X<br>
10
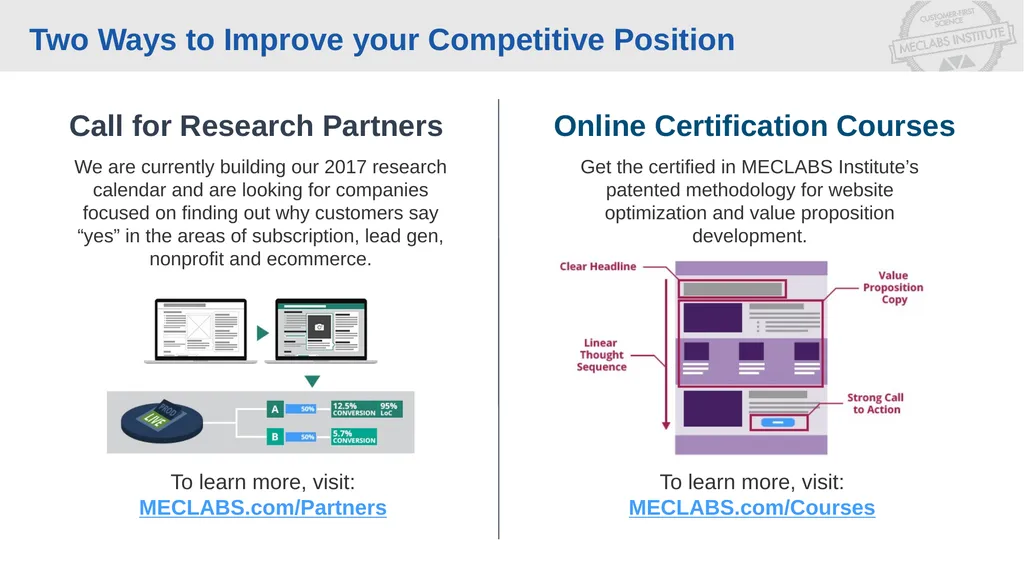
Two Ways to Improve your Competitive Position Call for Research Partners We are currently building our 2017 research calendar and are looking for companies focused on finding out why customers say “yes” in the areas of subscription, lead gen, nonprofit and ecommerce. Online Certification Courses To learn more, visit:
MECLABS.com/Partners Get the certified in MECLABS Institute’s patented methodology for website optimization and value proposition development. To learn more, visit:
MECLABS.com/Courses<br>