/
Annotation of  Drosophila Annotation of  Drosophila

Annotation of Drosophila - PowerPoint Presentation

vivian
vivian . @vivian
Follow
342 views
Uploaded On 2022-06-07

Annotation of Drosophila - PPT Presentation

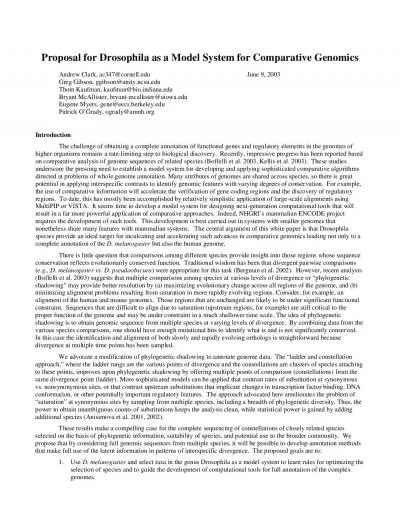
Last Updated 12262021 Wilson Leung and Chris Shaffer Agenda Overview of the GEP annotation project GEP annotation strategy Types of evidence Analysis tools Web databases Annotation of a single isoform walkthrough ID: 914458

cds gene sequence genome gene cds genome sequence annotation frame blast phase mav melanogaster gep browser blastx acceptor evidence

Share:

Link:

Embed:

Download Presentation from below link

Download Presentation The PPT/PDF document "Annotation of Drosophila" is the property of its rightful owner. Permission is granted to download and print the materials on this web site for personal, non-commercial use only, and to display it on your personal computer provided you do not modify the materials and that you retain all copyright notices contained in the materials. By downloading content from our website, you accept the terms of this agreement.


Presentation Transcript

Slide1

Annotation of Drosophila

Last Updated: 12/26/2021

Wilson Leung and Chris Shaffer

Slide2

AgendaOverview of the GEP annotation projectGEP annotation strategy

Types of evidenceAnalysis toolsWeb databases

Annotation of a single isoform (walkthrough)

Slide3

AAACAACAATCATAAATAGAGGAAGTTTTCGGAATATACGATAAGTGAAATATCGTTCTTAAAAAAGAGCAAGAACAGTTTAACCATTGAAAACAAGATTATTCCAATAGCCGTAAGAGTTCATTTAATGACAATGACGATGGCGGCAAAGTCGATGAAGGACTAGTCGGAACTGGAAATAGGAATGCGCCAAAAGCTAGTGCAGCTAAACATCAATTGAAACAAGTTTGTACATCGATGCGCGGAGGCGCTTTTCTCTCAGGATGGCTGGGGATGCCAGCACGTTAATCAGGATACCAATTGAGGAGGTGCCCCAGCTCACCTAGAGCCGGCCAATAAGGACCCATCGGGGGGGCCGCTTATGTGGAAGCCAAACATTAAACCATAGGCAACCGATTTGTGGGAATCGAATTTAAGAAACGGCGGTCAGCCACCCGCTCAACAAGTGCCAAAGCCATCTTGGGGGCATACGCCTTCATCAAATTTGGGCGGAACTTGGGGCGAGGACGATGATGGCGCCGATAGCACCAGCGTTTGGACGGGTCAGTCATTCCACATATGCACAACGTCTGGTGTTGCAGTCGGTGCCATAGCGCCTGGCCGTTGGCGCCGCTGCTGGTCCCTAATGGGGACAGGCTGTTGCTGTTGGTGTTGGAGTCGGAGTTGCCTTAAACTCGACTGGAAATAACAATGCGCCGGCAACAGGAGCCCTGCCTGCCGTGGCTCGTCCGAAATGTGGGGACATCATCCTCAGATTGCTCACAATCATCGGCCGGAATGNTAANGAATTAATCAAATTTTGGCGGACATAATGNGCAGATTCAGA

ACGTATTAACAAAATGGTCGGCCCCGTTGTTAGTGCAACAGGGTCAAATATCGCAAGCTCAAATATTGGCCCAAGCGGTGTTGGTTCCGTATCCGGTAATGTCGGGGCACAATGGGGAGCCACACAGGCCGCGTTGGGGCCCCAAGGTATTTCCAAGCAAATCACTGGATGGGAGGAACCACAATCAGATTCAGAATATTAACAAAATGGTCGGCCCCGTTGTTATGGATAAAAAATTTGTGTCTTCGTACGGAGATTATGTTGTTAATCAATTTTATTAAGATATTTAAATAAATATGTGTACCTTTCACGAGAAATTTGCTTACCTTTTCGACACACACACTTATACAGACAGGTAATAATTACCTTTTGAGCAATTCGATTTTCATAAAATATACCTAAATCGCATCGTC

Start codon

Coding region

Stop codon

Splice donor

Splice acceptor

UTR

Slide4

Annotation:Adding labels to a sequenceGenes

: Novel or known genes, pseudogenesRegulatory Elements: Promoters, enhancers, silencersNon-coding RNA: tRNAs, miRNAs,

siRNAs

, snoRNAs

Repeats

: Transposable elements, simple repeatsStructural: Origins of replicationExperimental Results: DNase I Hypersensitive sitesChIP-chip and ChIP-Seq datasets (e.g., modENCODE)

Slide5

GEP Annotation Projects

GEP Publications

Motif Project

Informant Species

F Expansion Project

D. busckii

D. hydei

D. navojoa

D. arizonae

D. obscura

D. serrata

D. suzukii

D. grimshawi

D. virilis

D. mojavensis

D. willistoni

D. miranda

D. pseudoobscura

D. persimilis

D. bipectinata

D. ananassae

D. kikkawai

D. ficusphila

D. rhopaloa

D. elegans

D. takahashii

D. biarmipes

D. eugracilis

D. yakuba

D. erecta

D. melanogaster

D. simulans

D. sechellia

Tree scale: 0.1

The Pathways Project annotates genes from

27

Drosophila

species

F Element Projects

The Parasitoid Wasp Project annotates genes from 4 wasp species

Slide6

Muller element nomenclature

Species

A

B

C

DEF

D. simulans

X2L2R

3L3R

4D. sechelliaX2L2R3L3R4D. melanogasterX

2L

2R3L3R4D. yakubaX2L2R

3L

3R4D. erectaX2L2R

3L

3R

4

D. ananassae

XLXR

3R

3L

2R

2L4L4R

D. pseudoobscura

XL

4

3

XR2

5

D. persimilis

XL4

3

XR25D. willistoniXL2R

2L

XR3D. mojavensisX3

5

4

2

6

D. virilis

X

4

5

3

2

6

D. grimshawi

X

3

2

5

4

6

Muller elements

Slide7

Nomenclature for Drosophila genes

Drosophila gene names are case-sensitive

Lowercase

initial letter =

recessive mutant phenotypeUppercase initial letter = dominant mutant phenotypeEvery D. melanogaster gene has an annotation symbolBegins with the prefix CG (Computed Gene)Some genes have a different gene symbol (e.g., mav)Suffix after the gene symbol denotes different isoforms

mRNA =

-R; protein = -Pmav-RA = Transcript for the A isoform of mav

mav-PA = Protein product for the A isoform of mav

Slide8

GEP annotation strategyTechnique optimized for projects with a

moderately close, well annotated neighbor speciesExample: D. melanogasterNeed to apply different strategies when annotating genes in other species:

Example: corn, parrot, parasitoid wasps

Slide9

GEP annotation goals Identify and annotate all the genes in your project

For each gene, identify and precisely map (accurate to the base pair) all coding exons (CDS)Do this for

ALL

isoforms

Annotate

the initial transcribed exon and transcription start site (TSS)Optional curriculum not submitted to GEPClustal analysis (proteins, promoter regions)Non-coding genes

Slide10

Evidence-based annotationHuman-curated analysis

Much higher accuracy than standard ab initio and evidence-based gene findersGoal: collect

,

analyze

, and

synthesize all the available evidence to create the best-supported gene modelExample: 4591-4688, 5157-5490, 5747-6001

Slide11

Collect, analyze, and synthesizeCollect:

Genome BrowserConservation (BLAST searches) Analyze:

Interpreting Genome Browser evidence tracks

Interpreting

BLAST

resultsSynthesize:Construct the best-supported gene model based on potentially contradictory evidence

Slide12

Evidence for gene models(in general order of importance)

ConservationSequence similarity to genes in D. melanogasterSequence similarity to other Drosophila

species (

ROAST

)

Expression dataRNA-Seq, EST, cDNAComputational predictionsOpen reading frames (ORFs), gene and splice site predictionsTie-breakers of last resortSee the “Annotation Instruction Sheet”

Slide13

Expression data: RNA-SeqPositive results are very helpful

Negative results are less informativeLack of transcription ≠ no geneEvidence tracks:

RNA-

Seq

coverage (read depth)

Splice junction predictionsAssembled transcripts (Cufflinks, Oases)GEP curriculum:RNA-Seq Primer (PowerPoint presentation)Browser-Based Annotation and RNA-Seq Data

Slide14

Gene structure - terminology

Gene span

Primary

Exons

UTR’s

CDS’s

mRNA

Protein

Slide15

Basic annotation workflowIdentify the

likely ortholog in D. melanogaster

Determine the

gene structure

of the ortholog

Map each CDS of ortholog to the project sequenceUse BLASTX to identify conserved regionNote position and reading frameUse these data to construct a gene modelIdentify the exact start and stop base position for each CDSUse the Gene Model Checker to verify the gene model

For each additional isoform,

repeat steps 2-5

Slide16

BLASTX

search of each

D. melanogaster

CDS against the contig

Contig

Feature

Annotation workflow (graphically)

Contig

BLASTP

search of feature against the

D. melanogaster

proteins database

Feature

D. melanogaster

gene model (1 isoform, 5 CDS)

1

3

Reading frame

Alignment

2

1

3

Slide17

Identify the exact coordinates of each CDS using the Genome Browser

Annotation workflow (graphically)

BLASTX

search of each

D. melanogaster

CDS against the contig

Contig

1

3

Reading frame

Alignment

2

1

3

GT

1

AG

GT

M

3

Reading frame

Use the

Gene Model Checker

to verify the final CDS coordinates

Gene model

1245

1383

1437

1678

1740

2081

2159

2337

2397

2511

1245-1383, 1437-1678, 1740-2081, 2159-2337, 2397-2511

Coordinates:

Slide18

UCSC Genome BrowserProvide a graphical view of genomic regions

Sequence conservationGene and splice site predictionsRNA-Seq

data and splice junction predictions

BLAT

BLAST-Like Alignment ToolMap protein or nucleotide sequence against an assemblyFaster but less sensitive than BLASTTable BrowserAccess raw data used to create the graphical browser

Slide19

UCSC Genome Browser overview

Genomic sequence

Evidence tracks

BLASTX

alignments

Gene predictions

RNA-Seq

Comparative genomics

Repeats

Slide20

Two different versions of the UCSC Genome Browser

Official UCSC Version

https://genome.ucsc.edu/

Published data

, lots of species, whole genomes; used for species with UCSC Assembly Hubs (e.g., parasitoid wasps)GEP Versionhttps://gander.wustl.edu GEP projects

, Drosophila

genome assemblies; used for Drosophila annotations

Slide21

Additional resources for the UCSC Genome Browser

Training section on the UCSC websitehttps://genome.ucsc.edu/training.htmlVideo tutorials

User guides

Mailing lists

Biostars

https://www.biostars.org/t/ucsc/Questions with the “ucsc” tag

Slide22

Four websites used by the GEP annotation strategy

Open 4 tabs on your web browser:GEP UCSC Genome Browser

(

https://gander.wustl.edu

)

Genome BrowserD. virilis – Mar. 2005 – chr10FlyBase (https://flybase.org/) Tools  Genomics Tools 

BLAST

Gene Record Finder (https://gander.wustl.edu/~wilson/dmelgenerecord/)

GEP website  Projects

 F ElementInformation on the D. melanogaster gene structureNCBI BLAST (https://blast.ncbi.nlm.nih.gov)BLASTX  select the checkbox:

Slide23

Initial survey of a genomic region

Investigate gene prediction chr10.4 in a fosmid project (chr10) from D. virilis using the GEP UCSC Genome Browser

Slide24

Navigate to the Genome Browser for the project region

Configure the Genome Browser Gateway page:Browse/Select Species: D. virilisD. virilis

Assembly:

Mar. 2005 (GEP/

Annot

. D. virilis ppt)Position/Search Term: chr10Click “Go”

Slide25

Control how evidence tracks are displayed on the Genome Browser

Five different display modes:Hide: track is hiddenDense: all features appear on a

single line

Squish

: overlapping features appear on

separate linesFeatures are half the height compared to full modePack: overlapping features appear on separate linesFeatures are the same height as full modeFull: each feature is displayed on its own lineSet “Base Position” track to “Full” to see the amino acid translationsSome evidence tracks (e.g.

, RepeatMasker) only have a subset of these display modes

Slide26

Initial assessment of fosmid project chr10

Seven gene predictions (features) from GenscanNeed to investigate each feature if one were to annotate this entire project

Slide27

Investigate gene prediction chr10.4Enter chr10:15000-21000 in the position box and click

go to navigate to this regionClick on the feature and select “Predicted Protein” to retrieve the predicted protein sequence

Select and copy the sequence

Slide28

Computational evidenceAssumption: there are recognizable signals in the DNA sequence that the cell uses; it should be possible to detect these signals computationally

Many programs designed to detect these signalsUse machine learning and Bayesian statisticsThese programs do work to a certain extent

The information they provide is better than nothing

The predictions

have high error rates

Slide29

Accuracy of the different types of computational evidenceDNA sequence analysis:

ab initio gene predictors – exons vs. genesSplice site predictors – high sensitivity but low specificityMulti-species alignment – low specificity

BLASTX

protein alignment:

WARNING!

Students often over-interpret the BLASTX alignment track (D. mel Proteins); use with caution

Slide30

Data on the Genome Browser is incomplete

Most evidence has already been gathered for you and they are shown in the Genome Browser tracksAnnotator still needs to generate conservation dataAssign

orthology

Look for regions of conservation using

BLAST

Collect the locations (position, frame, and strand) of conservation to the orthologous proteinIf no expression data are available, these searches might need to be exhaustive (labor intensive)

Slide31

Detect sequence similarity with BLASTBLAST =

Basic Local Alignment S

earch

T

ool

Why is BLAST popular?Provide statistical significance for each matchGood balance between sensitivity and speedIdentify local regions of similarity

Slide32

Common BLAST programsExcept for

BLASTN, all alignments are based on comparisons of protein sequencesAlignment coordinates are relative to the original sequences

Decide which

BLAST

program to use based on the type of query and subject sequences:

ProgramQueryDatabase (Subject)BLASTNNucleotide

Nucleotide

BLASTP

ProteinProtein

BLASTXNucleotide → ProteinProteinTBLASTNProtein

Nucleotide →

ProteinTBLASTXNucleotide → ProteinNucleotide → Protein

Slide33

Where can I run BLAST?NCBI BLAST web service

https://blast.ncbi.nlm.nih.gov/Blast.cgi EBI BLAST web service

https://

www.ebi.ac.uk

/Tools/

sss/FlyBase BLAST (D. melanogaster)https://flybase.org/blast/

Slide34

Accessing TBLASTX at NCBI

BLASTN

BLASTP

Slide35

Detect conserved D. melanogaster coding exons with BLASTXCoding sequences evolve slowly

Exon structure changes very slowlyUse sequence similarity to infer homology

D. melanogaster

very well annotated

Use

BLAST to find similarity at amino acid levelAs evidence accumulates indicating the presence of a gene, we could justify spending more time and effort looking for conservation

Slide36

FlyBase – Database for the Drosophila research community

Key features:Lots of ancillary data for each gene in D. melanogasterCuration of literature for each gene

Reference

D. melanogaster

annotations for other databases (including NCBI, EBI, and DDBJ)

Fast release cycle (~6-8 releases per year)

Slide37

Web databases and toolsMany genome databases available

Be aware of different annotation releasese.g., release 6 versus release 5 assemblies

Use

FlyBase

as the canonical referenceWeb databases are being updated constantlyUpdate GEP materials before semester startsPotential discrepancies in exercise screenshotsMinor changes in search resultsLet us know about errors or revisions

Slide38

Finding the orthologBLASTP search of the chr10.4 gene prediction against the set of D. melanogaster proteins at FlyBase

Slide39

BLASTP

results show a significant hit to the mav gene

Note the large change in E-value from

mav

-PA to the next best hit

gbb-PB; good evidence for orthologyFlyBase naming convention:<gene symbol>-[RP]<isoform> R = mRNA, P = Proteinmav-PA = Protein product from the A isoform of the gene mav

Slide40

Results of ortholog searchDegree of similarity consistent with comparison of typical proteins from

D. virilis versus D. melanogasterRegions of strong similarity interspersed with regions of little or no similaritySame Muller element supports orthology

We have a probable ortholog:

mav

Slide41

Constructing a gene modelWe need more information on

mav:Determine the gene function and structure in D. melanogasterIf this is the ortholog, we also need the amino acid sequence of each CDS

Use two websites to learn about the gene structure:

FlyBase

Graphical representation of the gene; detailed information on each gene

Gene Record FinderTable list of isoforms, retrieve exon sequences

Slide42

Obtain the gene structure modelUsing the Gene Record Finder and FlyBase to determine the gene structure of the D. melanogaster

gene mav

Slide43

Retrieve the

Gene Record Finder record for mav

Type

mav

into the search box, then press [Enter]

Click on the “View in GBrowse” link to get a graphical view of the gene structure on FlyBase

Slide44

Gene structure of mavBoth the graphical and table view shows

mav has a single isoform (mav-RA) in D. melanogasterThis isoform has two transcribed exons

Both exons contain translated regions

Gene Record Finder

table format

FlyBase GBrowse graphical format

Slide45

Investigate exonsSearch each CDS from D. melanogaster against the project sequence (e.g.

, fosmid / contig)Identify regions within the project sequence that code for amino acids similar to the D. melanogaster CDSBest to search with the entire project DNA sequence

Easier to keep track of positions and reading frames

Slide46

Identify the conserved regionsUse BLASTX

to map each D. melanogaster CDS from the mav gene against the D. virilis

chr10 fosmid sequence

Slide47

Retrieve CDS sequencesIn the Polypeptide Details

section of the Gene Record Finder, select a row in the CDS tableThe corresponding CDS sequence will appear in the Sequence viewer window

Slide48

Retrieve the fosmid sequenceGo back to the Genome Browser (first tab) and navigate to

chr10Click on the DNA link under the “View” menu, then click on the “

get DNA

” button

Slide49

Compare the CDS against the fosmid sequence with BLASTX

Copy and paste the genomic sequence from tab 1 into the “Enter Query Sequence” textbox Copy and paste the sequence for the

CDS 1_9489_0

from tab 2 into the “Enter

Subject

Sequence” textboxExpand the “Algorithm parameters” section:Verify the Word size is set to 3: Turn off compositional adjustmentsTurn off the low complexity filterClick “BLAST”

Slide50

Adjust the Expect thresholdE-value is negatively correlated with alignment length

Difficult to find small exons with BLASTSometimes BLAST cannot find regions with significant similarity:

Use the

Query

subrange

field to restrict the search regionChange the Expect threshold to 1000 and try againKeep increasing the Expect threshold until you get hitsThis strategy will identify regions with very weak similarity, but they can be better than nothing

Slide51

BLASTX result shows a weak alignment50 identities and 94 similarities (positives)Low degree of similarity is not unusual when comparing single exons from these two species

Location: 16866-17504, frame: +3, missing first 92 aa

Examine the

BLASTX

alignment

Slide52

Map the second CDS (2_9489_0)Perform similar BLASTX

search with CDS 2_9489_0Location: chr10:18,476-19,747; Frame:

+2

;

Alignment includes the entire CDS except for first amino acid

For larger genes, continue mapping each exon with BLASTX (adjust Expect threshold as needed)Record location, frame, and missing amino acidsBLAST might not find very small exonsMove on and come back laterPlotting the location of each CDS might helpNote the parts of the CDS’s missing from the alignments

Slide53

Building a gene modelDetermine the exact start and end positions of each exon for the putative mav-PA ortholog

Slide54

Identify missing parts of CDS

BLASTX CDS alignments for mav on D. virilis

93

271

2

431

16,866

17,504

18,476

19,747

Frame +3

Frame +2

Slide55

Basic biological constraints (inviolate rules*)

Coding regions start with a methionineCoding regions end with a

stop codon

Gene should be on only one strand of DNA

Exons appear in order along the DNA (collinear)

Intron sequences should be at least 40 bpIntron starts with a GT (or rarely GC)Intron ends with an AG

* There are known exceptions to each rule

Slide56

Find the missing start codonOnly a single

start codon (16,515-16,517 in frame +3) upstream of conserved region before the stop codon

Start codon at 16,977-16,979 would truncate conserved region

CDS alignment starts at 16,866 but 92 amino acids missing

16,866 - (92 * 3) = 16,590

Slide57

A genomic sequence has 6 different reading framesFrame: Base to begin translation relative to the first base of the sequence

Frames

1

2

3

Slide58

Splice donor and acceptor phasesPhase

: Number of bases between the complete codon and the splice siteDonor phase: Number of bases between the end of the last complete codon and the splice donor site (GT/GC)

Acceptor phase: Number of bases between the splice acceptor site (AG) and the

start of the first complete codon

Phase

depends on the reading frame of the CDS

Slide59

Phase depends on the reading frame

Phase of acceptor site:

Phase

2

relative to frame

+1Phase 0 relative to frame +2Phase 1 relative to frame +3Splice Acceptor

Slide60

Phase of donor and acceptor sites must be compatibleExtra nucleotides from donor and acceptor phases will form

an additional codonDonor phase + acceptor phase = 0 or

3

GT

AG

… … …

CCA

AAT

G

CTC

GAT

TT

P

N

V

L

D

Translation:

CCA

AAT

G

CTC

GAT

GTT

CCA

AAT

CTC

GAT

TT

Slide61

Incompatible donor and acceptor phases results in a frame shiftPhase 0 donor is incompatible with phase 2 acceptor; use prior GT, which is a phase 1 donor.

CCA

GT

AG

… …

AAT

G

CTC

GAT

TT

P

N

G

F

S

Translation:

GT

CCA

AAT

TCG

AT

G

GT

TT

C

Slide62

Picking the best acceptor site

Reading frame (

+2

) dictated by

BLASTX

resultTwo splice acceptor candidates:18,471-18,472 (phase 0)18,482-18,483 (phase 1), remove conserved amino acids18,471-18,472 is the better candidatePick different candidate if no phase 0 donor in previous exon

Slide63

Picking the best donor site

Reading frame (

+3

) dictated by

BLASTX

resultTwo splice donor candidates:17,505-17,506 (phase 0)17,518-17,519 (phase 1)Phase 0 donor (17,505-17,506) is compatible with phase 0 acceptor (18,471-18,472)

Slide64

Create the final gene modelPick ATG (

M) at the start of the geneFor each putative intron/exon boundary, use the Genome Browser to locate the exact first and last base of the exonAfter splicing, conserved amino acids are linked together in a single long open reading frame

CDS coordinates for

mav

: 16515-17504, 18473-

19744

Slide65

Additional strategies for identifying splice donor and acceptor sitesFor many genes, the location of donor and acceptor sites can be identified easily based on:

Locations and quality of the CDS alignmentsEvidence of expression from RNA-Seq

Splice junction predictions

When amino acid conservation is absent, other evidence and techniques must be considered. See the following documents for help:

Annotation Instruction Sheet

Annotation Strategy Guide

Slide66

Verify the final gene model using the Gene Model CheckerExamine the checklist and explain any errors or warnings in the GEP Annotation Report

View your gene model in the context of the other evidence tracks on the Genome BrowserExamine the dot plot and explain any discrepancies in the GEP Annotation ReportLook for large vertical and horizontal gaps

See the “

Quick Check of Student Annotations

” document on the GEP website

Slide67

Questions?

https://www.flickr.com/photos/jac_opo/240254763/sizes/l/