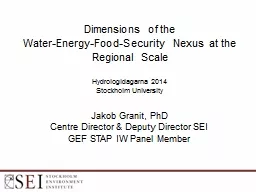
/
Jakob Granit, PhD Centre Director & Deputy Director SEI Jakob Granit, PhD Centre Director & Deputy Director SEI

Jakob Granit, PhD Centre Director & Deputy Director SEI - PowerPoint Presentation

volatilenestle
volatilenestle . @volatilenestle
Follow
345 views
Uploaded On 2020-07-02

Jakob Granit, PhD Centre Director & Deputy Director SEI - PPT Presentation

GEF STAP IW Panel Member Dimensions of the WaterEnergyFoodSecurity Nexus at the Regional Scale Hydrologidagarna 2014 Stockholm University Structure of presentation Context WEF Nexus Cases ID: 792741

amp water power energy water amp energy power granit 2012 supply hydropower regional generation nexus agriculture world region potential

Share:

Link:

Embed:

Download Presentation from below link

Download The PPT/PDF document "Jakob Granit, PhD Centre Director & ..." is the property of its rightful owner. Permission is granted to download and print the materials on this web site for personal, non-commercial use only, and to display it on your personal computer provided you do not modify the materials and that you retain all copyright notices contained in the materials. By downloading content from our website, you accept the terms of this agreement.


Presentation Transcript

Slide1

Jakob Granit, PhDCentre Director & Deputy Director SEIGEF STAP IW Panel Member

Dimensions of the

Water-Energy-Food-Security Nexus at the Regional Scale

Hydrologidagarna 2014

Stockholm University

Slide2

Structure of presentation

Context – WEF Nexus

Cases

ConclusionsFurther work

Slide3

Failure of meeting citizen and customer

demands –

the “bottom billion”

Slide4

Water

Slide5

More than 75% of river flows are allocated to agriculture,

i

ndustries

or domestic

purposes

Water resources

can be abundant but lack of investment makes them unavailable for

exploitation

C

limate variability

increases water resources challenges

Water scarcity:

Aggregated

global water supply

gap

estimated to be 40% by 2030 assuming

no

efficiency

gains

WRG 2030

Slide6

Indicators of water quality degradation

80

% of the world’s population is exposed to high levels of threat to

human water security (HWS)

large scale transformation of water systems through land cover change, urbanization, industrialization and hydrologic infrastructure

Dead zones in coastal oceans have spread exponentially since the 1960sCoastal eutrophication fueled by riverine runoff of fertilizers and the burning of fossil fuels

(Robert

J. Diaz

&

Rutger

Rosenberg,

2008)

Vörösmarty

et.al., 2010)

Slide7

G

T

ransboundary

freshwater resources – the collective action dilemma

Water (surface & ground) crosses boundaries

About 279 TB river basins in the world, 45% earth surface

(

Backer 2011)

Political & physical boundaries at local, national & international levels

Recognizing

:

The

political economy in sovereign states differ

Underlying power asymmetries to consider,

(

Zeitoun

and Warner

2006)

Only 20% of all multipartite basins

feature multilateral organisations, (Dombrowsky,2007)7 are basin wide, Cooperation compared

to conflict appears to be the norm in TB systems(Giordano and Wolf

2003)

Granit 2012

Slide8

Energy

Slide9

9

Unequal consumption of energy

Nilsson et.al. SEI 2012

Slide10

G

rowing

e

nergy c

onsumption trends & links to climate change

World energy consumption forecast to grow by 49 percent from 2007 to 2035

Fossil fuels expected to continue supply much of the energy used worldwide

85% of global energy supply in 2008

Availability of shale gas and oil is increasing

Renewable energy is relatively the fastest-growing source of electricity generation

Globally 13 % of

primary energy demand is met by renewable energy

Almost 80 percent of the increase is in hydroelectric power & wind power

Present emission trends put the world plausibly on a path toward 4°C warming within

this century

.

(WB 2012)

Quadrillion Btu

Source: International

Energy Outlook IEO 2010

,

Reference case

Slide11

Food

Slide12

Crop area available is being reduced

FAO

, 2011

Slide13

Fertilizer use in agriculture is increasing significantly

FAO

Slide14

Nexus

Slide15

1. Energy production

Water use in all steps of the thermal energy value chain

Water storage for hydropower

Water for bio fuels

2. Primary production

Agriculture (irrigation & rainfed)

ForestryFisheries

3. Industry & urbanization

Domestic use

Industrial use

Waste water treatment

Tourism

4. Ecosystem services

Water quality management

Biodiversity & conservation

Flood & drought protection

Navigation

Tradeoffs

Development opportunities/benefits in the nexus – conceptual model

Granit 2012, based on Phillips

, D., Allan, A.,

Claassen

, M., Granit, J., Jägerskog, A.,

Kistin

, E., Patrick, M. &

Turton

, A. (2008).

Slide16

Global water

withdrawal

patterns

low

efficency

70%

Agriculture

; 20%

industry

; 10%

households

(IWMI 2007)

Regional

differences

& trends in

water

withdrawal

EU: 44% for energy production, 24% for agriculture,

17% for public water supply, 15% industry

(EC 2007

)USA: 40% Irrigation, 39% Thermoelectric generation, 14% Public & domestic supply, 7% Industry (US Department of Energy 2006

)

Global consumptive use part of total water withdrawal for electricity

generation is about 3-5%

(

15% of the world’s total water

withdrawal, IEO 2012)

Security of supply is important to guarantee power generation

Return flows to be managed; temperature & quality

Energy

links to water withdrawal

& water

consumption

Slide17

Case South Eastern Baltic Sea Region

Slide18

South Eastern-Baltic Sea Region

A micro-region defined by its

transboundary

waters lacking cooperative frameworks

Slide19

Key water challenges in the micro-region – affects the economy as a whole

Supply

Deteriorating supply networks

Significant losses due to leakage

Lack of maintenance

HealthWater related disease

Exposure to toxic waste productsPollution

Point source pollution

Waste water treatment

Solid waste

management

Diffuse source pollution from agriculture

Environmental change

Climate change and hydrology impacts

Failing ecosystems

Loss of flora and fauna

Fisheries

affected

Development of protected areas

EnergyWater

for energy (cooling)Energy for water (pumping)Energy for regulation power (pump storage)

GovernanceEU BSR laws & national lawMultiple stakeholdersUnclear institutional frameworkPoor monitoring of natural & water resources

Granit, J. J., Lindström, A., Dimitrevsky, V., Guterstam, B., Hellström, M., Kindler, J., Kramen, L., Okruszko, T., Paukstys, B., Smorodinskaya, N. & Sorby, L. (2011).

Slide20

Slide21

The Water-Energy-Ecosystem Nexus and entry point for Neman cooperation?

Water for

energy

production

In the thermal power production process: pump, cool, treat (nuclear, coal, oil, biomass)In hydropower generation

Energy (electricity

) for water management and

supply

to

users

Pump, Treat, Store

Ecosystem services

Degradation of watersheds

Energy

Markets

Price, imports

Baltic Energy Market Integration Plan (BEMIP), BaltLink,

Slide22

Case Euphrates and Tigris Region

Slide23

Granit, J. & Joyce, J. (2012).

Options for Cooperative Action in the Euphrates & Tigris Region - A

hydro-economic model

to support basin-wide dialogue

Iran, Iraq, Syria and Turkey

Lack of cooperative arrangementsMajor

regional issues: salinity, dust and haze, loss of ecosystem values,

health and

loss of economic

opportunities

2 yrs

project

with

government

stakeholders

& regional organisations

Remote sensing, GIS & publicly available dataBaseline hydropower value: USD 3.5 billion/yIrrigated agriculture USD 4.8

billion/yShadow values for environmental flows Range between 286 to 515 million USDModelling & results can improve dialogue between riparian countries on regional integration benefitsMeasures to improve water use efficeny, Iraq

Nucleus for institutional framework:

Granit, J. & Joyce, J. (2012).

Slide24

Characterization- Hydropower

Slide25

Historical

flows

at Hit, Iraq 1937-73 vs 1974-98

Slide26

Characterisation- Irrigated Agriculture

Slide27

Satellite

wetland classification – 2000

Slide28

Case Southern Africa Development Community

Slide29

Southern African Development Community (SADC)

Slide30

4,885 MW

Developed

13,500 MW potential

Sources

:

WB 2009

Transboundary

Freshwater

Dispute

Database

2000

SIWI 2010, Paper 16

ORASECOM (verbal)

5,500 MW

Developed

39,000 MW potential

782 MW Developed 1000 MW Pump Storage potential

Hydropower capacity developed and potential of regional significance

Africa 63 Transboundary

basins

Slide31

Oil, gas & Coal

deposits

Slide32

Wind

energy

potential

Slide33

Solar

energy

potential

Slide34

Southern Africa Power Pool (SAPP) - Mechanism to drive

further power system & market integration

Slide35

Conclusions

Slide36

1. Policy cohesion in energy and water called for

Water is a central component in today’s and tomorrow’s energy mix

Water is critical for fuel production and power generation

Power is needed to manage water and supply it to consumersWorld energy consumption forecast to grow by 49 percent from 2007 to 2035Water scarcity and quality degradation due to multiple demandsReal issue in many part of the world

Water and energy policies are and have been developed in isolationUrgent need to break this trend (Europe´s World #21, Special Section on water)

Granit, J. (2012) Europe’s World Summer

2012

Slide37

2. Power planning tools need to assess all available energy and water resources at the appropriate scale

Energy assets such as HEP, oil, coal,

wind, solar, and bioenergy

are spatially distributed in all regions globallyWater (surface & ground) crosses boundariesPolitical & physical boundaries at local, national, & international levelsUpstream & downstream issues

The generation of RE electricity through e.g. hydropower and bioenergy provides a direct feedback loop to water managementHEP and other indigenous power sources provide future price security and reduces foreign exchange requirements for fuel purchases

Using tools such as SEA allows for a systematic, and comprehensive process of evaluating power program

developmentThe environmental effects and its alternatives Using the findings in publicly accountable decision-making

Climate change mitigation & adaptation

Granit, J., King, R. M. & Noël, R. (2011)

Slide38

3. Regional power market development improves efficiency and reliabilityStates

cooperate when the net benefits of cooperation are perceived to be greater than the net benefits of

non-cooperation

Grey et. al. 2009Electric power trade can transfer the benefits from transboundary water management to load centers supporting integration in a region

Southern African Power Pool (SAPP)Co-management of electricity networks in a market will get each country access to a larger set of cost-effective energy sources

Many countries already share electricity grids Eg. Nordic Power Market (NORDPOL);

Gulf Cooperation Council (GCC), Southern African Power Pool (SAPP) and the emerging East African Power Pool (EAPP); Mediterranean

power pool

Power and transbounday water cooperation offers a rationale for wider expansion supporting broader economic integration

Granit, J. &

Claassen

, M. (2013

)

Slide39

4. Large scale water storage has a key role to play in the nexus from a regional perspective

Large-scale

water storage supports economic development, builds water security and buffers against increasing rainfall

variabilityLarge potential still existsWell-designed water storage and hydropower systems can enhance both climate change adaptation and mitigationHEP is a renewable source of fuel for electric power generation that efficiently can enable other RE sources in a power system

Hydropower & pumped storage can support the deployment of other sources of Renewable Enegy (RE), peaking capacity

Environmental and social consequences at the local and regional levels need to be addressed up-front when developing water storageSee eg: World Bank Safeguard policies; WCD; Equator principles; UNEP Dams and Development; IHA Hydropower sustainability Assessment Protocol

Lindström, A., Granit, J. & Weinberg, J. (2012

)

Slide40

Further work

Slide41

Qualitative approach (light approach)Stakeholder driven dialogues threats and opportunties

E.g. Transboundary Waters Opportunity (TWO) analysis (SIWI 2008)

Scenario based approaches (Shell, 1972 -; SEI 2013, Sweden Green Growth)

Specialist reviewsQuantitative indicator based approachPublicly available data supported by country dataCountry surveys based on well-defined questionnaires

Describing the basin Identify key insecurities in the WEF nexus

Food & nutritionWater supply, flood and drought etc.Energy availability and accessEcosystem servicesS

takeholder dialogues to identify opportunities and barriers Cooperative analysis and next steps

Quantitative modelling approaches (comprehensive)

e.g

:

SEI integrated

Water Evaluation and Planning (WEAP)

and

Long Range Energy Alternatives System Planning (LEAP) Model (SEI 2012)

Hydro-economic modelling (SIWI 2012

)

Climate, Land use, Energy, and

Water Model (CLEW)

(KTH 2011)

Strategic Environmental Assessment (SEA) approaches: EU/Espoo Convention, World Bank (2007)Granit, J., Fogde, M., Hoff, H., Joyce, J., Karlberg, L., Kuylenstierna, J. and Rosemarin, A. (2013)

Methodology approaches- assessing the nexus in a continuum

Slide42

Thanks to Andreas Lindström, Marius

Claassen

, Kevin

Rosner,

Charles Heap, David Purkey and many more