/
City of Mansfield City of Mansfield

City of Mansfield - PDF document

willow
willow . @willow
Follow
350 views
Uploaded On 2022-08-27

City of Mansfield - PPT Presentation

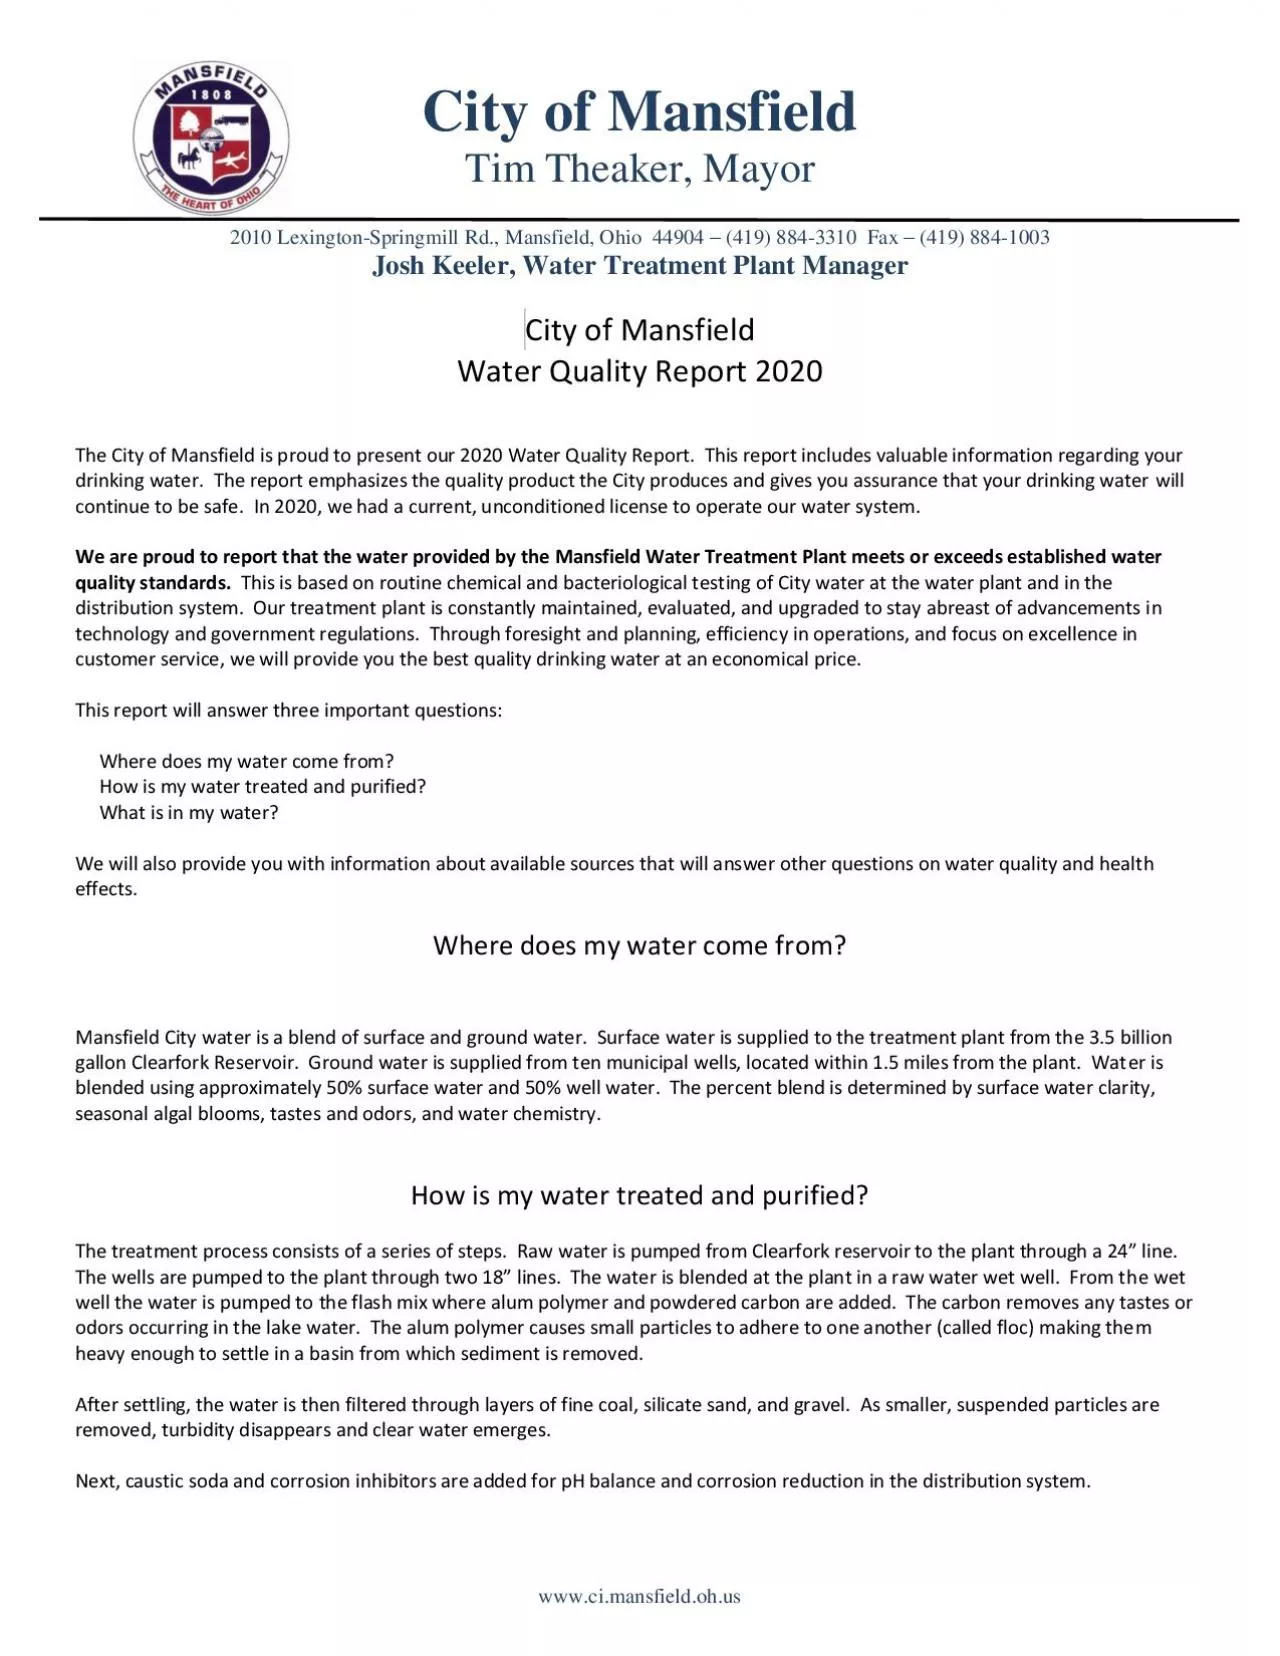
Tim Theaker Mayor 2010 Lexington Springmill Rd Mansfield Ohio 44904 419 884 3310 Fax 419 884 1003 Josh Keeler Water Treatment Plant Manager wwwcimansfieldohus City of M ID: 942440

drinking water level contaminants water drinking contaminants level 2020 mansfield plant contaminant treatment system city lead quality health report

Share:

Link:

Embed:

Download Presentation from below link

Download Pdf The PPT/PDF document "City of Mansfield" is the property of its rightful owner. Permission is granted to download and print the materials on this web site for personal, non-commercial use only, and to display it on your personal computer provided you do not modify the materials and that you retain all copyright notices contained in the materials. By downloading content from our website, you accept the terms of this agreement.


Presentation Transcript

City of Mansfield Tim Theaker, Mayor 2010 Lexington - Springmill Rd., Mansfield, Ohio 44904 – (419) 884 - 3310 Fax – (419) 884 - 1003 Josh Keeler , Water Treatment Plant Manager www.ci.mansfield.oh.us City of Mansfield Water Quality Report 20 20 The City of Mansfield is proud to present our 20 20 Water Quality Report. This report includes valuable information regarding your drinking water. The report emphasizes the quality product the City produces and gives you assurance that your drinking water will continue to be safe. In 20 20 , we had a curr ent, unconditioned license to operate our water system. We are proud to report that the water provided by the Mansfield Water Treatment Plant meets or exceeds established water quality standards. This is based on routine chemical and bacteriological test ing of City water at the water plant and in the distribution system. Our treatment plant is constantly maintained, evaluated, and upgraded to stay abreast of advancements i n technology and government regulations. Through foresight and planning, efficienc y in operations, and focus on excellence in customer service, we will provide you the best quality drinking water at an economical price. This report will answer three important questions: Where does my water come from? How is my water treated and purified? What is in my water? We will also provide you with information about available sources that will answer other questions on water quality and healt h effects. Where does my water come from? Mansfield City water is a blend of surface and ground water. Surface water is supplied to the treatment plant from the 3.5 billion gallon Clearfork Reservoir. Ground water is supplied from ten municipal wells, located within 1.5 miles from the plant. Wat er is blended using approximately 50% surface water and 50% well water. The percent blend is determined by surface water clarity, seasonal algal blooms, tastes and odors , and water chemistry. How is my water treated and purified? The treatment process consists of a series of steps. Raw water is pumped from Clearfork reservoir to the plant through a 24” line. The wells are pumped to the plant through two 18” lines. The water is blended at the plant in a raw water wet well. From th e wet well the water is pumped to the flash mix where alum polymer and powdered carbon are added. The carbon removes any tastes or odors occurring in the lake water. The alum polymer causes small particles to adhere to one another (called floc) making the m heavy enough to settle in a ba sin from which sediment is removed. After settling, the water is then filtered through layers of fine coal, silicate sand, and gravel. As smaller, suspended par ticles are removed, turbidity disappears and clear water emerges. Next, caustic soda and corr osion inhibitors are added for pH balance and corrosion reduction in the distribution system. 2 Finally, as a precaution against any bacteria that might remain, chlorine is added before water flows to sanitized, undergrou nd storage rese

rvoirs, water towers, and into your homes and businesses. We carefully monitor the amount of chlorine added, trying to provide the lowest quantity necessary to protect the safety of your water at the furthest distance from the plant without compromising taste. Substances Expected to be in Drinking Water Drinking water, including bottled water, may reasonably be expected to contain at least small amounts of some contaminants . The presence of contaminants does not necessarily indicate that water poses a health risk. In ord er to ensure that tap water is safe to drink, EPA prescribes regulations which limit the amount of certain contaminants in water provided by public water systems. FDA regulations establish limits of contaminants in bottled water which must provide the sam e protection for public health. More information about contaminants and potential health effects can be obtained by calling the Environmental Protection Agency’s Safe Drinking Water Hotline (1 - 800 - 426 - 4791). The sources of drinking water (both tap and bo ttled water) include rivers, lakes, streams, ponds, reservoirs, springs, and wells. As water travels over the surface of the land or through the ground, it dissolves naturally - occurring minerals, and, in some cases, radioactive material, and can pick up s ubstances resulting from the presence of animals or from human activity. Contaminants that may be present in source water include: (A) Microbial contaminants, such as viruses and bacteria, which may come from sewage treatment plants, septic systems, agricultural livestock operations, and wildlife. (B) Inorganic contaminants, such as salts and metals, which can be naturally - occurring or result from urban storm water runoff, industrial or domestic wastewater discharges, oil and gas production, mining, or fa rming. (C) Pesticides and herbicides, which may come from a variety of sources such as agriculture, urban storm water runoff, and residential uses. (D) Organic chemical contaminants, including synthetic and volatile organic chemicals, which are by - products of indu strial processes and petroleum production, and can, also come from gas stations, urban storm water runoff and septic systems. (E) Radioactive contaminants, which can be naturally occurring or be the result of oil and gas production and mining activities. Surf ace water sources, such as rivers and reservoirs, are more susceptible to contamination than ground water sources. Mansfield utilizes additional drinking water treatment techniques due to the potential for contamination from agricultural, residential , and commercial land uses upstream from the Clearfork Reservoir. For over 50 years, the Mansfield public water system has effecti vely treated this water to meet drinking water quality standards. In 2003, Ohio EPA completed a Source Water Area Protection Repo rt (SWAP) and Vulnerability Assessment for the Clearfork Reservoir (surface water) and wells (ground water). The susceptibility analyses from that report states that because Mansfie ld’s drinking water is a blend between the surface water and ground water, the water s

ystem as a whole is considered to be highly susceptible to contamination. By their nature, surface waters are easily accessible and can be readily contaminated by chemi cals and pathogens, with relatively short travel times from a source to the intake. The Glacial wellfields are also considered to have a high susceptibility to contamination because of the presence of a relatively thin protective layer of clay overlying the aqui fer, the shallow depth (less than 30 feet below the ground surface) o f the aquifer, and the presence of significant potential contaminant sources in the protection area. This susceptibility means that under currently existing conditions, the likelihood of the gla cial aquifer becoming contaminated is relatively high. The li kelihood can be minimized by implementing appropriate protective measures. The Bedrock wellfields are considered to have a moderate susceptibility to contamination because of the presence of moderately th ick protective layer of clay overlying the aquifer, and no evidence to suggest that ground water has been impacted by any significant levels of chemical contaminants from human activities. This susceptibility means that under currently existing conditions, t he likelihood of the bedrock aquifer becoming co ntaminated is moderate. This likelihood can be minimized by implementing appropriate protective measures. The susceptibility was determined by using local and regional information to best define the geologic setting of the wells. If additional informatio n becomes available, Ohio EPA will reevaluate the susceptibility. While the source water for the City of Mansfield Public Water System is considered susceptible to contamination, historically, the City of Mansfield Public Water System has effectively treat ed this source water to meet drinking water quality standards . If you are interested in a copy of the SWAP please contact Josh Keeler at 419 - 755 - 9830 . 3 Some people may be more vulnerable to contaminants in drinking water than the general population. Immuno - compromised persons such as persons with cancer undergoing chemotherapy, persons who have undergone organ transplants, people with HIV/AIDS or other immune system disorders, some elderly, and infants can be particularly at risk from infections. These peop le should seek advice about drinking water from their health care providers. EPA/CDC guidelines on appropriate means to lessen the risk of infection by Cryptosporidium, Giardia, and other microbial contaminants are available from the Safe Drinking Water Ho tline (1 - 800 - 426 - 4791). I mportant Terms and Units in your Water Quality Table Definitions of some of the terms contained in the data table and within this report. Maximum Contaminant Level (MCL) : The highest level of a contaminant that is allowed in drinking water. MCLs are se t as close to the MCLGs as feasible using the best available treatment technology. Maximum Contaminant Level Goal (MCLG) : The level of a contaminant in drinking water below which there is no known or expected risk to health. MCLGs allow for a margin of safety. Maximum Residual

Disinfectant Level Goal (MRDLG) : The level of drinking water disinfectant below which there is no known or expected risk to health. MRLDG’s do not reflect the benefits of the use of disinfectants to control microbial contaminants . Maximum Residual Disinfectant Level (MRDL): The highest level of disinfectant allowed in drinking water. There is convincing evidence that addition of a disinfectant is necessary for control of microbial contaminants. PARTS per MILLION (ppm) or Milligrams per Liter (mg/l) are units of measure for a concentration of a contaminant. A part per million corresponds to a second in a little over 11.5 days. PARTS per BILLION (ppb) or Micrograms per Liter (ug/l) are units of measure for concent ration of a contaminant. A part per billion corresponds to one second in 31.7 years. PFAS : Per - and polyfluoroalkyl substances (PFAS) are a group of man - made chemicals applied to many industrial, commercial and consumer products to make them waterproof, s tain resistant, or nonstick. PFAS are also used in products like cosmetics, fast food packaging, and a type of firefighting foam called aqueous film forming foam (AFFF) which are used mainly on large spills of flammable liquids, such as jet fuel. PFAS are classified as contaminants of emerging concern, meaning that research into the harm they may cause to human health is still ongoing. Detected Level : The highest level detected of a contaminant for comparison against the acceptance levels for each paramet er. These levels could be the highest single measurement, or an average of values depending on the contaminant. Action Level (AL) : The concentration of a contaminant, which, if exceeded, triggers treatment or other requirements that a water system must follow. Range: The lowest to the highest values for all samples tested for each contaminant. If only one sample is tested, or no range is required for this report, then no range is listed for that contaminant in the table. Treatment Technique (TT) : A re quired process intended to reduce the level of a contaminant in drinking water. NTU = Nephelometric Turbidity Units NA = Not Applicable = Less Than pCi/L = picocuries per liter PSWID # OH7002914 Lead in Drinking Water If present, elevated levels of lead can cause serious health problems, especially for pregnant women and y oung children. Lead in drinking water is primarily from materials and components associated with service lines and home plumbing. The Mansfield Wat er Treatment Plant is responsible for providing high quality drinking water, but cannot control the variety of materials used in plumbing components. When your water has been sitting for several hours, you can minimize the potential for lead exposure by flushing your tap for 30 seconds to 2 minutes before using water for drinking or cooking. If you are concer ned about lead in your water, you may wish to have your water tested. Information

on lead in drinking water, testing methods, and steps you can take to minimize exposure is available from the Safe Drinking Water Hotline (1 - 800 - 426 - 4791) or at http://www.epa.gov/safewater/lead . 4 Water Quality Data Table TABLE OF DETECTED CONTAMINANTS Contaminants (Units) MCLG MCL Level Found Range of Detections Violation Sample Year Typical Source of Contaminants Disinfectant and Disinfectant By - Products Total Chlorine (ppm)*** MRDLG = 4 MRDL = 4 1.91 1.50 - 2.43 No 2020 Water additive used to control microbes Haloacetic Acids (HAA5) (ppb) NA 60 48.4 18.5 - 55.3 No 2020 By - product of drinking water disinfection Total Trihalomethanes (TTHM) (ppb) NA 80 66.7 23.3 - 106.1 No 2020 By - product of drinking water disinfection Turbidity Turbidity (NTU) NA TT 0.09 0.03 - 0.63 No 2020 Soil Run - Off Turbidity (% of samples meeting standard)* NA TT 99% 98.9% - 100% No 2020 Soil Run - Off TOC** (mg/L) NA TT 1.74 1.50 - 2.49 No 2020 Naturally Present in the Environment Sythetic Organic Contaminants Atrazine (ppb) 3 3 0.15 0.15 No 2020 Runoff from herbicide used on row crops Inorganic Contaminants Fluoride (ppm) 4 4 0.17 NA No 2020 Erosion of natural deposits; Water additive which promotes strong teeth; Discharge from fertilizer and aluminum factories Barium (ppm) 2 2 0.073 NA No 2020 Discharge of drilling wastes; Discharge from metal refineries; Erosion of natural deposits Nitrite (ppm) 1 1 0.18 0.18 No 2020 Runoff from fertilizer use; leaching from septic tanks, sewage; Eros ion of natural deposits Nitrate (ppm) 10 10 0.80 0.15 - 0.80 No 2020 Run off from fertilizer use, Leaching from septic tanks, seweage; Erosion of natural deposits 5 Lead and Copper Contaminants (units) Action Level (AL) Individual Results over the AL 90% of test levels were less than Violation Sample Year Typical source of Contaminants Lead (ppb) 15 ppb NA 2.2 No 2020 Corrosion of household plumbing systems; erosion of natural deposits zero samples were found to have lead levels in excess of the lead action level of 15 ppb. Copper (ppm) 1.3 ppm NA 0.560 No 2020 Erosions of natural deposits; leaching from wood preservatives; Corrosions of household plumbing systems zero samples were found to have copper levels in excess of the copper action level of 1.3 ppm. *Turbidity is a measure of the cloudiness of water and is an indication of the effectiveness of our filtration system. The t urbidity limit set by the EPA is 0.30 NTU in 95 % of the daily samples and shall not exceed 1.0 NTU at any time. As reported above the highest recorded turbidity at the Mansfield Water Treatment Plant in 20 20 was 0.63 NTU and the lowest monthly percentage of samples meeting the turbidity limits was 9 8.9 %. **The value reported under “DETECTED LEVEL” for Total Organic Carbon (TOC) is the lowest ratio between the percentage of TOC actuall

y removed to the percentage of TOC required removed. A value of greater than 1.0 indicates the water system is in comp liance with TOC removal requirements. A value of less than 1.0 indicates a violatio n of the TOC removal requirements. ***For total chlorine, the MRDL is 4.0 mg/l. Compliance is based on the running annual average of samples taken in the distr ibution system and computed quarterly. If the average of the quarterly averages covering any consecutive four - quarter period exceeds the MRDL, the system is in violation and must notify the public. In 2020, our PWS was sampled as part of the State of Ohio’s Drinking Water Per - and Polyfluoroalkyl Substances (PFAS) Sampling Initiative. Six PFAS compounds were sampled, and none were detected in our finished drinking water. For more information about PFAS, please visit pfas.ohio.gov. 2020 Violations Please share the information from this table with other people who drink this water, especially th ose who may have not received this notice directly (those in apartments, nursing homes, schools, businesses, etc.) You can do this by posting the notice i n a public place or distributing copies by hand or mail. Monitoring Violation Explanation Length Steps taken to Correct the Violation Health Effect Language Failure to monitor On May 23 2020, there was a boil advisory issued in the City, and an incorrect number of representative samples were collected. 18 sample taps were affected, and any shut down affecting 16 - 1000 taps should have 2 coliform bacteria samples collected. Only 1 sample was collecte d due to a miscommunication internally. 1 day We implemented internal safeguards to pre vent this from happening again. Total Coliforms are indicator organisms used to determine possibility of the presence of E. Coli. There is nothing you need to do at this time. You do not need to boil your water or take other corrective actions. General guidelines on ways to lessen risk of infection by microbes are available from the EPA Safe Drinking Water Hotline at 1 - 800 - 426 - 4791 6 How will I know if there is a problem with my drinking water? If the amount of a contaminant exceeds a predetermined safe level in your drinking water, (MCL, action level, etc.), the Mans field Water Treatment Plant will notify you by newspaper, radio, TV or other means within 24 hours. With the notification you will be instructed on what appropriate actions you can take to protect your family’s health. Public Participation You are invited to participate in our public forum and voice your concerns about your drinking water. The City of Mansfield Council meetings are held on the first and third Tuesday of the month at 7:00 pm on the third floor of the City Municipal Building located at 30 North Diamond Street. Questions? Should you have any questions regarding this report or your drinking water, please call Josh Keeler , Plant Manager, with the Ma nsfield Water Treatment Plant at (419) 884 - 3310. Our address is 2010 S. Lexington – Springmill Rd. Mansfield OH 44904. We will be pleased to answer your quest