/
Value  Momentum Value  Momentum

Value Momentum - PDF document

willow
willow . @willow
Follow
346 views
Uploaded On 2021-06-19

Value Momentum - PPT Presentation

VAMO Cambria ETF FIRST QUARTER March 31 2021 Strategy Overview 
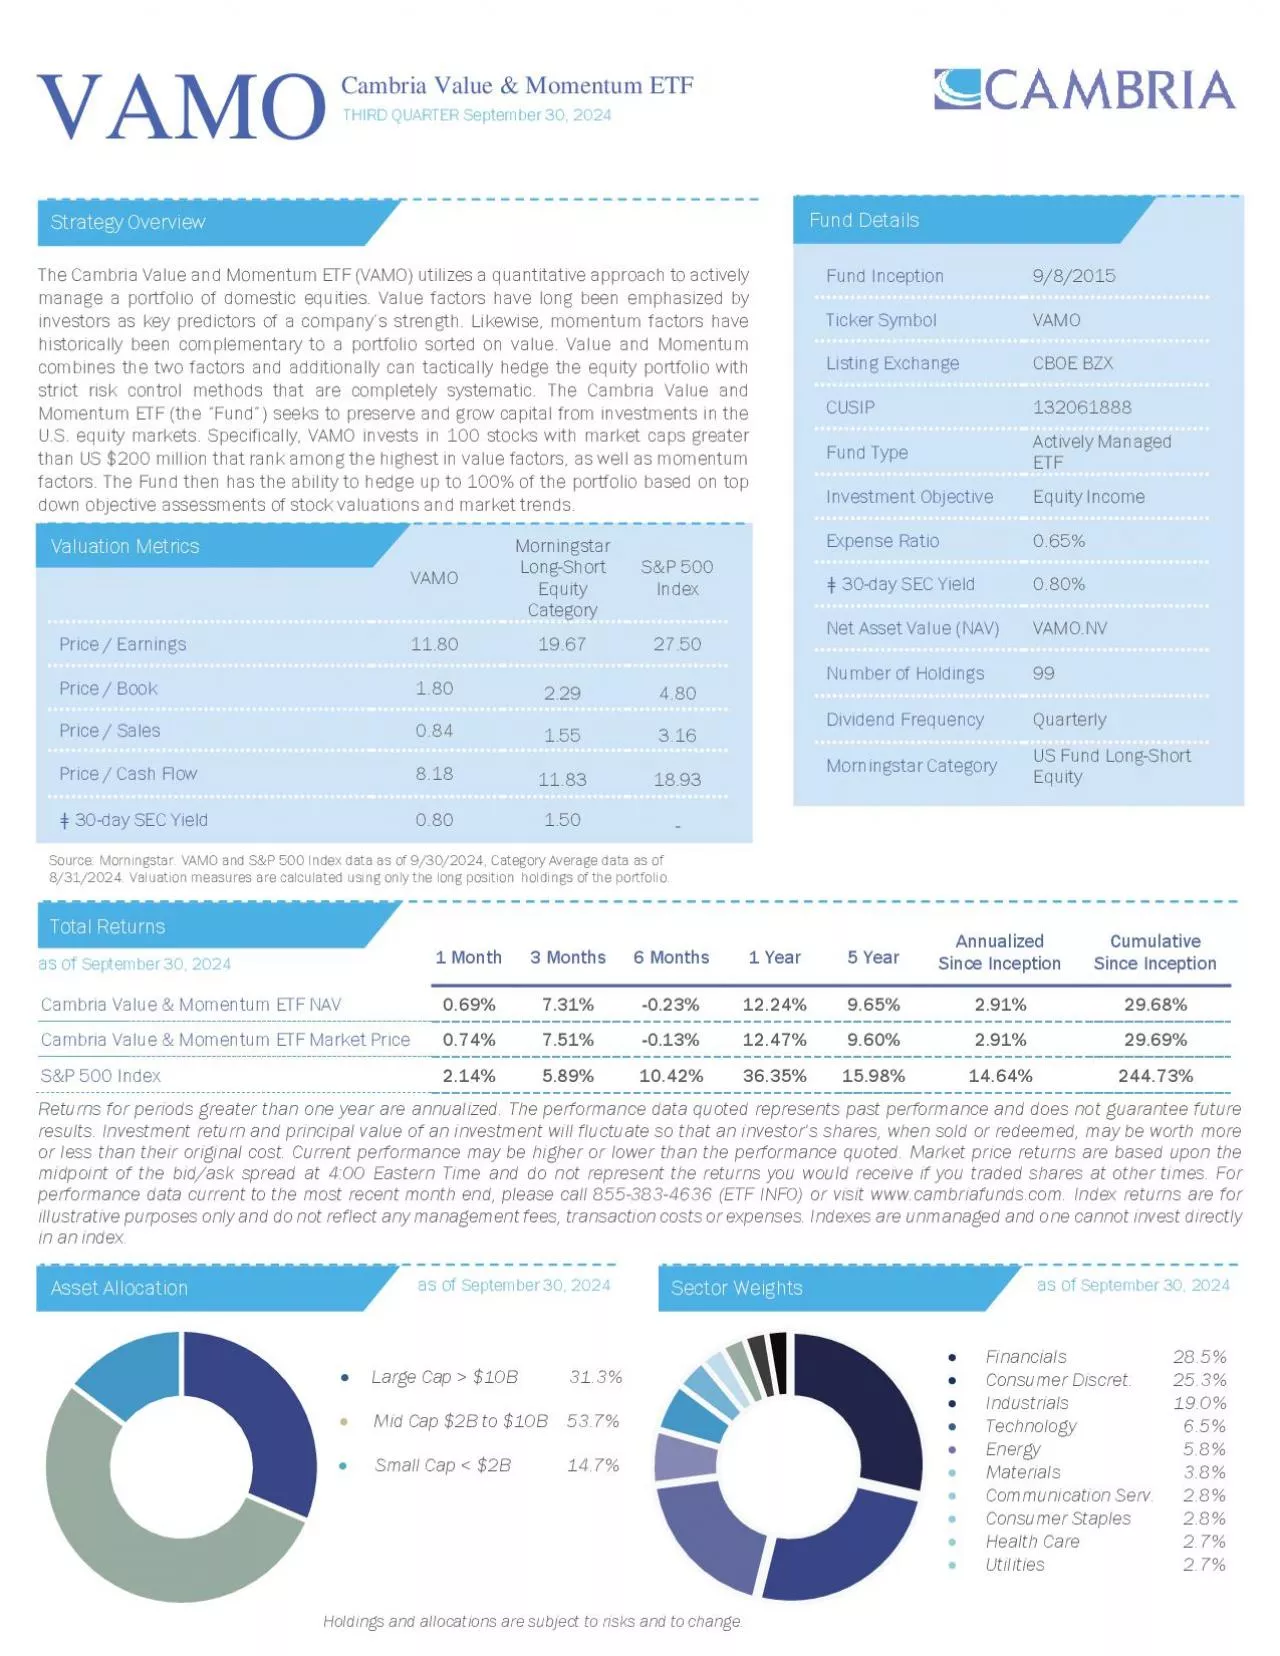
The Cambria Value and Momentum ETF BATS VAMO utilizes a quantitative approach to actively manage a portfolio of domestic equities ID: 845482

price cambria investment etf cambria price etf investment fund bats ratio market risk momentum management performance company vamo global

Share:

Link:

Embed:

Download Presentation from below link

Download Pdf The PPT/PDF document "Value Momentum" is the property of its rightful owner. Permission is granted to download and print the materials on this web site for personal, non-commercial use only, and to display it on your personal computer provided you do not modify the materials and that you retain all copyright notices contained in the materials. By downloading content from our website, you accept the terms of this agreement.


Presentation Transcript

1 VAMO Cambria Value & Momentum ETF
VAMO Cambria Value & Momentum ETF FIRST QUARTER March 31, 2021 Strategy Overview The Cambria Value and Momentum ETF ( BATS : VAMO) utilizes a quantitative approach to actively manage a portfolio of domestic equities. Value factors have long been emphasized by investors as key predictors of a company’s strength. Likewise, momentum factors have historically been complementary to a portfolio sorted on value. Value and Momentum combines the two factors and additionally can tactically hedge the equity portfolio with strict risk control methods that are completely systematic. The Cambria Value and Momentum ETF (the “Fund”) seeks to p reserve and grow capital from investments in the U.S. equity markets. Specifically, VAMO invests in 100 stocks with market caps greater than US $200 million that rank among the highest in value factors, as well as momentum factors. The Fund then has the ab ility to hedge up to 100% of the portfolio based on top down objective assessments of stock valuations and market trends. Total Returns as of March 31, 2021 Returns for periods greater than one year are annualized. The performance data quoted represents past performance and does no t guarantee future results. Investment return and principal value of an investment will fluctuate so that an investor’s shares, when sold or redeemed, may be worth more or less than their original cost. Current performance may be higher or lower than the performance quoted. Market price return s are based upon the midpoint of the bid/ask spread at 4:00 Eastern Time and do not represent the returns you would receive if you traded shares at other times. For performance data current to the most recent month end, please call 855 - 383 - 4636 (ETF INFO) or visit www.cambriafunds.com. Index returns are for illustrative purposes only and do not reflect any management fees, transaction costs or expenses. Indexes are unmanaged and o ne cannot invest di rectly in an index. as of March 31, 2021 as of March 31, 2021 Asset Allocation Sector Weights Holdings and allocations are subject to risks and to change. Fund Inception 9/8/2015 Ticker Symbol VAMO Listing Exchange CBOE BZX CUSIP 132061 888 Fund Type Actively Managed ETF Investment Objective Equity Income Expense Ratio 0.63% ǂ 30 - day SEC Yield 0. 13 % Indicative Value VAMO .IV Net Asset Value (NAV) VAMO .NV Number of Holdings 98 Dividend Frequency Quarterly Morningstar Category US Fund Long - Short Equity Fund Details • Large Ca�p $5B 14.2 % • Mid Cap $1 to 5B 60.9 % • Small Cap $1B 24.9 % • Consumer Discret. 28.6 % • Industrials 16.7 % • Energy 16.3 % • Financials 15.4 % • Materials 7.7 % • Technology 5.7 % • Health Care 4. 3 % • Consumer Staples 3.6 % • Communication Serv. 1.6 % VAMO Category Price / Earnings 12.25 23.86 Price / Book 1.6 6 3. 42 Price / Sales 0.47 2.20 Price / Cash Flow 5. 35 13.87 Price / Free Cash Flow 8.36 18.81 ǂ 30 - day SEC Yield 0. 13 - Valuation Metrics 1 Month 3 Months 6 Months 1 Year 5 Year Annualized Since Inception Cumulative Since Inception Cambria Value & Momentum ETF NAV 4.08 % 20.21 % 30.38 % 40.05 % 1.00 % - 0.51 % - 2.80 % Cambria Value & Momentum ETF Market Price 4.02 % 20.11 % 30.32 % 46.50 % 1.02 % - 0.47 % - 2.61 % S&P 500 Index 4.38 % 6.18 % 19.07 % 56.35 % 16.29 % 15. 72 % 125.26 % About Cambria Investment Management, LP Cambria Investment Management, LP, based in Los Angeles, California, is a SEC registered investment management firm employing a disciplined multi - asset, global quantitative research process. Cambria provides investment management services through a number of portfolio strategies to high net worth individuals and institutions through exchange traded funds, separately managed accounts and private funds. Cambria is also the investment manager of the Cambria Shareholder Yield ETF (BATS: SYLD), the Cambria Global Value ETF ( BATS : GVAL), the Cambria Foreign Shareholder Yield ETF (BATS: FYLD), the Cambria Global Momentum ETF ( BATS : GMOM), the Cambria Global Asset Allocation ETF (BATS: GAA), Cambria Emerging Shareholder Yield ETF (BATS: EYLD) , the Cambria Tail Risk ETF (BATS: TAIL) , the Cambria Trinity ETF (BATS: TRTY) , the Cambria Cannabis ETF (BATS: TOKE) , t he Cambria Global Real Estate ETF (BATS: BLDG) , and the C ambria Global Tail Risk ETF ( BATS: FAIL) . Cambria believes that any single style or approach that relies on subjective methods can be inconsistent over time, may bias the investment process, and potentially hinder performance. Global diversification through asset allocation, coupled with prudent risk management, is the foundation of Cambria’s investment philosophy. Cambria Investment Management,

2 LP 2321 Rosecrans Avenue, Suite
LP 2321 Rosecrans Avenue, Suite 3225 El Segundo, CA 90245 (310) 683 - 5500 www.cambriafunds.com To determine if this Fund is an appropriate investment for you, carefully consider the Fund’s investment objectives, risk factors, charges and expense before investing. This and other information can be found in the Fund’s full and summary prospectus which may be obtained by calling 855 - 383 - 4636 (ETF INFO) or visiting our website at www.cambriafunds.com . Read the prospectus carefully before investing or sending money. The Cambria ETFs are distributed by ALPS Distributors Inc., 1290 Broadway, Suite 1000, Denver, CO 80203 , which is not affiliated with Cambria Investment Management, LP, the Investment Adviser for the Fund. Shares are bought and sold at market price (closing price) not net asset value (NAV) are not individually redeemed from the F und. Market price returns ar e based on the midpoint of the bid/ask spread at 4:00 pm Eastern Time (when NAV is normally determined), and do not represent the return you would receive if you traded at other times. Buying and selling shares will result in brokerage commissions. Brokerage commissions will reduce returns. There is no guarantee the fund will achieve its investing goal. Investing involves risk, including the possible loss of princ ipal. Investments in smaller companies typically exhibit higher volatility. The fund is actively managed using proprietary strategies and processes. There can be no guarantee that these strategies and processes will produce the intended results and no guarantee that the fund will achieve its investment o bjective. With short sales , you risk paying more for a security than you received from its sale. Short sale losses are potentially unlimited and expenses involved with the shorting strategy may negatively impact the performance of the fund. The Fund may hedge up to 100% of the valu e of the Fund's long portfolio. The Fund may use derivatives to attempt to effectuate such hedging during times when the advisor believes that the U.S. equity market is overvalued from a valuation standpoint, or models identify unfavorab le trends and momen tum in the U.S. equity market. The primary risk of derivative instruments is that changes in the market value of securities held by the fund and of the derivative instruments relating to those securities may not be proportionate. Derivatives are also subje ct to illiquidity and counterparty risk. Derivatives are often more volatile than other investments and may magnify the Fund’s gains or losses. There is no guarantee dividends will be paid. Diversification may not protect against market loss. Indicative value (iNAV) is a measure of the intraday net asset value (NAV) of an investment. It is reported approximately every 15 seconds giv ing investors a measure of the value of the investment throughout the day The S&P 500 Index is an index of 500 st ocks chosen for market size, liquidity and industry grouping, among other factors. The S&P 500 is designed to be a leading indicator of U.S. equities and is meant to reflect the risk/return characteristics of the large cap universe. ǂ 30 - day SEC Yield is b ased on the most recent 30 - day period and reflects the investment income earned after deducting a fund’s expenses for the period. The price/earnings ratio (P/E Ratio) is the ratio of a company's stock price to the company's per share earnings. The price/book ratio (P/B Ratio) is the ratio of a company's stock price to the company's book value . The price/ sales ratio (P/S Ratio) is the ratio of a company's stock price to the company's revenue . The price/ free cash flow ratio (P/FCF Ratio) is the ratio of a company's stock price to the company's per share free cash flow . Forward - looking based on historical data, as of 0 9 / 30 /20 20 . Source: Morningstar. Style and Market Cap Br eakdown and Value and Growth Measures are calculated only using the long position holdings of the portfolio. Th e valuation metrics table was compiled to provide a framework to analyze the characteristics of Cambria’s Value and Momentum ETF (BATS: VAMO ) relative to its category. The valuation data — at the time this report was written — reflects the fundamental data of Price/Earnings ratios, Price/B ook ratios, Price/Sales ratios, Price/Cash Flow ratios, and dividend yield so that investors can compare the ETFs across the same metrics . All information is provided strictly for educational and illustrative purposes only. © 20 2 1 Morningstar, Inc. All Rig hts Reserved. The information contained herein: (1) is proprietary to Morningstar and/or its content providers; (2) may not be copied or distributed; and (3) is not warranted to be accurate, complete or timely. Neither Morningstar nor its conten t providers are responsible for any damages or losses arising from any use of this information. Past performance is no guarantee of future results. Not FDIC Insured. May Lose Value. Not Bank Guaranteed. CBM 000 3 8