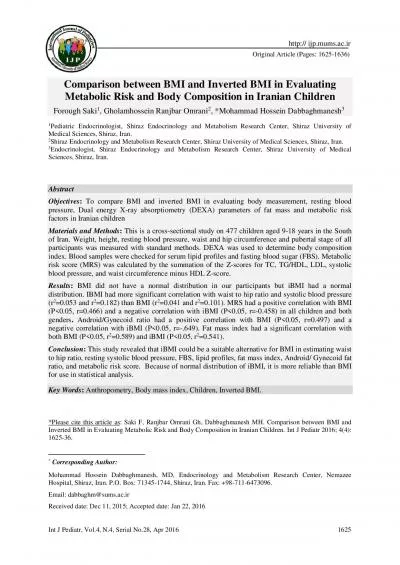
/
1 BMI Waist W/H ratio Skinfold thickness 1 BMI Waist W/H ratio Skinfold thickness

1 BMI Waist W/H ratio Skinfold thickness - PowerPoint Presentation

wilson
wilson . @wilson
Follow
66 views
Uploaded On 2024-01-13

1 BMI Waist W/H ratio Skinfold thickness - PPT Presentation

Anthropometric indices 2 Densitometry Total body water TBW Dual energy Xray absorptiometry Bioelectrical impedance Bioimpedance Measurements of body composition 3 Computed tomography CT ID: 1040418

fat body mass bmi body fat bmi mass weight waist volume water circumference risk amp ffm obesity high impedance

Share:

Link:

Embed:

Download Presentation from below link

Download Presentation The PPT/PDF document "1 BMI Waist W/H ratio Skinfold thickness" is the property of its rightful owner. Permission is granted to download and print the materials on this web site for personal, non-commercial use only, and to display it on your personal computer provided you do not modify the materials and that you retain all copyright notices contained in the materials. By downloading content from our website, you accept the terms of this agreement.


Presentation Transcript

1. 1

2. BMIWaistW/H ratioSkinfold thicknessAnthropometric indices2

3. DensitometryTotal body water (TBW)Dual energy X-ray absorptiometryBioelectrical impedance (Bioimpedance)Measurements of body composition3

4. Computed tomography (CT) imagingMagnetic resonance (MR) imagingMeasurements of fat distribution4

5. Measurements of body fat that are expensive and require special equipment and highly trained personnel include:Measurements that are simple, cheap and appropriate for routine use include:Underwater weighingBioelectrical impedanceComputerized topographyBMIwaist circumferenceHip circumferenceWaist-to-hip ratioSkin fold thickness5

6. HeightWeightBody Mass Index (BMI) [weight/height]2Kg/m2(lb/in)2 x 703Distribution of body fatWaist-hip ratio (WHR)Waist circumferenceAnthropometrics in Obesity6

7. Objective with high specificity & sensitivityReadings are numerical & gradable on standard growth chartsReadings are reproducible.Non-expensive & need minimal trainingAdvantages of anthropometry7

8. Inter-observers errors in measurementProblems with reference standards, i.e. local versus international standards.Arbitrary statistical cut-off levels for what considered as abnormal values. Limitations of Anthropometry8

9. What is BMI?Express weight adjusted for heightBody mass index (BMI) = weight (kg)/height (m)29

10. Adapted from: Gallagher et al. Am J Clin Nutr 2000;72:694.Body Mass Index (kg/m2)0102030405060700102030405060Body Fat (%)WomenMenRelationship Between BMI and Percent Body Fat in Men and WomenAgeGenderRace10

11. BMI and Body fat%11

12. low-cost and easy to use for health professionals for assessing individuals Reliablecommonly used to determine desirable body weights and allows people to compare their own weight status to that of the general population Advantages of using BMI12

13. Correlates well with the amount of body fat as measured by more complex techniquesPredicts dangers associated with obesity; as BMI increases the risk for diseases increasesA useful screening tool to use at the population level and, because it is universally accepted, BMI reference data is available for many different populationsCan be used for selection of therapyAdvantages of using BMI13

14. It does not distinguish the accumulation of muscle (lean body mass) from the accumulation of adipose tissue (body fat)It varies with age and sex in those <18 yearsDifferent cut points in different ethnic groupsDisadvantages of BMI14

15. Weight loss induced by exercise is associated with smaller losses of lean tissue (which is denser than fat), compared with dietary restriction alone. Thus, weight and BMI may change little during an exercise program, even though significant loss of fat may occurDisadvantages of BMI15

16. 16

17. Classification BMI (kg/m2) Risk Underweight <18.5 Increased Normal 18.5–24.9 Normal Overweight 25.0–29.9 Increased Obese I 30.0–34.9 High II 35.0–39.9 Very high III 40 Extremely high Additional risks: Large waist circumference (men >40 in; women >35 in)5 kg or more weight gain since age 18–20 yPoor aerobic fitnessSpecific races and ethnic groups BMI-Associated Disease RiskClinical Guidelines on the Identification, Evaluation, and Treatment of Overweight and Obesity in Adults—The Evidence Report. Obes Res 1998;6(suppl 2).17

18. 1995 WHO expert committee reportFor adults, the Expert Committee proposed classification of BMI with the cut-off points 25, 30 and 40…This classification is based principally on the association between BMI and mortality.BMI cut-points of 25 (overweight) and 30 (obesity) recommended by expert committees18

19. Relation between mortality and BMIData from Lew EA: Mortality and weight: insured lives and the American Cancer Society studies. Ann Intern Med 103:1024-1029, 1985.19

20. AndroidGynoid20

21. What is the power of waist circumference to predict adverse cardio-metabolic outcomes? How does the predictive power of waist circumference compare with that of BMI? Importance of fat distribution21

22. Health threat from abdominal obesity is largely due to intra-abdominal obesityAbdominalObesityDyslipidemiaHypertensionGlucose IntoleranceInsulin ResistanceIncreased Cardiometabolic RiskIntra-AbdominalAdiposityAdapted from Eckel et al 2005 22

23. Visceral Fat:The Critical Adipose DepotBack23

24. Immediately below the lowest rib At the narrowest waist1Midpoint between the lowest rib and the iliac crest2Immediately above the iliac crest3,4Waist CircumferenceMeasurement SitesAnthropometric Standardization Reference ManualWorld Health Organization (WHO)National Institutes of Health (NIH)National Health and Nutrition Examination Survey (NHANES) 24

25. How to Measure Waist CircumferencePlace a measuring tape, held parallel to the floor, around the patient’s abdomen at a designated level.The tape should fit snugly around the waist without compressing the skinTake the measurement at the end of a normal expirationAdapted from Grundy SM, et al. Circulation. 2005;112:2735-2752.25

26. BMI and WC are highly correlated ,typically with r values in range of 0.85-0.9526

27. Visceral vs subcutaneous adiposity CT scans matched for BMI and total body fat Després J-P. Eur Heart J Suppl. 2006;8(suppl B):B4-12.Subcutaneous (sc) obesityFat mass: 19.8 kgVFA: 96 cm2Visceral obesityFat mass: 19.8 kgVFA: 155 cm2White = VFA Black = sc fatSimilar BMI27

28. WC cut points Lean MEJ, Han TS, Morrison CE. Waist circumference as a measure for indicating need for weight management. BMJ 1995;311:158–61.Randomly recruited 904 men and 1014 women, aged 25 to 74 years, from the general population of north Glasgow between January and August 1992, excluding only those who were chair bound.28

29. BMI asGold StandardUsing in ATPIII & EGIR29

30. It has been proposed that waist measurement alone can be used to assess obesity, and two levels of risk have been identified MALES FEMALE LEVEL 1 > 94cm > 80cm LEVEL2 > 102cm > 88cmWaist circumference30

31. Level 1 is the maximum acceptable waist circumference irrespective of the adult age and there should be no further weight gain.Level 2 denotes obesity and requires weight management to reduce the risk of type 2 diabetes & CVS complications.Waist circumference/231

32. 32

33. Population Group Waist Circumference (Cm) Men WomenUSA (NCEP ATP III) >102 >88European >94 >80South Asian/ >90 >80ChineseJapanese >90 >85Metabolic Syndrome: Refined Criteria (IDF)33

34. Cohort Studies to determine WC cutoffBrazil HTN ----- M:87 F:80 2009Australia CVD mortality 20-69 M:96 F:80 2007Japan CVD ≥ 40 M:90 F:80 2009Thailand CHD 35-59 M:82 2007China* CVD risk 18-93 M:83-88 F:76 2007Iran CVD ≥ 40 M:94.5 F:94.5 2009CountryOutcome AgeCut offP.Y.34

35. Archives of Iranian Medicine, Volume 13, Number 3, May 201035

36. 36

37. 37

38. Is measured at the point of greatest circumference around hips & buttocks to the nearest 0.5 cm.The subject should be standing and the measurer should squat beside him.Both measurement should taken with a flexible, non-stretchable tape in close contact with the skin, but without indenting the soft tissue. Hip Circumference 38

39. High risk WHR= >0.80 for females & >0.90 for males i.e. waist measurement >80% of hip measurement for women and >95% for men indicates central (upper body) obesity and is considered high risk for diabetes & CVS disorders.A WHR below these cut-off levels is considered low risk. Interpretation of WHR39

40. 40

41. 41

42. Median 6.6-years changes in waist circumference42

43. Median 6.6-years changes in abdominal obesity43

44. A skinfold thickness (SFT) is the double thickness of the epidermis, underlying fascia and subcutaneous fat, when the tissues are pinched between measuring calipersMeasurements are usually made at four sites: biceps, triceps, subscapular and suprailiac.Using sex- and age-dependent, population-based linear regression equations, the sum of these values (in mm) can be used to estimate total body fatSkinfold Thickness44

45. Measures double thickness of skin and subcutaneous fatAdvantages:inexpensivefastportablelarge databaseSkinfold Thickness45

46. 46

47. 47

48. 48

49. 49

50. Major limitation is considerable observer errorThis limits the usefulness of this technique outside research environmentsSkinfold thickness affected by factors other than amount of fatexercise increases skin thicknessdehydration reduces skin thicknessedema increases skin thicknessdermatitis increases skin thickness Poorly predicts visceral fatLimitations50

51. DensitometryTotal body water (TBW)Dual energy X-ray absorptiometryBioelectrical impedance (Bioimpedance)Measurements of body composition51

52. Advantages“Direct” assessment of body fatnessOverweight Overmuscled or overfatAthletesAssessing need for weight lossinadequate stores in patientsMonitor changesweight loss qualityeffect of medical therapyBody Composition Analysis vs. Body Weight Assessment52

53. Disadvantagesrelatively limited databaseall field methods are estimationsfalse assumptions in all field methodserrors by technicianslimited understanding by clientsBody Composition Analysis vs. Body Weight Assessment53

54. Fat Mass (FM)Fat free mass (FFM)Body composition (Two compartment)54

55. waterProtein Fat MineralsBody composition (Four compartment)55

56. Density is calculated as body mass/volume.Traditionally, density has been measured by directly measuring mass on weighing scales, and body volume by underwater weighing, using the basic principle of water displacementUnderwater weighing requires total submergence, and can therefore be both difficult and frighteningDensitometry56

57. Hydrodensitometry57

58. Measures body volume by air displacementactually measures pressure changes with injection of known volume of air into closed chamberLarge body volume displaces air volume in chamberresults in bigger increase in pressure with injection of known volume of airWhole Body Pethysmography58

59. Air displacement Plethysmograph59

60. Fat is essentially anhydrous and the FFM contains a known proportion of water It is therefore possible to estimate FFM if the total body water content is known, when fat mass can be calculated as the difference from body weightTotal body water is conveniently measured by the isotope dilution method. (deuterium dilution)TBW60

61. 61When the body’s density is known, and assuming the density of fat to be 0.9 kg/l and that of fat-free mass 1.1 kg/l, the percentage of body fat can be estimated using a standard equation

62. Dual-Energy X-ray Absorptiometry62

63. 63

64. “BIA provides a reliable estimate of total body water under most conditions.”“It can be a useful technique for body composition assessment in healthy individuals”Bioelectrical Impedance Analysis64

65. BIA measures impedance by body tissues to the flow of a small (<1mA) alternating electrical current (50kHz)Impedance is a function of:electrical resistance of tissueelectrical capacitance (storage) of tissue (reactance)Bioelectrical Impedance Analysis65

66. The body can be considered to be a series of cylinders.Resistance is proportional to the length of the cylinderResistance is inversely proportional to the cross-sectional areaBIA: basic theory66

67. Volume is equal to length of the cylinder times its areaTherefore, knowing the resistance and the length, one can calculate volume.Assuming that the current flows thru the path of least resistance (water) , then the volume determined is that of body water.BIA: basic theory67

68. Assume fat free mass has a constant proportion of water (about 73%)Then calculate fat free mass from body waterAssume BW = FFM + FMThen calculate fat mass and %body fatBIA: basic theory68

69. MalesFFM = -10.68 + 0.65H2/R + 0.26W + 0.02RFemalesFFM = -9.53 + 0.69H2/R + 0.17W + 0.02RWhere FFM = fat free mass (kg)H = height (cm)W = body weight (kg)R – resistance (ohms)% BF = 100 x (BW-FFM)/BWNHANES IIIBIA Equations69

70. DATAR = 520 ohmsBW = 170 lbs = 77.3 kgH = 70” = 178 cmCALCULATIONSFFM = -10.68+(0.65H2/R)+0.26W+0.02RFFM = -10.68+(0.65x1782/520)+0.26(77.3)+0.02(520)FFM = -10.6 + 39.6 + 20.1 + 10.4 = 59.5 kgFM = W – FFM = 77.3 – 59.5 = 17.8 kg%BF = (17.8/77.3)x100 = 23%BIA Calculations70

71. It shows good agreement with deuterium dilution, densitometry and DEXAIt is generally superior to skinfold thickness measurements, with within- and between-subject coefficients of variation of around 1–2% in determining body fat massAdvantages (costs , portable non-invasive, fast)BIA71

72. 72

73. Major types of BIA analyzers73

74. 74

75. 75

76. What is a ‘normal’ % body fat?ClassificationMalesFemalesUnhealthy range (too low)< 5%< 8%Acceptable range (lower end)6-15%9-23%Acceptable range (higher end)16-24%24-31%Unhealthy (too high)> 25%> 32%Nieman, 1999 (p195)

77. Computed tomography (CT) imagingMagnetic resonance (MR) imagingMeasurements of fat distribution77

78. 78

79. 79

80. 80

81. 81

82. 82

83. Thanks for your attention83