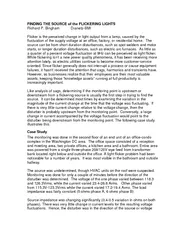
/
FINDING THE SOURCE of the FLICKERING LIGHTSRichard P. BinghamDranetz-BMIFlicker is the FINDING THE SOURCE of the FLICKERING LIGHTSRichard P. BinghamDranetz-BMIFlicker is the

FINDING THE SOURCE of the FLICKERING LIGHTSRichard P. BinghamDranetz-BMIFlicker is the - PDF document

yoshiko-marsland
yoshiko-marsland . @yoshiko-marsland
Follow
398 views
Uploaded On 2015-07-22

FINDING THE SOURCE of the FLICKERING LIGHTSRichard P. BinghamDranetz-BMIFlicker is the - PPT Presentation

supply side Since the monitoring was being done at the breaker panel thesource of the flicker was determined to be upstream or outside the buildingThe graph shows the two voltages in the top of t ID: 89728

supply side. Since the

Share:

Link:

Embed:

Download Presentation from below link

Download Pdf The PPT/PDF document "FINDING THE SOURCE of the FLICKERING LIG..." is the property of its rightful owner. Permission is granted to download and print the materials on this web site for personal, non-commercial use only, and to display it on your personal computer provided you do not modify the materials and that you retain all copyright notices contained in the materials. By downloading content from our website, you accept the terms of this agreement.


Presentation Transcript

FINDING THE SOURCE of the FLICKERING LIGHTSRichard P. BinghamDranetz-BMIFlicker is the perceived change in light output from a lamp, caused by thefluctuation of the supply voltage at an office, factory, or residential home. Thesource can be from short duration disturbances, such as spot welders and motorstarts, or longer duration disturbances, such as electric arc furnaces. As little asa quarter of a percent voltage fluctuation at 9Hz can be perceived as light flicker.While flickering isn’t a new power quality phenomena, it has been receiving moreattention lately, as electric utilities continue to become more customer-serviceoriented. Since flicker generally does not interrupt a process or cause equipmentfailures, it hasn't received the attention that sags, harmonics and transients have.However, as businesses realize that their employees are their most valuableassets, keeping those “knowledge assets” running at full productivity isincreasingly important.Like analysis of sags, determining if the monitoring point is upstream ordownstream from a flickering source is usually the first step in trying to find thesource. It can be determined most times by examining the variation in themagnitude of the current change at the time that the voltage was fluctuating. Ifthere is very little current change relative to the voltage change, then thedisturber is probably upstream from the monitoring point. Conversely, a largechange in current accompanied by the voltage fluctuation would point to thedisturber being downstream from the monitoring point. The following case studyillustrates this.Case StudyThe monitoring was done in the second floor of an end unit of an office-condocomplex in the Washington DC area. The office space consisted of a receptionand meeting area, two private offices, a kitchen area and a bathroom. Entire areawas powered from a single three-phase 208/120V wye feed from transformerbank located right below and outside the office. A light flicker problem had beennoticeable for a number of years. It was most visible in the bathroom and outsidehallway.The source was undetermined, though HVAC units on the roof were suspected.Monitoring was done for only a couple of minutes before the direction of thedisturber was determined. The voltage of the one phase varied between 118.3and 126.3Vrms, while the current varied 23.4-26.8 Arms. Other phase variedfrom 115.3V-123.3Vrms while the current varied 17.2-19.4 Arms. The loadimpedance was fairly constant (5 ohms phase A, 6 ohms phase B)Source impedance was changing significantly (0.4-0.5 variation in ohms on bothphases). There was very little change in current levels for the resulting voltagefluctuations. Hence, the disturber was in the direction of the source or voltage supply side. Since the monitoring was being done at the breaker panel, thesource of the flicker was determined to be upstream, or outside the building.The graph shows the two voltages in the top of the timeplot, and the currents inthe bottom of the same plot. Figure 2 - Timeplot of Voltage and Current.The waveforms of the voltage and current are shown below, with the voltagebeing the larger waveform. The variation in the voltage waveform is mostapparent in the bottom half of the picture. Figure 3. Voltage and Current Waveforms.