/
 Intrinsic Characteristics of Modified DDGS and Development of Effective Handling Strategies:  Intrinsic Characteristics of Modified DDGS and Development of Effective Handling Strategies:

Intrinsic Characteristics of Modified DDGS and Development of Effective Handling Strategies: - PowerPoint Presentation

yoshiko-marsland
yoshiko-marsland . @yoshiko-marsland
Follow
343 views
Uploaded On 2020-04-04

Intrinsic Characteristics of Modified DDGS and Development of Effective Handling Strategies: - PPT Presentation

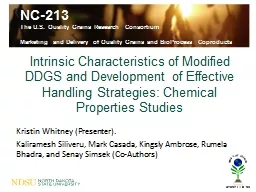
Kristin Whitney Presenter Kaliramesh Siliveru Mark Casada Kingsly Ambrose Rumela Bhadra and Senay Simsek CoAuthors Introduction Conversion of Corn to EtOH Introduction Distillers Dried Grains with ID: 775316

ddgs 030 amino fat ddgs 030 amino fat results difference oil significant humidity relative staining methods acid introduction lsd

Share:

Link:

Embed:

Download Presentation from below link

Download Presentation The PPT/PDF document " Intrinsic Characteristics of Modified D..." is the property of its rightful owner. Permission is granted to download and print the materials on this web site for personal, non-commercial use only, and to display it on your personal computer provided you do not modify the materials and that you retain all copyright notices contained in the materials. By downloading content from our website, you accept the terms of this agreement.


Presentation Transcript

Slide1

Intrinsic Characteristics of Modified DDGS and Development of Effective Handling Strategies: Chemical Properties Studies

Kristin Whitney (Presenter).

Kaliramesh

Siliveru, Mark Casada,

Kingsly

Ambrose, Rumela Bhadra, and Senay Simsek (Co-Authors)

Slide2

Introduction

Conversion of Corn to

EtOH

Slide3

Introduction

Distillers Dried Grains with Solubles (DDGS)coproduct from dry-grind corn to ethanol conversion

http://

andersonsgrain.com/

Slide4

Introduction

Volume produced

Vital importance for feed

Slide5

Introduction

DDGS composition

Essential amino acids

MineralsTrace unfermented starch

Slide6

Introduction

Non-fermentable componentWhole stillage (5-15% solids)Thin stillage (5-10% solids)Condensed distillers solubles (CDS) → syrupWet cake Mixed with syrupDrum dried

DDGS

Slide7

Introduction

Corn oil extraction from DDGS

Viable and lucrative option

2 extraction types

Extraction from thin stillage (30% oil removed)

After mixing syrup with wet cake before drying

“back end” extraction

Increases profit and sustainability

Slide8

Introduction

Nutritional Value

Digestibility

Total digestible nutrients

Net energy

Reduced fat – energy content in low oil DDGS

Amino acid and mineral profiles

Slide9

Objective

Comparison of chemical properties of regular DDGS (

9% fat), and modified DDGS (

4 and 7% fat) samples

Slide10

Materials

Low oil DDGS (4% fat)

POET

Nutrition (Sioux Falls, SD)

Regular

DDGS

(9% fat)

Lifeline Foods, Inc. (St. Joseph, MO)

Moisture

conditioning

and DDGS

samples with intermediate fat (7%) content preparation were carried out at KSU.

Slide11

Methods

Proximate analysisMoisture: Gravimetric (AACC-I, 44-15.02)Ash: Gravimetric (AACC-I, 08-01.01)Protein: N combustion (AACC-I, 46-30.01)Conversion factor = 6.25Fat*: Soxhlet extraction with hexane (AOCS Ba 3-38)

*Analysis done by: The University of Missouri Agricultural Experiment Station Chemical Laboratories

Slide12

Methods

Carbohydrate compositionCrude fiber*: Enzyme digestion and filtration (AOAC, 978.10)Reducing sugars: Somogyi assay (Chow and Landhäusser, 2004)Arabinoxylan content: Alditol acetate derivitization and analysis by GC-FID (Blakeney et al. 1983)

*Analysis done by: The University of Missouri Agricultural Experiment Station Chemical Laboratories

Slide13

Methods

Mineral composition*AOAC, 985.01 a, b and d, Inductively coupled plasma - optical emission spectroscopy (ICP-OES)Amino acid profile*AOAC Official Method 982.30 E(a,b,c)

*Analysis done by: The University of Missouri Agricultural Experiment Station Chemical Laboratories

Slide14

Methods

Surface fat staining and imaging

Surface

fat

staining with Nile red dye

was done according to the method of Bhadra et al, (2009

)

Images taken

at 20x using Zeiss Observer Z1 microscope

with

LSM 700 confocal laser scanning module (Zeiss Thornwood, NY).

Excited

at

488

nm with short pass emission filter

at

555 nm

to

visualize DDGS particles and

555

nm with long pass filter set at 560 nm

to

visualize

nile

red stained lipid

droplets

Solid-state

lasers of LSM 700

set

at fixed power value for entire experiment 6% and 5.7% for 488 nm and 555

nm,

respectively (Greenspan et al. 1985

)

This

procedure was performed at the Advanced Imaging and Microscopy Core Facility at North Dakota State University

Slide15

Methods

DDGS prepared for staining according to Bhadra et al, 2009 with some modifications.

Embedded

in low melting point

agarose

Processed

in a Leica ASP 300 Automated

Processor and embedded in wax

Sections (5 micron) were cut using a Leica RM2255 Automated Rotary Microtome

Carbohydrate staining

Periodic

Acid Schiff (PAS), according to the methodology of Bhadra et al. (2009)

(

Prophet and Armed Forces Institute of Pathology, 1992

)

Protein staining

Hematoxylin

and Eosin (H & E) staining for proteins was done following the method described by AFIP Laboratory methods in

histotechnology

Slide16

Methods

Images

of HE and PAS stained slides were taken with Zeiss Iamger.M2

brighfield

microscope equipped using 5x objective and

AxioCam

HRc

camera (Zeiss, Thornwood, NY

)

Images

were analyzed using

ImagePro

-Premiere software (Ver.9.0.1 Media Cybernetics, Inc., Silver Spring, MD

)

For

PAS staining areas of light red vs. intense red staining were extracted using smart segmentation module of

ImagePro

software,

data

expressed as % area

Slide17

Methods

Statistical analysisAll analysis was conducted in triplicate for each of the samplesAnalysis of variance (ANOVA) was conducted with completely random design (CRD) using SAS version 9.3 (Cary, NC)Mean separation was performed by calculation of least significant difference (LSD, P<0.05)

*Analysis done by: The University of Missouri Agricultural Experiment Station Chemical Laboratories

Slide18

Results: Proximate Composition

%Temp%%% DWBOil°CRHMoistAshProteinFatGlycerol420408.194.8833.845.735.394208020.334.2129.715.654.22440407.424.9434.246.865.414408010.934.7332.976.635.41720407.726.3031.149.843.757408026.075.2025.357.832.95920407.835.8828.3912.464.969408022.315.1224.289.953.96LSD (P<0.05)0.450.060.270.440.25

RH = Relative Humidity, DWB = Dry weight basis, LSD = Least significant difference

Slide19

Results: Carbohydrates

RH = Relative Humidity, DWB = Dry weight basis, LSD = Least significant difference, A/X = arabinose to xylose ratio

%Temp%% DWBOil°CRHCrude FiberArabinoxylanA/XReducing Sugars420408.0911.920.680.31420807.338.620.670.41440408.3911.180.680.32440808.4312.640.720.28720407.088.960.831.54740805.926.870.790.92920407.129.850.832.21940806.198.860.772.39LSD (P<0.05)0.271.340.030.08

Slide20

Results: Overall Composition

Slide21

Results: Mineral Composition

*As is moisture basisRH = Relative Humidity, ppm = Parts per million, LSD = Least significant difference

%Temp%% w/w*ppm*Oil°CRHCalciumPhosphorusSodiumPotassiumZinc420400.030.870.121.1056.63420800.030.780.100.9649.05440400.030.900.121.1257.83440800.030.880.111.0856.73720400.071.440.350.9674.45740800.061.110.270.7564.03920400.051.360.341.0474.73940800.051.140.290.8568.37LSD (P<0.05)0.000.030.010.011.70

Slide22

Results: Amino Acid ProfileEssential amino acids

% OilTemp °C% RHMethionineValineArginineTryptophanLeucineIsoleucinePhenylalanineLysineHistidineThreonine% w/w*420400.571.531.380.213.701.161.591.070.881.20420800.491.321.190.183.201.011.380.930.761.04440400.581.561.390.203.761.191.611.070.881.22440800.561.481.340.203.571.131.531.020.841.16720400.571.441.370.203.281.141.451.000.811.18740800.441.151.060.152.630.911.110.720.610.92920400.501.341.380.212.911.041.370.880.701.07940800.411.141.130.172.500.881.120.670.570.89LSD (P<0.05)0.010.020.020.010.050.030.030.030.030.02

*As is moisture basisRH = Relative Humidity, LSD = Least significant difference

Slide23

Results: Amino Acid ProfileNon-essential amino acids

% OilTemp °C% RHHydroxyprolineAspartic AcidSerineGlutamic AcidProlineGlycineAlanineCysteineTyrosineHydroxylysine% w/w*420400.111.971.414.632.601.222.200.601.220.20420800.101.711.234.172.171.061.900.521.070.16440400.112.001.444.752.621.232.240.611.240.21440800.111.901.374.522.471.182.140.571.190.20720400.141.831.344.102.471.202.030.601.160.18740800.131.461.083.441.930.951.620.450.910.12920400.131.671.213.271.841.081.740.481.010.19940800.031.431.052.981.570.931.500.390.840.14LSD (P<0.05)0.050.030.040.070.040.020.030.010.030.04

*As is moisture basisRH = Relative Humidity, LSD = Least significant difference

Slide24

Results: Surface Fat Staining

*RH = Relative Humidity,

RED = Fat, Green = DDGS particles

Slide25

Results: Carbohydrate and Protein CompositionCross-Sectional Imaging of DDGS Particles

Periodic acid/

Shiff

Stain for Carbohydrates

Hematoxylin

& Eosin (H&E) Stain for Proteins

Carbohydrate

Protein

Slide26

Results: Carbohydrate and Protein CompositionCross-Sectional Imaging of DDGS Particles

%Temp%Area (um2)Area %Area (um2)Area %Oil°CRHTotal CarbohydrateCarbohydrateTotal ProteinProtein42040176044.0113137.964.19134270.440178.332.1942080226886.5148896.265.59188880.874515.038.1544040163389.2100012.661.53117159.741721.237.5444080181648.7122915.167.58122768.838834.232.3972040145416.358813.341.8227424.93072.610.3274080180809.287248.445.7461260.218777.425.2492040137294.460679.142.5746285.113032.920.9494080151668.082675.155.1265252.922134.728.12LSD (P<0.05)47686.031351.07.7136998.018223.010.22

RH = Relative Humidity, LSD = Least significant difference

Slide27

Conclusion

For Low Oil DDGS (4% Fat)

Protein

Glycerol

Fiber

Arabinoxylan

Some amino acids

Ash (minerals)

Reducing sugars

Phosphorus

Sodium

Zinc

Slide28

Take Home Message

Slide29

THANK YOUQuestions?

www.wheatquality.com

Slide30

Results: Amino Acid ProfileEssential amino acids

*RH = Relative Humidity, Error bars represent least significant difference

Slide31

Results: Amino Acid ProfileNon-essential amino acids

*RH = Relative Humidity, Error bars represent least significant difference

Slide32

20

°C

40% RH

40 °C80% RH

7% Oil

9% Oil

4% Oil

Slide33

Slide34

Slide35

Conclusion

Increased

ProteinGlycerolFiberArabinoxylanSome amino acids

Decreased

Ash (minerals)Reducing sugarsPhosphorusSodiumZinc

For Low Oil DDGS (4% Fat)

Slide36