/
Intro to Radar Intro to Radar

Intro to Radar - PowerPoint Presentation

yoshiko-marsland
yoshiko-marsland . @yoshiko-marsland
Follow
404 views
Uploaded On 2017-08-28

Intro to Radar - PPT Presentation

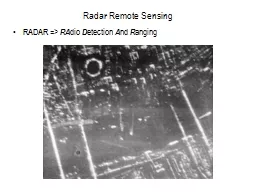
SO 254 Spring 2017 LCDR Matt Burich Radar is the most commonly used active sensor in meteorology RADAR RA dio D etection A nd R anging Active refers to the fact that a radar alternately switches between transmitting ID: 582920

velocity radar scan reflectivity radar velocity reflectivity scan dbz echo radial elevation rain pulse target volume angle targets larger

Share:

Link:

Embed:

Download Presentation from below link

Download Presentation The PPT/PDF document "Intro to Radar" is the property of its rightful owner. Permission is granted to download and print the materials on this web site for personal, non-commercial use only, and to display it on your personal computer provided you do not modify the materials and that you retain all copyright notices contained in the materials. By downloading content from our website, you accept the terms of this agreement.


Presentation Transcript

Slide1

Intro to Radar

SO 254 – Spring 2017

LCDR Matt BurichSlide2

Radar is the most commonly used

active

sensor in meteorology

RADAR: RAdio Detection And Ranging

“Active” refers to the fact that a radar alternately switches between transmitting

and

receiving pulses of microwave energy via a common antenna

After transmitting a short but powerful pulse, the “switch” (or duplexer) places the system into receive mode where the antenna collects the “echo” of the pulse off of targets in its path

The antenna focuses the microwave energy into a narrow beam so that transmitter power is concentrated in a specific direction.

Echoes collected by the antenna are processed in the receiver where a few basic parameters of the returned signal are measured.Slide3

Measured parameters:

RADAR:

RA

dio Detection And Ranging


Where

is the speed of light and

is the elapsed time between the pulse transmission and received echo


1)

Range

to the targets via:

Strength of the returned echo from which the equivalent

reflectivity

of the targets is derived


The Doppler shift in frequency (phase) of the echo vs. the transmitted pulse indicating the component of

target velocity in the line of sight of the radar ()


The polarization of the echo from

which information on target shape

may be derived Slide4

Radar Reflectivity (Z)

The radar beam simultaneously illuminates many meteorological targets at once within

a

resolution volume The resolution volume is a spherical rectangle, the dimensions of which are defined by the performance parameters of the radar (its pulse length, beam width, and beam height)Reflectivity is derived from the amount of power returned in a radar echo as collected by the antenna and processed in the receiver

In general, larger number concentrations of precipitation particles (hydrometeors) and larger sized hydrometeors will produce larger values of reflectivitySlide5

Radar Reflectivity (Z)

The radar beam simultaneously illuminates many meteorological targets at once within

a

resolution volume The resolution volume is a spherical rectangle, the dimensions of which are defined by the performance parameters of the radar (its pulse length, beam width, and beam height)Reflectivity is derived from the amount of power returned in a radar echo as collected by the antenna and processed in the receiver

In general, larger number concentrations of precipitation particles (hydrometeors) and larger sized hydrometeors will produce larger values of reflectivitySlide6

Radar Reflectivity (Z)

Reflectivity is measured logarithmically in decibel units (

dBZ

)-50 to 0 dBZ = marginally detectable precipitation0-10 dBZ = drizzle, very light rain or snow10-30 dBZ = moderate rain / heavier snow

30-60

dBZ

= moderate to heavy rain / melting snow60-70 dBZ = hail

Some characteristic values:Slide7

Radar Reflectivity (Z)

Reflectivity is measured logarithmically in decibel units (

dBZ

)-50 to 0 dBZ = marginally detectable precipitation0-10 dBZ = drizzle, very light rain or snow10-30 dBZ = moderate rain / heavier snow

30-60

dBZ

= moderate to heavy rain / melting snow60-70 dBZ = hail

Some characteristic values:Slide8

Radial Velocity

Radial velocity is the component of a target’s velocity in the

line of sight

of the radar (motion either directly toward or directly away)

Target moving 100

kts


100% of target motion is directly toward or away from the radar (along a radial)Slide9

Radial Velocity

Radial velocity is the component of the target’s velocity in the

line of sight

of the radar (motion either directly toward or directly away)

Target moving 100

kts


In the image, the wind is from the south at 20

kts

everywhere (black arrows) – the component of the wind in the

line of sight

of the radar (radial velocity) is indicated by blue arrows

On the radar display, velocities are color-coded to indicate motion toward (

green

) or away (

red

) from the radar site

-20

20

14

14

-14

-14

0

0

Target

not

moving directly toward the radarSlide10

Radial Velocity

Radial velocity has proven to be invaluable at locating areas of small-scale rotation in thunderstorms and can be displayed both from a ground-relative sense (i.e., velocity relative to the radar) and a “storm-relative” sense (by subtracting storm motion from ground-relative velocity)

Areas where strong velocity toward the radar and strong velocity away from the radar are located immediately adjacent to one another are suggestive of such areas which may produce tornadoes if the spin is sufficiently concentrated

The image to the right shows the rotation associated with an EF-4 tornado that struck Tuscaloosa, Alabama in April of 2011

radarSlide11

Radial Velocity

Doppler radar determines radial velocity by comparing the frequency difference (really, phase difference) between the transmitted and received pulse and computing a Doppler “beat frequency”

which is proportional to velocity in the line of sight

 Targets moving toward the radar will cause the frequency of the echo to increase over the transmitted pulse while targets moving away will cause the frequency of the echo to decreaseSlide12

Echo polarization

Up until recently, most weather radars transmitted pulses with a horizontal polarization only since larger raindrops tend to be “oblate” (flat) due to aerodynamic drag (therefore, a stronger echo was returned)

In recent years, our primary National Weather Service radars have been upgraded to have a “dual polarization” capability – that is, they transmit both horizontally polarized and vertically polarized pulses

This capability allows for the determination of target shape

(among other things) and has shown skill at distinguishing heavy rain (large horizontal return and smaller vertical return) from spherical hail (nearly equal horizontal and vertical returns)Slide13

National Weather Service Radar

The National Weather Service maintains a network of dual-polarization Doppler weather radars designated WSR-88D (Weather Surveillance Radar 1988 Doppler)

The word “surveillance” refers to the radar’s primary scan mode which is a 360 degree sweep (a surveillance scan) as opposed to a sector scan which would be something less than 360 degrees or an elevation scan which would hold a constant azimuth and vary elevation angleSlide14

National Weather Service Radar

Despite the fact that the WSR-88D performs a surveillance scan, it

does

vary elevation angle between each 360 degree sweep to interrogate a three-dimensional volume of spaceEssentially, after completing a 360 degree scan at one elevation angle, the radar will adjust its elevation angle (“tilt”) slightly and complete another 360 degree scan, and so onDepending on the volume coverage pattern (VCP) desired (and there are several), an entire volume scan

usually takes between 4 and 6 minutes after which point the radar returns to the lowest elevation angle (called the

base

scan…usually 0.5 degrees above the horizon) and begins the process againSlide15

The image below shows the elevation angles scanned (a total of 14) for VCP 21…A VCP may also be referred to as a radar’s “scan strategy”

Base scan (0.5 degrees)

The base scan is what is typically shown in most applications and

should represent best the precipitation intensity near the ground. However…Note that the base elevation angle scan becomes “higher” off the ground as distance from the radar increases…this must be kept in mind when examining echoes at the far extent of a radar’s rangeSlide16

Composite Reflectivity

Composite reflectivity displays the highest value of echo return from a particular azimuth and range from

any

elevation angleEssentially, it gives a somewhat more three-dimensional look at precipitation and will readily reveal areas where precipitation is falling aloft, but evaporating before reaching the ground (compare between base and composite)Base scan

CompositeSlide17

Finally, for today, we note that radar is particularly effective at locating the “melting layer” where frozen hydrometeors (e.g., snowflakes) are melting into rain. This layer appears as a ring of high reflectivity called a

bright band

on radar as the frozen hydrometeors become “wet” as they’re melting and appear to the radar to be very large rain droplets