/
On the Road to Energy Independence: On the Road to Energy Independence:

On the Road to Energy Independence: - PowerPoint Presentation

CherryBlossom
CherryBlossom . @CherryBlossom
Follow
342 views
Uploaded On 2022-08-03

On the Road to Energy Independence: - PPT Presentation

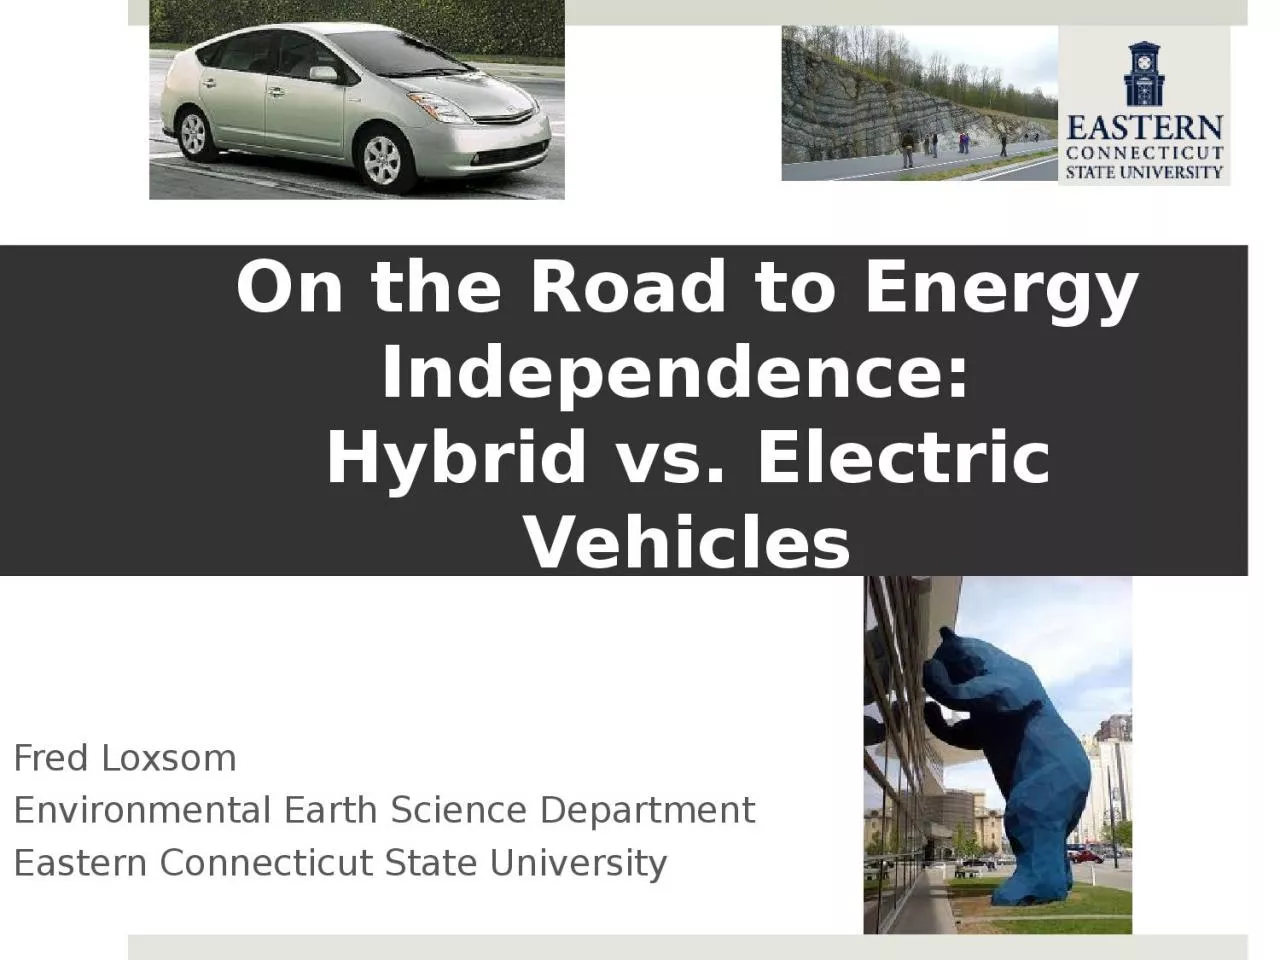
Hybrid vs Electric Vehicles Fred Loxsom Environmental Earth Science Department Eastern Connecticut State University US Cars and Drivers US Population 311 million Licensed drivers 190 million ID: 934094

kwh co2 billion electric co2 kwh electric billion miles trillion emission million gal 500 cars 000 200 leaf total

Share:

Link:

Embed:

Download Presentation from below link

Download Presentation The PPT/PDF document "On the Road to Energy Independence:" is the property of its rightful owner. Permission is granted to download and print the materials on this web site for personal, non-commercial use only, and to display it on your personal computer provided you do not modify the materials and that you retain all copyright notices contained in the materials. By downloading content from our website, you accept the terms of this agreement.


Presentation Transcript

Slide1

On the Road to Energy Independence: Hybrid vs. Electric Vehicles

Fred LoxsomEnvironmental Earth Science DepartmentEastern Connecticut State University

Slide2

US Cars and Drivers

US Population 311 millionLicensed drivers 190 millionCars and light trucks.

210 million

Slide3

Internal Combustion Engine (ICE)

Slide4

ICEs emit CO2

Slide5

ICE CO2 Emission

200 million cars & light trucks14,000 miles/year  2.8 trillion miles22 mpg

 2.8 trillion miles ÷ 22 mpg

130 billion gal gasoline

20 lb CO2 / gal

2.6 trillion lb CO2

1.2 billion tons CO2

=

20 % US total CO2 emission

Slide6

HEVs

Gasoline

Engine

Electric

motor

Does

not

need to be plugged in

Slide7

HEVs are fuel efficient

Slide8

HEV CO2 Emission

Assume 200 million HEVs14,000 miles/year  2.8 trillion miles50 mpg

 2.8 trillion miles ÷ 50 mpg

56 billion gal gasoline

20 lb CO2 / gal

1.1 trillion lb CO2

0.50 billion tons CO2

=

9 % US total CO2 emission

Slide9

EVs

Electric Vehicles have had drawbacks:Large heavy batteries

Short driving range

Slow

refueling (recharging) process

Slide10

GM EV-1

Produced by GM from 1996-1999

Slide11

Tesla

Tesla Model SUses Li-ion batteriesExpensive

200 mile range

Lower-price

model in 2014

Slide12

GM Volt

10 kWh usable electric battery40 mile rangeGasoline engine back-upPlug-in Hybrid

5-door liftback

$33,500 after tax break

Slide13

Nissan LEAF

24 kWh electric battery100 mile rangeAll-electric5-door hatchback

$25,300 after tax break

Slide14

LEAF Electric Energy

Assume 200 million LEAFs14,000 miles/year  2.8 trillion miles4 mi/kWh

 2.8 trillion miles ÷ 4 mi/kWh700 billion kWh

(US total electric use is 4000 billion kWh)

Requires:

100 million PV installs or 500 Cape Wind farms or 90 nuclear reactors or 200 coal plants

Slide15

From Oil

Slide16

to Solar

Slide17

to Wind

Slide18

to Nuclear Power

Slide19

to Coal?

Slide20

LEAF CO2 Emission

Assume average CO2 emission per kWh:700 billion kWh x 600 g CO2/kWh

0.42 billion ton CO2 = 7% US total CO2

Assume electricity from

coal

plants:

700 billion kWh x 1000 g CO2/kWh

0.70 billion ton CO2

=

11% US total CO2 emission

Slide21

CO2 Emission Comparison

420 MtCO2 -- Electric Cars with electricity vvvvvvvvfrom

typical mix

of generators

500 MtCO2 --

HEV

or Very Efficient ICE

700 MtCO2 --

Electric Cars with electricity

vvvvvvvvv

from

Coal

1,200 MtCO2 --

Typical ICE

So EVs and HEVs both reduce CO2.

Slide22

Fuel Cost

ICE14,000 miles ÷ 22 mi/gal = 640 gal640 gal x $3/gal = $2000/year

LEAF

14,000

miles ÷ 4 mi/kWh = 3,500 kWh

3,500 kWh x $0.15/kWh =

$500/year

Slide23

Issue: Range

Slide24

Issue: Lithium

Is a lithium shortage likely?"Lithium batteries are being touted as a way forward for electric cars, but according to William Tahil, director of research for Meridian International Research this could result in the world's lithium supply drying up really fast.”- Hybrid Car Blog

Slide25

Changing the US auto fleet

210 million cars and light trucks in US19 million new cars and trucks each yearVehicles last 140,000 miles or 10 yearsChanging rolling stock takes at least10 years.

Nissan expects to reach 500,000 global LEAF production capacity.

Slide26

Questions?Comments?