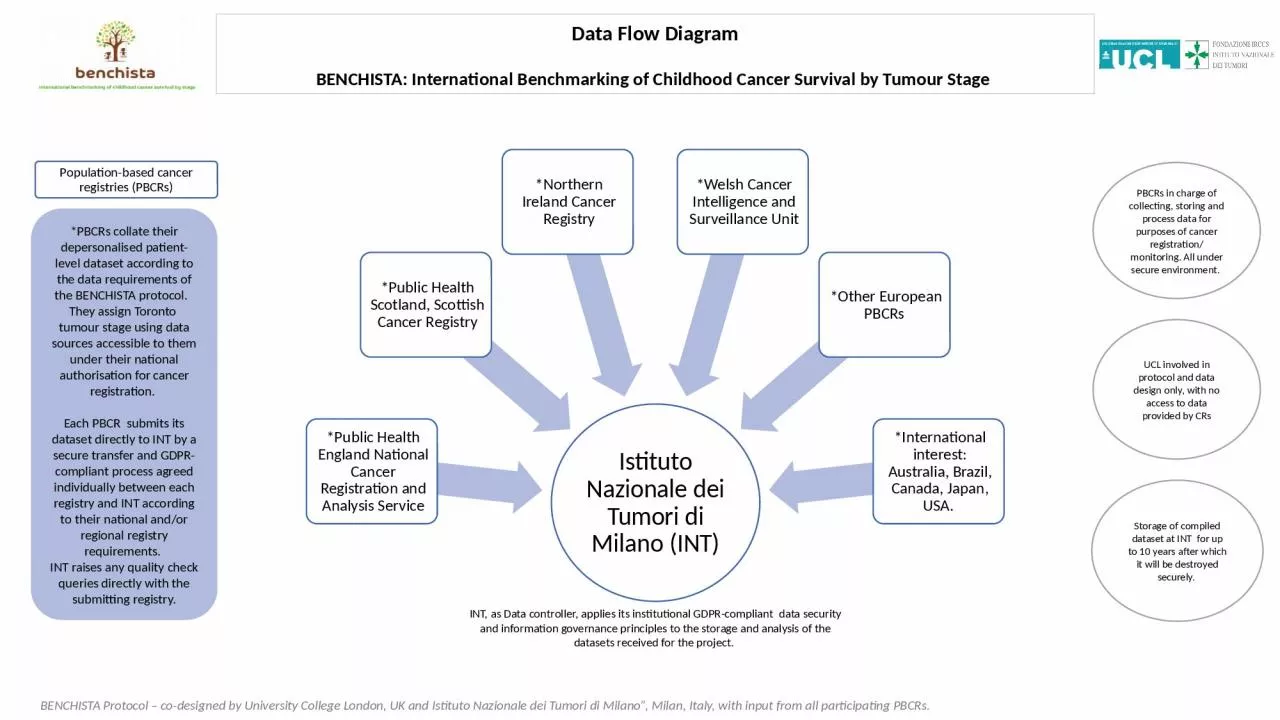
PPT-Data Flow Diagram BENCHISTA: International Benchmarking of Childhood Cancer Survival by

Author : UnicornLove | Published Date : 2022-07-28

BENCHISTA Protocol codesigned by University College London UK and Istituto Nazionale dei Tumori di Milano Milan Italy with input from all participating PBCRs

Presentation Embed Code

Download Presentation

Download Presentation The PPT/PDF document "Data Flow Diagram BENCHISTA: Internation..." is the property of its rightful owner. Permission is granted to download and print the materials on this website for personal, non-commercial use only, and to display it on your personal computer provided you do not modify the materials and that you retain all copyright notices contained in the materials. By downloading content from our website, you accept the terms of this agreement.

Data Flow Diagram BENCHISTA: International Benchmarking of Childhood Cancer Survival by: Transcript


BENCHISTA Protocol codesigned by University College London UK and Istituto Nazionale dei Tumori di Milano Milan Italy with input from all participating PBCRs PBCRs collate their depersonalised patientlevel dataset according to the data requirements of the BENCHISTA protocol . microsoftcompresspassguidesvisioprofessionalprotutorialsflowasp A data flow diagram DFD is a tool for functional analysis that shows the general flow of in formation through a system or program Most companies are creating ecommerce businesses as part Please include the citation provided in our Frequently Asked Questions when reproducing this chart: http://info.cancerresearchuk.org/cancerstats/faqs/#How. Prepared by Cancer Research UK. Original data sources:. PCB = Carcinoma of the Cervix. Abdominal Distension Age > 50 years = Ovarian Cancer. Vulval. Ulceration Age > 60 years = . Vulval. Cancer. Government Pledges on Waiting Times. Maximum Duration of Waiting:. Wilhelmina Ross, . PA, MPH, CTR - Westat. Jeannette Jackson-Thompson. , MSPH, PHD n- . Missouri Cancer Registry and Research Center . Diane . Ng, MPH, . Westat . Maricarmen . Traverso-Ortiz, MPH, CTR - . within 300400m of the device They then sought to identify the minimum intratumour drug levels required to induce apoptosis meas-ured by cleavage of caspase 3 and found that these varied significantly Impactful Data from a Highly Burdened Population. Principal Investigator. B Mark Evers, MD. Key Personnel. Eric B. Durbin, DrPH, MS, Project Lead. Jay Christian, PhD. Erin Haynes, PhD. John L. . Villano. Cancer Center Data Summit February 8, 2021. NCCR Purpose. Leverage and link disparate data from multiple sources to create an infrastructure that can better support research on childhood cancer. Core data derived from cancer registries- but extended and expanded to include additional relevant information such as. Title:. Att.3 – Presentation (TG-. Histo. ). Purpose:. Discussion. Contact:. Frederick Klauschen. Department of Pathology. LMU Munich & . Charité. Berlin. E-mail: . Frederick.Klauschen@med.uni-muenchen.de. R246 High rates of cellular proliferation are a key component of aggressive breast cancers. Markers of proliferation, such as Ki67, are widely used to identify cancers with high proliferative indices ANNA GIGLI . – . National . Research Council. , . Italy. SILVIA FRANCISCI – . National Health Institute, Italy. STEFANO GUZZINATI – . Veneto Cancer Registry, Italy. LUIGINO DAL MASO – . Aviano Cancer Institute, Italy. Joanne Aitken, Danny Youlden, Cate Brown, Andy Moore. Cancer Council Queensland. Queensland Children’s Hospital. Background. t-AML occurs in patients exposed to cytotoxic chemotherapy and/or radiotherapy . 1. Workflow of the Netherlands Cancer Registry. Sabine . Siesling. Comprehensive Cancer Centre the Netherlands. Netherlands. 17 . million. . inhabitants. >100,000 new . cancer. cases per . year. a collaboration between PHE and ONS. John Broggio, Cancer Analytical Lead. What is cancer survival?. . 2. Cancer survival in England - John Broggio. A statistic that measures the mortality of cancer patients compared to the mortality of the general population . What is DFD? . A data. . flow diagram is a graphical depiction of flow of data through intended software system and is used as 1. st. step to create an overview of system.. It’s really useful as it provides overview of data as well as functionality to software designers.

Download Document

Here is the link to download the presentation.
"Data Flow Diagram BENCHISTA: International Benchmarking of Childhood Cancer Survival by"The content belongs to its owner. You may download and print it for personal use, without modification, and keep all copyright notices. By downloading, you agree to these terms.

Related Documents