/
Spectrum Spectrum

Spectrum - PowerPoint Presentation

alida-meadow
alida-meadow . @alida-meadow
Follow
385 views
Uploaded On 2015-11-29

Spectrum - PPT Presentation

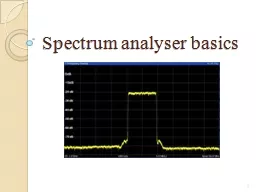
analyser basics 1 Functionality Analyse the frequency spectrum of a radio frequency signal Display the spectrum in the format of amplitude vertical vs frequency horizontal axes Many telecoms applications eg transmitter monitoring ID: 208755

signal frequency spectrum analyser frequency signal analyser spectrum mhz display filter range fft mixer dbm noise frequencies phase time

Share:

Link:

Embed:

Download Presentation from below link

Download Presentation The PPT/PDF document "Spectrum" is the property of its rightful owner. Permission is granted to download and print the materials on this web site for personal, non-commercial use only, and to display it on your personal computer provided you do not modify the materials and that you retain all copyright notices contained in the materials. By downloading content from our website, you accept the terms of this agreement.


Presentation Transcript

Slide1

Spectrum analyser basics

1Slide2

Functionality Analyse

the frequency spectrum of a radio frequency signal.Display the spectrum in the format of amplitude (vertical) vs. frequency (horizontal) axes.

Many telecoms applications, e.g. transmitter monitoring

for interference avoidance.

2Slide3

Types -

Swept

-

tuned

: sweep the frequency that is analysed

across

the required band. Detecting up to GHz, but relatively slow

and no phase information given.

-

Fast Fourier Transform (FFT): digital analysis using FFT. Fast response (e.g. for one-shot phenomena), but lower frequency range and more expensive.-Real-time: special type of FFT spectrum analyser, which analyses the spectrum in real-time.-Audio: focused on audio frequencies (20 Hz - 20 KHz) and much cheaper.

3Slide4

Swept-tuned type Uses a mixer and a local oscillator to translate the input

frequency:

4

(

i

)

(

i

)

(

i

)

(

i

)

(

i

)

(i)

(i)

(i)

(i)

(

i

)

Slide5

FFT type The speed of the Analog-to-Digital Converter places a limit

on the input frequency range supported.

5

(

i

)

(

i

)

(

i

)

(

i

)

(

i

)

(i) Slide6

Spectrum analyser specifications

-

Frequency coverage

: determines the lowest and highest

input frequency that can be viewed.

- Amplitude accuracy

: usually of the order of 0.4 dB, can be in excess of 100 dB with the use of a power meter.

-

Frequency accuracy

: depends on the reference source of the synthesizer and the peak detection circuitry.6Slide7

Spectrum analyser specifications (2)

-

Sensitivity

: represents the low signal performance in

dBm

/Hz at a given frequency.

- Phase noise: should be at least 10 dB better than the phase

noise (of the signal source) that needs to be measured.

-

Dynamic range: determines the ability of the device to look at small signals in the presence of close strong signals.7Slide8

Tracking generator Enables a spectrum

analyser to make response or network

measurements (e.g. frequency response, conversion loss,

return loss):

8

(

i

)

(

i

)

(

i

)

(

i

)

(i)

(i)

(i)

(i)

(i) Slide9

Spectrum analysers

Rohde & Schwarz FSH-6

Spectran

Data Logger HF6060

Spectran

Data Logger HF6080

Spectran

Data Logger HF60100

Spectran

Data Logger NF50309Slide10

Specifications10

Model

FSH-6

HF6060

HF6080

HF60100

NF5030

Frequency

range

100 KHz –

6 GHz

10 MHz –

6 GHz

10 MHz –

8 GHz

1 MHz –

9.4 GHz

1 Hz –

1 MHz

Sweep time

1 ms – 100 s down to 10 ms down to 10 ms down to

1 ms down to 10 ms Resolution bandwidth 100 Hz – 1 MHz

3 KHz – 50 MHz 1 KHz – 50 MHz 200 Hz – 50 MHz 0.3 Hz – 1 MHz

Displayed average noise level -135 dBm -135 dBm -145 dBm

-155 dBm -150 dBm Accuracy 0.5 dB

2 dB 2 dB 1 dB 3 %

Interface

RS-232-C

USB

USB

USB

USB

Mobility

Handheld

(2.5 kg)

Handheld

(430 gram)

Handheld

(430 gram)

Handheld

(430

gram)

Handheld

(420 gram)

Cost

$

10,000

1,000

1,300

1,500

1,000Slide11

Elements of a swept-tuned analyser11

RF attenuator

: adjusts the level of the signal entering the mixer so that the latter is not damaged and the system

falls into its nominal operation region.

Low-pass filter

: removes out-of-band signals before the

mixer.

Mixer

: shifts the input frequencies to the desired range.

IF amplifier: ensures the IF stage provide the required gain. Used in conjuction with the RF attenuator. Slide12

Elements of a swept-tuned analyser (2)

12

IF filter

: restricts the bandwidth viewed, effectively

increasing the frequency resolution.

Local oscillator

: must support wide range of frequencies and produce very low phase noise.

Ramp generator

: used to link the horizontal axis of the display to the frequency.

Envelope detector: converts the signal from the IF filter into a voltage signal that is sent to the display. Slide13

Elements of a swept-tuned analyser (3)

13

Video filter

:

used to smooth the display by removing noise from the envelope.

Display

: where signal spectra are viewed. Usually made from liquid crystals. Slide14

Elements of an FFT analyser

14

Attenuator/gain controller

: adjusts the signal level prior to the analog-to-digital conversion.

Low-pass filter

: filter out too high frequencies to satisfy the

Nyquist

criterion.

Sampler & ADC

: samples are taken at discrete time intervals and a digital format is produced.FFT analyser: converts the data from the time into the frequency domain.Slide15

Elements of an FFT analyser (2)

15

Display

: where signal spectra are viewed. Slide16

Tracking generator16

RF attenuator

: adjusts the level of the signal entering the mixer so that the latter is not damaged and the system

falls into its nominal operation region.

Low-pass filter

: removes out-of-band signals before the

mixer.

Mixer

: shifts the input frequencies to the desired range.

Local oscillator: must support wide range of frequencies and produce very low phase noise.Slide17

Tracking generator (2)17

IF amplifier

: ensures the IF stage provide the required

gain. Used in

conjuction

with the RF attenuator.

Envelope detector

: converts the signal from the IF filter into a voltage signal that is sent to the display.

Ramp generator

: used to link the horizontal axis of the display to the frequency.Display: where signal spectra are viewed. Usually made from liquid crystals.