/
POWER BI REPORT Design Factors POWER BI REPORT Design Factors

POWER BI REPORT Design Factors - PowerPoint Presentation

ashley
ashley . @ashley
Follow
342 views
Uploaded On 2021-12-09

POWER BI REPORT Design Factors - PPT Presentation

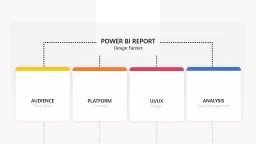
AUDIENCE Final Users PLATFORM Channels UIUX Design ANALYSIS Data Management AUDIENCE Final Users EXCECUTIVE Take Decisions Summary Overview amp Conclusions OPERATIONAL Take Actions Monitor amp Action ID: 904668

amp power report view power amp view report design data visuals process explore materialize users understand thought audience platform

Share:

Link:

Embed:

Download Presentation from below link

Download The PPT/PDF document "POWER BI REPORT Design Factors" is the property of its rightful owner. Permission is granted to download and print the materials on this web site for personal, non-commercial use only, and to display it on your personal computer provided you do not modify the materials and that you retain all copyright notices contained in the materials. By downloading content from our website, you accept the terms of this agreement.


Presentation Transcript

Slide1

POWER BI REPORT

Design Factors

AUDIENCE

Final Users

PLATFORM

Channels

UI/UX

Design

ANALYSIS

Data Management

Slide2

AUDIENCE

Final Users

EXCECUTIVE

Take Decisions

Summary Overview & Conclusions

OPERATIONAL

Take Actions

Monitor & Action

ANALYTICAL

Answer Questions and Promote Insights

Interpretation & Depth

VIEWER

Educate

Awareness

Slide3

PLATFORM

Channels

REPORT VIEW

Power BI Desktop

DASHBOARD VIEW

Power BI Service

MOBILE VIEW

Power BI Mobile

EMBEDDED VIEW

Power BI Embedded

PUBLIC VIEW

Publish to Web

PRINTING, ELECTRONIC FORMAT

Power BI Paginated Reports

HOLOGRAPHIC VIEW

Power BI Mixed Reality

TABLET VIEW

Power BI Windows 10 App

Slide4

UI/UX

Design

LAYOUT

Margin, Distribution, Spacing & Balance

COLOR

Tones, Contrast, Opacity, Transparency & Gradient

BRANDING

Logo, Icon sets, Pictures & Brand Guidelines

UI/UX

Interactive, Filtering, Report navigation & Clicktale

Accessible, Consistent, Recognizable, Intuitive

ACCESIBILITY

Screen Readers, Low Vision, Physical or motor disabilities, Dyslexia, Autistic Spectrum

PERFORMANCE

Optimization, Latency & Responsiveness

Slide5

ANALYSIS

Data Management

DATA MODELING

Data transformation, Relationships, Calculated fields, Governance.

DATA VISUALIZATIONS

Selecting Visuals, Custom Visuals, “Out of the box” Visuals,

AI Visuals & Infographics

POWER BI FEATURES & CAPABILITIES

Drilldown, Drillthrough, Tooltips, What If, Trend Lines, Conditional Formatting, Filters, etc.

DAX

Analysis, Q&A & Design Oriented

Slide6

POWER BI REPORT

Design Process

What problems are you trying to solve?

Questionnaire

Data verification

Data Modeling

Who is/are your Audience?

Executive

Operational

Analytical

Viewer

Slide7

What is the Consumption experience?

Report View

Dashboard View

Mobile View

Tablet View

Embedded View

Website View

Printing

Electronic Format

Holographic View

Are there any additional requirements?

Accessibility

Performance

Real Time

Multilingual

Cross-Platform responsiveness

Export to PowerPoint

Sketching

Layout

Storytelling

Elemental Hierarchy

InterfaceExperience

Data Visualization

Visuals

Custom Visuals

“Out of the Box” Visuals

Best Practices

DAX

Slide8

Power BI Features & Capabilities Setup

Drilldown

Drillthrough

Tooltip

Bookmarking

Conditional Formatting

What If

Forecast

AlertsCross-Filtering

Color

Main Colors

Indicator Colors

Hue & Saturation

Complementary Colors

Branding

Logos

Images

Iconography

Font

Brand Guidelines

Test

Deployment

Implementation

Maintenance

Slide9

POWER BI REPORT

Design Thought Process

UNDERSTAND

EXPLORE

MATERIALIZE

1

2

1

Who is/are your Audience?

2

What are the

problems

to solve?

EMPATHIZE

Conduct research to develop an understanding of your users

Slide10

POWER BI REPORT

Design Thought Process

UNDERSTAND

EXPLORE

MATERIALIZE

3

4

DEFINE

Combine all research and observe where your users’ problems & needs exist

3

4

What is the Consumption experience?

Are there other requirements?

Slide11

POWER BI REPORT

Design Thought Process

UNDERSTAND

EXPLORE

MATERIALIZE

5

6

IDEATE

Generate a range of crazy, creative ideas

Data Visualization

Sketching

7

DAX

5

6

7

Slide12

POWER BI REPORT

Design Thought Process

UNDERSTAND

EXPLORE

MATERIALIZE

8

9

PROTOTYPE

Build real, tactile representations for a range of your ideas

Branding

10

Color

Power BI Features & Capabilities Setup

9

8

10

Slide13

POWER BI REPORT

Design Thought Process

UNDERSTAND

EXPLORE

MATERIALIZE

11

TEST

Return to your users for feedback

11

Test

Slide14

POWER BI REPORT

Design Thought Process

UNDERSTAND

EXPLORE

MATERIALIZE

12

IMPLEMENT

Put the vision into production.

12

Deployment

Slide15

INFLUENTIAL

FACTORS

Why is this important?

Provide

Clear and Valuable information

to your audience

Build a

Positive Reputation

about your company

Engage Users

Add

Substance and Credibility

Increase productivity

and Improve your operations

Impulse

Citizen Data Science

Easy to use/explore

Improve

Cross-Platform Flexibility

reaching more people

Allow users to respond quickly &

“Call to action”