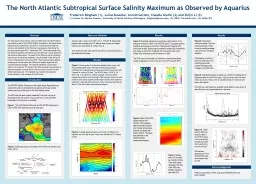
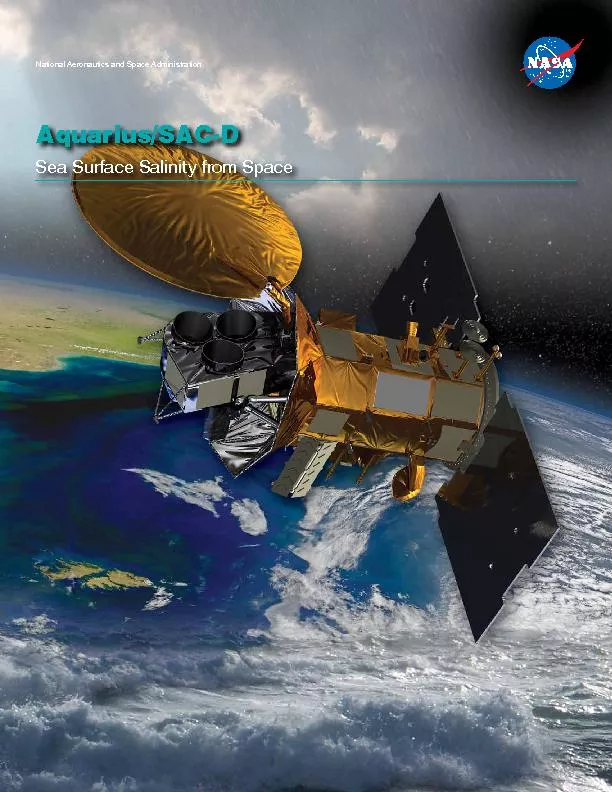
PPT-Evaluation of sea surface salinity variability in the East China Sea observed by the Aquarius

Author : conchita-marotz | Published Date : 2018-03-20

Seungbum Kim JPL Jaehak Lee Korean Institute of Ocean Science and Technology Paolo de Matthaeis GSFC D ata provision by IC Pang Jeju Natl Univ S Korea Funded

Presentation Embed Code

Download Presentation

Download Presentation The PPT/PDF document "Evaluation of sea surface salinity varia..." is the property of its rightful owner. Permission is granted to download and print the materials on this website for personal, non-commercial use only, and to display it on your personal computer provided you do not modify the materials and that you retain all copyright notices contained in the materials. By downloading content from our website, you accept the terms of this agreement.

Evaluation of sea surface salinity variability in the East China Sea observed by the Aquarius: Transcript


Seungbum Kim JPL Jaehak Lee Korean Institute of Ocean Science and Technology Paolo de Matthaeis GSFC D ata provision by IC Pang Jeju Natl Univ S Korea Funded by OSST Results available in JGR 2014 special issue. D. Vandemark, H. . Feng. Univ. of New Hampshire/EOS. N. . Reul. , F. . . Ardhuin. , B. . Chapron. . IFREMER/Centre de Brest. within . Aq. Cal/Val team efforts. OSST Meeting 2012. 2. OSST 2012. Overview. Shannon Brown and Sidharth Misra. Jet Propulsion Laboratory, California Institute of Technology. 7th . Aquarius SAC-D Science Meeting. 11-13, April 2012. Buenos Aires, Argentina. Project Overview. Developing methods to track Aquarius calibration over Antarctica and rainforest regions. NADYA T. VINOGRADOVA. 1. RUI M. PONTE. 1. MARTHA W. BUCKLEY. 2. 1. Atmospheric . and Environmental Research (AER. ), USA. 2. George Mason University (GMU), USA . Aquarius/SAC-D Science Team Meeting, Seattle, WA. of . Salinity. Kyla Drushka. 1. , . Sarah Gille. 2. , Janet Sprintall. 2. . kdrushka@apl.uw.edu. 1. Applied Physics Lab, Univ. of Washington . 2. Scripps Inst. of Oceanography. Aquarius Science Team Meeting. Alex Fore, Simon . Yueh. , . Wenqing. Tang, Akiko Hayashi. Drift in Scatterometer Calibration. A very small drift in the scatterometer calibration can be observed over the first few months.. Magnitude of drift is order 0.1 dB. isotopologues. . Guillaume Leduc . (CEREGE, France). Julian Sachs . (. University. of Washington, USA). Orest. . Kawka. . (. University. of Washington, USA. ). Ralph Schneider . (. University. of . Maximum as . Observed by . Aquarius. Frederick . Bingham (1. ), Julius Busecke, Arnold Gordon, Claudia Giulivi (2) and Zhijin Li (3). . (. 1) Center for Marine Science,. . University of North Carolina Wilmington, . in . the . southern . Makassar Strait since 1938 C.E. and . its . influence . on. . the . Indonesian . Throughflow. Braddock K. Linsley. , Lamont-Doherty Earth Observatory of Columbia University, Palisades, NY, USA [. Observations: Ocean. Janice Bytheway . ATS786 . September 15, 2014. Disclaimer. I’m not an oceanographer. I took an Intro to Oceanography course once in undergrad, but that was a long time ago. . Table of Contents. Aquarius/SAC-D Sea Surface Salinity from Space Acknowledgments Aquarius Web site http://aquarius.nasa.gov/Special thanks to the Aquarius Science Team for making this publication possible. Content: Nic Salinity. E. P. Dinnat. 1,2. , D. M. Le Vine. 1. , J. Boutin. 3. , X. Yin. 3. , . 1. Cryospheric Sciences Lab., NASA GSFC, Greenbelt, MD, U.S.A. 2. Chapman University, Orange, CA, U.S.A.. 3. LOCEAN, Paris, France. COMIDA-Hanna Shoal Ecosystem Study. Prepared by Jordann K. Young. Marine Science Department. University of Texas at Austin. GIS in Water Resources. Fall 2012. The Chukchi Sea. Seasonal ice cover . High primary productivity. ‘14. ‘12. ‘98. ‘92. ‘93. ‘91. ‘88. ‘87. ‘86. ‘89. ‘90. ‘96. ‘97. ‘13. ‘20. Deployed in 1988. Salt River Canyon, St. Croix USVI. Timeline of Aquarius. 13 missions conducted 1988-1989. Generally, salinity is defined as the ‘the total amount of solid material in grains contained in one kilogram of sea water and is expressed as part per thousands (%o) . e.g. . 30%o (means 30 grams of salt in 1000 grams of sea water). .

Download Document

Here is the link to download the presentation.
"Evaluation of sea surface salinity variability in the East China Sea observed by the Aquarius"The content belongs to its owner. You may download and print it for personal use, without modification, and keep all copyright notices. By downloading, you agree to these terms.

Related Documents