/
Waiting and watching:  Results from seven years of observing the field of open star cluster Waiting and watching:  Results from seven years of observing the field of open star cluster

Waiting and watching:  Results from seven years of observing the field of open star cluster - PowerPoint Presentation

conchita-marotz
conchita-marotz . @conchita-marotz
Follow
354 views
Uploaded On 2018-10-05

Waiting and watching:  Results from seven years of observing the field of open star cluster - PPT Presentation

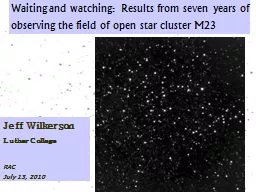
23 Jeff Wilkerson Luther College RAC July 13 2010 We image 3 clusters per year M23 and two others Image durations 2 to 12 seconds unfiltered Campaign durations 5 to 7 months Return to a cluster at least once ID: 684700

variable stars data star stars variable star data 000 signal period stat sep clusters eclipsing night mira camera images

Share:

Link:

Embed:

Download Presentation from below link

Download Presentation The PPT/PDF document "Waiting and watching:  Results from sev..." is the property of its rightful owner. Permission is granted to download and print the materials on this web site for personal, non-commercial use only, and to display it on your personal computer provided you do not modify the materials and that you retain all copyright notices contained in the materials. By downloading content from our website, you accept the terms of this agreement.


Presentation Transcript

Slide1

Waiting and watching:  Results from seven years of observing the field of open star cluster M23

Jeff WilkersonLuther CollegeRACJuly 13, 2010Slide2

We image 3 clusters per year: M23 and two others

Image durations: 2 to 12 seconds, unfilteredCampaign durations: 5 to 7 monthsReturn to a cluster at least onceBVRI photometry at least once for color correction to magnitude conversion and knowledge of variable star colorsResult: tens of thousands of images per cluster per yearHow did we get here? What are our goals?

Equipment: 12” Meade Schmidt-

Cassegrain

; Apogee AP6E

camera; SBIG STL-1001E camera

What We DoSlide3

Our Observational Goals:I. Brief changes in apparent stellar flux

Occultation and microlensing events Flare starsII. Very long timescale changes in stellar luminosity Luminosity stability Solar-like cycles6 Low-amplitude, ultra-long period pulsationIII. Traditional Stellar Variability

Surveys of new variable stars

Locate detached and semi-detached eclipsing binaries in clusters

1

Locate contact eclipsing binaries in clusters

2

Period/amplitude variations in contact systems

3

Period-to-period variability in long period variables

Search for cataclysmic variables in clusters

4 Search for transiting planets5 Rotating variable star periods in young clusters7

Wyithe, J.S.B, and Wilson, R.E. 2002, ApJ, 571, 293

Rucinski, S.M. 1998, AJ, 116, 2998

Paczynski, B., et al. 2006, MNRAS, 368, 1311

Mochejska, B.J., et al. 2004, AJ, 128, 312

Mochejska, B.J., and Stanek, K.Z. 2006, AJ, 131,1090

Lockwood G.W., et al. 1997 ApJ, 485, 780-811

Herbst W. and Mundt R., 2005, ApJ, 633, 967-985Slide4

SkyandTelescope.com - News Blog - A KBO in the Crosshairs

Posted By Kelly Beatty, June 29, 2010Slide5

All images acquired with a 12” Meade LX200 and Apogee AP6E

camera or SBIG STL-1001E cameraSlide6

Student Participation:

Ujjwal JoshiNathan RengstorfAndrea SchiefelbeinTodd Brown Brajesh LacoulKari FrankAlex NugentDrew DoescherAlex Sperry

Robyn

Siedschlag

Siri

Thompson

Matt Fitzgerald

Heather Lehmann

Amalia

Anderson

Hilary TeslowSteve DignanKirsten StrandjordDonald Lee-Brown

Zebadiah

Howes

Buena Vista

Univ.

Travis

DeJong

Dordt

College

Forrest Bishop

Decorah High

School

Support: Roy J. Carver Charitable Trust (Grant #00-50)

Luther College

R.J. McElroy Trust/Iowa College Foundation Slide7

OUR M23 DATA SETS

Duration (s)# Nights

Total Images

Date Range

3.5

25

45,000

19 June 2003 – 8 Sep. 2003

2.5

20

45,000

23 June 2005 – 30 Aug. 2005

5.0

37

49,000

28 Mar. 2006 – 25 Sep. 2006

2.8

49

91,000

9 Mar. 2007 – 27 Sep. 2007

3.5

53

82,000

3 Mar. 2008 – 16 Sep. 2008

3.5

45

50,000

11 Mar. 2009 – 17 Sep. 2009

3.5

~30

~32,000

24 Feb. 2010 – presentSlide8

From http://rst.gsfc.nasa.gov/Sect20/sun_mw+.jpgSlide9

DATA PROCESSING

All Analysis done with code developed in IDLCALIBRATIONDark Noise CorrectionFlat FieldingALIGNMENT Use a single frame for entire data set

STAR ID & EXTRACTION

Aperture photometry for signal determination

256 Background regions

INTRA-NIGHT NORMALIZATION

INTER-NIGHT NORMALIZATION

MAGNITUDE CONVERSIONSlide10

Frame Normalization

Identify four reference images from throughout the nightCalculate average flux for each star in all four frames – this is the reference signalDetermine the signal of each star in the frame to be normalized – this is the sample signalCalculate (ref. signal/sample signal) for each starNormalization factor = median of all ratios in (4)Slide11
Slide12
Slide13

Types of Variable Stars Pulsating (e.g., Mira, b Cephei,

d Cephei, d Scuti, RR Lyrae, a Cygni) Eclipsing (e.g., W UMa, Algol–type, b Lyrae) Cataclysmic RotatingSlide14

From Contemporary Activities in Astronomy, 2nd ed.

by Hoff and Wilkerson, Kendall-Hunt, 2003Slide15

We have identified 7 eclipsing binary systems in the field; they have periods ranging from 5 hours to several days.Slide16

From Variable Stars by M. Petit, Wiley and Sons, 1987

We see mostly SR and Mira starsIn the GCVS SR and Mira stars are about equally commonMiras have been better studied than SRs but still not well understoodSlide17

From

Mattei & Foster and Aslan & Yeśilyaprak in Variable Stars as Essential Astrophysical Tools (2000)Slide18
Slide19
Slide20
Slide21

Is this a variable star?Slide22

We search for correlation in the signal using a modified f-test.Define :f = variance of full data set/variance of consecutive night differences81 times we have data on a night when we had data the previous nightRestrict our work to stars that appeared in our data at least 50% of the time 1566 stars.Compute f for stars in chunks of ~100 stars of similar brightness; define f-stat = (f-

m)/sSlide23
Slide24

169 stars have f-stat >2.0;

95 have f-stat >3.0; 58 have f-stat >4.0; 38 have f-stat > 5.0 Slide25

Many more semi-regular than Mira stars; perhaps a break in the distribution.Slide26

The LPV stars are red, as expected.Slide27
Slide28

CONCLUSION

At least 50 to 100 (3 to 6%) of the stars in our field are classically variable. SR stars outnumber Miras by a large margin. The distribution of periods might be bi-modal. Stars with secular variations in measured signal appear to have gotten brighter more commonly than dimmer. Results are uncertain.

Need better color measures and spectra. Need to monitor the field for several more years to understand secular variations and changes in our variable stars.