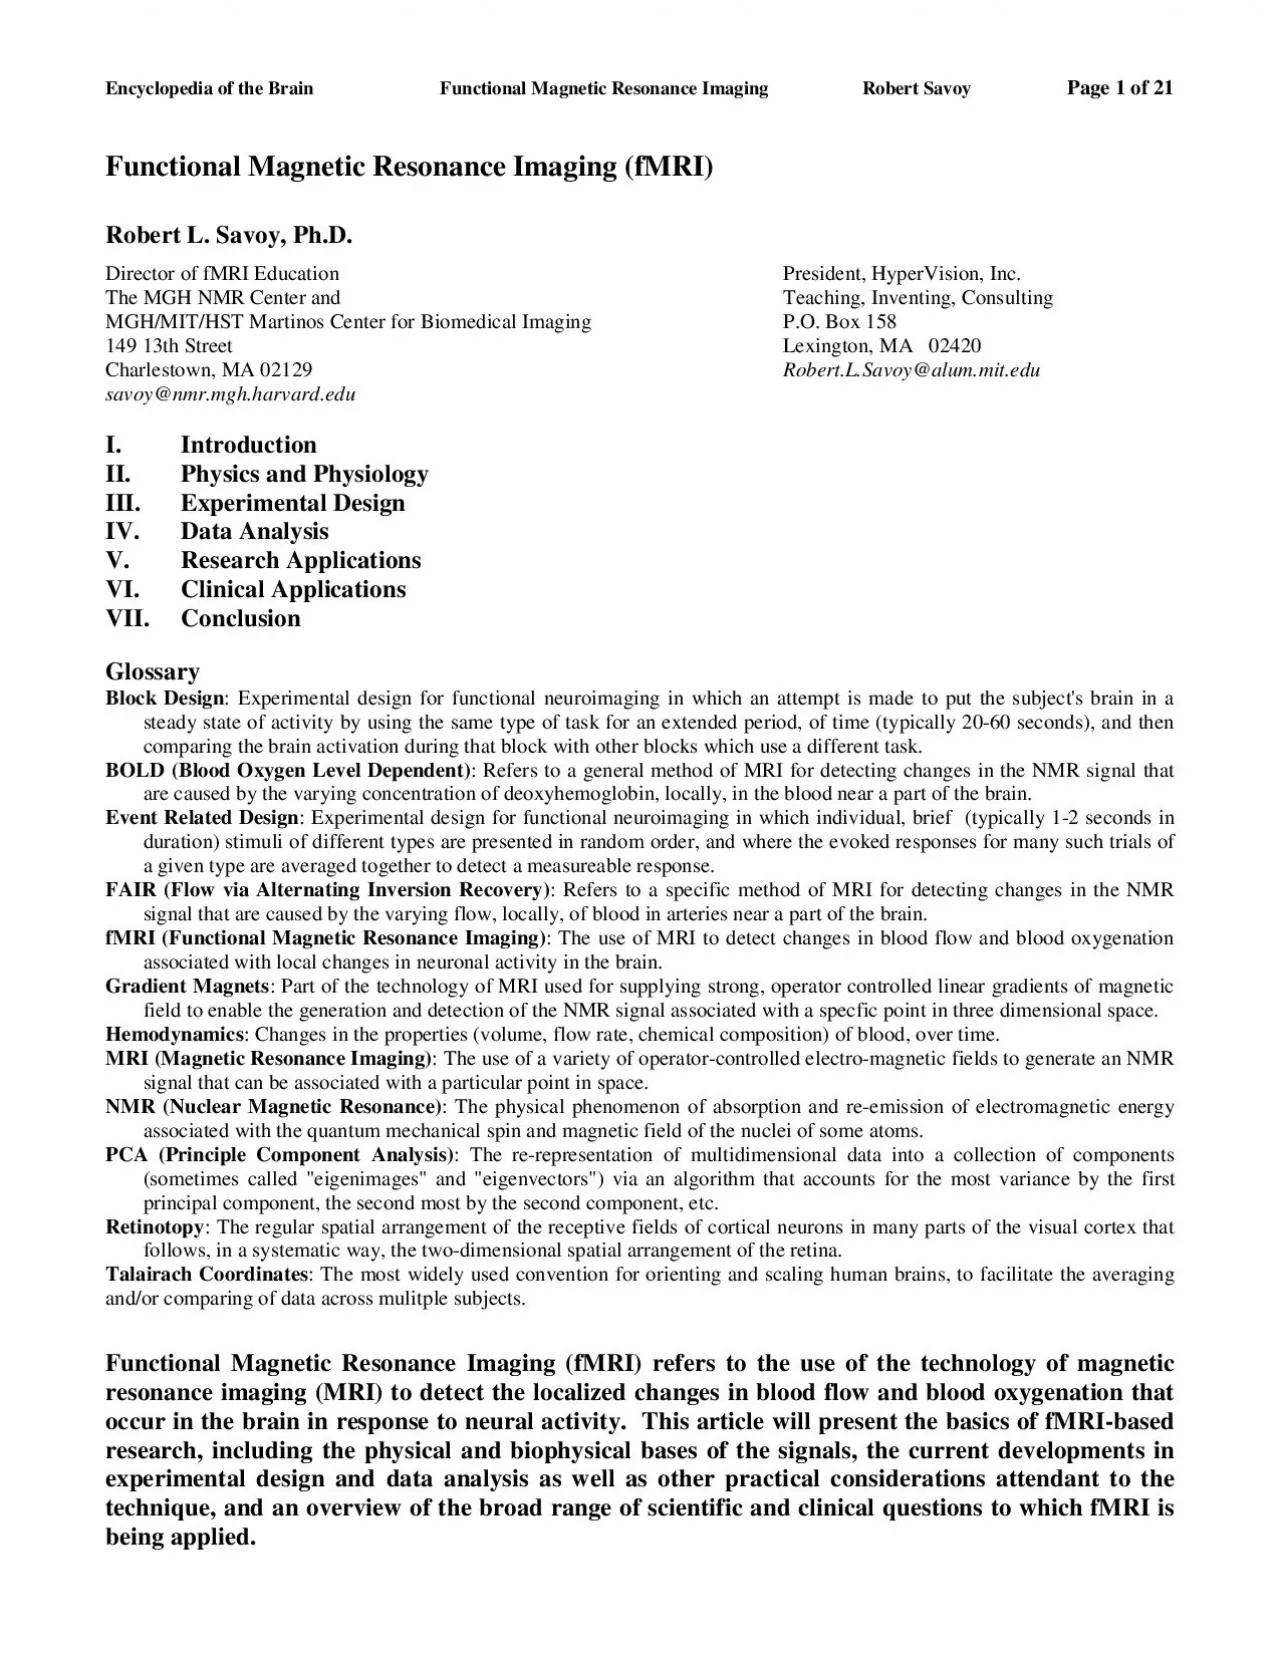
/
Encyclopedia of the Brain Functional Magnetic Resonance Imaging Robert Encyclopedia of the Brain Functional Magnetic Resonance Imaging Robert

Encyclopedia of the Brain Functional Magnetic Resonance Imaging Robert - PDF document

daniella
daniella . @daniella
Follow
343 views
Uploaded On 2022-09-23

Encyclopedia of the Brain Functional Magnetic Resonance Imaging Robert - PPT Presentation

Encyclopedia of the Brain Functional Magnetic Resonance Imaging Robert Savoy Page 2 of 21I Introduction It has long been known that there is some degree of localization of function in the human brain ID: 955661

fmri brain imaging data brain fmri data imaging functional mri magnetic activity stimuli signal images subjects time based field

Share:

Link:

Embed:

Download Presentation from below link

Download Pdf The PPT/PDF document "Encyclopedia of the Brain Functional Mag..." is the property of its rightful owner. Permission is granted to download and print the materials on this web site for personal, non-commercial use only, and to display it on your personal computer provided you do not modify the materials and that you retain all copyright notices contained in the materials. By downloading content from our website, you accept the terms of this agreement.


Presentation Transcript

Encyclopedia of the Brain Functional Magnetic Resonance Imaging Robert Savoy Page 1 of 21Functional Magnetic Resonance Imaging (fMRI) Robert L. Savoy, Ph.D. Director of fMRI Education President, HyperVision, Inc. The MGH NMR Center and Teaching, Inventing, Consulting MGH/MIT/HST Martinos Center for Biomedical Imaging P.O. Box 158 149 13th Street Lexington, MA 02420 Charlestown, MA 02129 Encyclopedia of the Brain Functional Magnetic Resonance Imaging Robert Savoy Page 2 of 21I. Introduction It has long been known that there is some degree of localization of function in the human brain, as indicated by the effects of traumatic head injury. Work in the middle of the 20th century, notably the direct cortical stimulation of patients during neurosurgery, suggested that the degree and specificity of such localization of function was far greater than had earlier been imagined. One problem with the data based on lesions and direct stimulation was that the work depended on the study of what were, by definition, damaged brains. During the second half of the 20th century, a collection of relatively non-invasive tools for assessing and localizing human brain function in healthy volunteers has led to an explosion of research in what is often termed “Brain Mapping”. The tool that has been developing the most rapidly, and the tool that supplies the best volumetric (three dimensional) picture of activity in the human brain at this time, is called “Functional Magnetic Resonance Imaging” (fMRI). Functional MRI uses the physical phenomenon of Nuclear Magnetic Resonance (NMR) and the associated technology of Magnetic Resonance Imaging (MRI) to detect spatially localized changes in hemodynamics that have been triggered by local neural activity. It has been known for more than 100 years that neural activity causes changes in blood flow and blood oxygenation in the brain, and that these changes are local to the area of neural activation. Techniques using radioactive tracers were developed in the middle of the 20th century to detect metabolic activity correlated with neural activation, and to detect blood volume changes correlated with neural activation. In the early 1990s the technique of magnetic resonance imaging (MRI) was successfully adapted to measuring some of these effects non-invasively in humans. The development of functional MRI has led to a dramatic increase in neuroscience research in human functional brain mapping across the spectrum of psychological functions: from sensation, perception, and attention to cognition, language, and emotion, in both normal and patient populations. Functional MRI makes the future of functional brain imaging particularly exciting for at least three reasons. First, fMRI does not involve ionizing radiation, and therefore it can be used repeatedly on a single subject and even child volunteers. This permits longitudinal studies and it permits improvement in signal-to-noise ratios if the task being used elicits the same general response when repeated multiple times. Second, technical improvements in fMRI (due to more powerful magnets, more sophisticated imaging hardware, and the development of new methods of experimental design and data analysis) promise to yield improvements in spatial and temporal resolution for the technique, itself. And third, there is a growing effort to integrate the findings based on fMRI with those from other techniques for assessing human brain function, such as electroencephalography (EEG) and magnetoencephalography (MEG), which inherently have much greater temporal resolution. It is likely that functional brain imaging will make great strides in the coming years, but the associated technologies are complicated. In particular, to understand the technique of fMRI, one must consider a collection of inter-related issues, from physics and physiology to the practicalities of experimental design, data analysis, safety and costs. (References listed at the end of this entry include an excellent history of the early development of blood-based functional brain imaging by Marcus Raichle in the book edited by Arthur Toga and John Mazziotta. For a general overview of human brain mapping see the article by Robert Savoy. For a thorough discussion of NMR and MRI, see the book by Stewart Bushong. For an engaging discussion of the application of brain mapping techniques in neurosurgery, see the book by William Calvin and George Ojemann. Advanced issues related to fMRI can be found in the book edited by Chrit Moonen and Peter Bandettini, with chapters 39-45 describing clinical applications. The remaining reference articles elaborate some of the specific applications mentioned in the text of this entry.) II. Physics and Physiology Magnetic resonance imaging operates by creating and detecting a signal generated by the physical phenomenon of nuclear magnetic resonance (NMR). While an in-depth explanation of the physics of NMR and the technology of MRI are beyond the scope of the present article, a basic understanding of how an MR scanner operates is useful in discussing functional MRI in its applications to psychology and medicine. The discussion, below, is based upon a description of the “classical electrodynamics” picture of nuclear magnetic resonance and m

agnetic resonance imaging. A more rigorous and complete treatment of NMR would require quantum mechanics, but MRI is best understood in terms of classical electrodynamics. II.A The NMR Signal To begin an MRI session, the subject is placed horizontally into the bore of a high field magnet. In a typical clinical MRI system this magnet has a field strength of 1.5 Tesla. A small fraction of the hydrogen nuclei (single protons) of the water molecules in the body of the subject become aligned with the field of this magnet. (Many other atoms and nuclei with magnetic moments are also aligned, but for the purposes of this article and almost all fMRI applications, it is the hydrogen nuclei of water molecules that are the source of the signal.) The hydrogen nuclei are oriented in a random collection of directions, relative to the main magnetic field, but there is a small statistical preference to have the longitudinal component of their orientations (i.e., the component in the direction of the main magnet) to be aligned with the main field. To the extent that a proton is not perfectly aligned with the main magnet, it will precess (spin) around the orientation of the main magnet. However, because the orientation of each proton is random (except for the component along the direction of the main field), and because it is only the randomly oriented transverse components (i.e., the components perpendicular to the main Encyclopedia of the Brain Functional Magnetic Resonance Imaging Robert Savoy Page 3 of 21field) that generate a signal, the collection of spinning protons do not yield a net, detectable magnetic field. Application of a radio frequency (rf) pulse of magnetic energy, presented at the frequency of the precession (i.e., the resonant frequency) causes all the hydrogen nuclei to change orientation (nutate). By controlling the power and duration of the rf pulse, the nuclei can be rotated to any desired angle relative to the main magnetic field. Typically, the parameters of the device are set so that the protons are rotated 90°. When the protons continue to precess in this new orientation, the net magnetic field that was originally induced in the body by the main magnet—and which was previously aligned with the main magnet—is now oriented 90° away and thus generates a detectable, changing magnetic field as it spins (precesses). A coil of wire around the subject will have a current generated within because of the changing magnetic field (Faraday's Law). This current is the raw signal detected in an MRI scanner. (See Figure 1 and its caption.) II.B Relaxation The signal thus generated decays exponentially over time due to a number of processes. If the raw, exponential decay of the signal is measured (without doing anything else to create images), the process takes about 100 milliseconds and the exponential time constant associated with that decay is conventionally called "T2*" (read "Tee-Two-Star"). This B0M0RFSignal 00 RF pulse applied Outside the magnetInside the magnet Figure 1. The Basics of the NMR Signal The text of section II.A is represented here in a simplified, cartoon form, with the story proceeding from left to right. Protons can be thought of conceptually aspositively charged spheres which are always spinning, and this spin about anaxis gives the proton an inherent orientation as well as a net magneticmoment along the axis of the spin. Before entering the magnet, the protons (with their magnetic field and spin direction indicated by the arrow) are randomly oriented. There is no main field surrounding the body (B=0) and there is no induced field within the body (M=0). The body is placed in the main magnet (B��0). All the protons immediately start precessing in a direction around B, but because the orientation and phases are random, there is no net signal. After a few seconds, a small fraction of the protons (indicated in red) change orientation to line up with B, which results in the creation of a net magnetic field in the body itself (M�0) oriented in the same direction as B. The individual protons are still precessing, now with a common net orientation, but the components of that rotation perpendicular to B are still random, so there is no detectable signal. A radio frequency (RF) pulse is applied for a brief period of time, causing all the protons to change their orientation by 90°, so that the net induced magnetic field is now perpendicular to B. Now the individual precessing protons are aligned in such a way that the common component of orientation (M) goes around B in a perpendicular direction, and generates a macroscopically detectable current—the signal. The strength of that signal decreases exponentially with time, for a variety of reasons described in section II.B. Encyclopedia of the Brain Functional Magnetic Resonance Imaging Robert Savoy Page 4 of 21decay in the measured signal is driven by a number of different physical processes. First, the protons slowly (on the time scale of seconds for most brain tissue) re-align with the main magnet. This is called “longitudinal relaxation” and the time constant associated with this exponential process is called "T1". Second, the signal generated by the collection of precessing protons is weaken

ed by the fact that each individual proton experiences a slightly different local magnetic field due to interactions with nearby water molecules and other biological tissues, and thus precesses at a slightly different frequency from its neighbors. With time (typically on a scale of tenths of seconds for most brain tissue) these protons get out of phase, so that their respective magnetic fields are no longer lined up and therefore do not generate a detectable, macroscopic signal in the surrounding coil of wire. This is sometimes called the "spin-spin component of transverse relaxation" because it is based upon the interaction of the spins (which imply magnetic fields) of nearby nuclei. If the magnetic field were perfectly uniform, then the net decay rate of the signal would be given by the exponential decay rate "T2", which is driven by the combination of spin-spin transverse relaxation and the T1 longitudinal component. In the brain tissue of interest, T2 is almost entirely determined by the spin-spin relaxation. In reality, there are other sources of magnetic field non-uniformity. Imperfections in the main magnet, variable magnetic susceptibility of the differing parts of the human body that has been inserted into the magnet, and changes in blood chemistry caused by externally injected "contrast agents" all contribute to non-uniformities in the magnetic field experienced by the precessing protons. Most importantly for fMRI, some chemicals that occur naturally in the body also distort the magnetic field. In particular, deoxyhemoglobin is such a molecule, and as its local concentration is varied, the amount of distortion also varies. The rate of exponential decay of the NMR signal is influenced by all of these factors. A cartoon of this signal is shown in the lower right corner of Figure 1. II.C Creating an Image The preceding description yields a single number: T2*, the decay rate of the net NMR signal. This signal is conventionally called the "free induction decay" (FID) of the NMR signal because it is what is elicited when nothing else is done to the protons—that is, if the system were left free to decay at its own rate. However, this signal represents the net effect of inducing an NMR signal from the entire volume of tissue being subjected to the main magnet and the orientation-flipping rf-pulse. To create an image in which different NMR signals are measured for different points in the three dimensional volume, non-uniform magnetic fields are applied intentionally. The basic idea is to use linear magnetic field gradients, applied at various times and in various orientations, to distinguish the NMR signals arising from different points in the three-dimensional volume. (The application of these non-uniform magnetic fields causes the raw NMR signal to decay even more rapidly than the FID, but the signal can still be measured, and various procedures can be used to create "echos" which enable the recovery of more information.) The technology of MRI is based on the flexible (but complicated) application of multiple rf-pulses and multiple gradients, synchronized precisely (and typically described in a “pulse sequence diagram”). The pulse sequence diagram indicates how a given slice of the brain is selected for imaging, how individual volume elements (“voxels”) are detected within each slice, and how the resulting signals are preferentially selected to obtain information about arterial blood flow, or about the concentration of deoxyhemoglobin in venous blood flow. Some imaging pulse sequences use multiple rf-pulses in the generation of NMR signals that will yield a single plane of imaging data. Some imaging pulse sequences (such as echo-planar-imaging, "EPI") generate data for an entire plane from a single rf-pulse. EPI imaging is rapid (with an entire plane collected in under 50 msec), but is associated with more expensive hardware, and various limitations in spatial resolution or susceptibility to imaging artifacts and distortions. II.D Contrast in an Image As with any imaging modality, the key variable in producing a meaningful image is contrast. The signal measured at one point in space or time must be higher or lower than the signal at another point, and the variation in signal intensity across the image should systematically follow some variable of interest. In the endeavor of brain mapping, the ultimate variable of interest is neural activity. In order to measure local brain activity with magnetic resonance imaging, one must exploit a chain of indirect linkages from neural activity (a constellation of electrical and chemical events) to changes in brain physiology and metabolism and finally to changes in the magnetic properties of substances within the brain. Anything that causes a change in the NMR signal from a given voxel relative to other voxels at the same time is a source of contrast in the image. The density of protons in a given voxel (due to chemical composition) is one such source of contrast, though not an important one in fMRI. More commonly, it is the variation in rates of relaxation from voxel to voxel that generates contrast in the image. In the earliest fMRI studies, exogenous contrasts – chemicals injected into the bloodstream of the subject – were used to ob

tain contrast. These blood-borne chemicals locally distorted the magnetic field, thus allowing increased blood perfusion to be detected. Subsequent studies demonstrated that endogenous contrast agents (i.e., naturally occurring molecules in the body, such as the concentration of deoxyhemoglobin in the blood) could also yield sufficient contrast between different states of neural activity. The use of endogenous contrast agents obviated the need for injecting foreign molecules into the bodies of normal (healthy) subjects, and this is one of the key reasons that fMRI has become so popular as a technique for assessing human brain function. In the short history of fMRI, a wide variety of Encyclopedia of the Brain Functional Magnetic Resonance Imaging Robert Savoy Page 5 of 21techniques which produce various contrasts have been developed for detecting changes in brain physiology. II.E Neural Activation MRI When neurons are active in the brain, there is an increase in blood flow and blood volume local to that region of activity. MRI can be used to detect the change in blood flow directly. The idea is that, when fresh blood flows into the slice of the brain that is being imaged, it will have a different “spin history” (i.e., it will not have recently been hit by an orientation-flipping rf-pulse), and will thus have a greater degree of alignment with the main magnet. When another rf-pulse is applied, the fresh blood will have a greater concentration of aligned protons to flip, and will thus yield a greater NMR signal. The imaging of this signal happens on a time scale rapid with respect to the blood flow, so the change is detected. This phenomenon is the basis for one kind of imaging in fMRI. It is largely sensitive to changes in arterial blood flow (where flow is the fastest). There is a second, and more commonly used, process that yields an fMRI signal. The neural activity that elicited the local increase in blood flow and blood volume does not, surprisingly, elicit a correspondingly great increase in oxygen utilization. That is, while the neural activity leads to a small increase in oxygen utilization, it is dwarfed by the increase in blood flow. Thus, there is an increase in oxygenated hemoglobin in the venous portion of the circulatory system near the site of neural activity (as well as down stream from that site). The combination of increased oxygenated hemoglobin and increased blood flow results in a decrease in the instantaneous concentration of deoxygenated hemoglobin on the venous side of the capillaries. Deoxygenated hemoglobin (unlike oxygenated hemoglobin) is a strongly paramagnetic biological molecule, and it distorts the magnetic field locally. Thus, a decrease in the local concentration of deoxyhemoglobin leads to a more uniform magnetic field locally, and to a longer time period during which the orientations of precessing protons stay in phase. Thus, the NMR signal in a region of decreased deoxyhemoglobin concentration increases relative to its normal (neuronally resting) state. This phenomenon is called the BOLD (Blood Oxygen Level Dependent) effect. It is the major source of contrast in most functional MRI experiments. II.F Other Technical Issues in MRI Operationally, functional MRI differs from conventional MRI in two basic respects. First, it is tailored to be sensitive to contrasts in blood flow and/or oxygenation that reflect neural activity. Second, it is typically conducted with special hardware that permits the very rapid variation of the magnetic field gradients that are needed to create images. This permits much more rapid acquisition of whole-brain volumes than is conventionally done in MRI. This rapid data collection is crucial in most modern fMRI-based experiments, as will become apparent in the section on Experimental Design, below. Functional MRI is made practical and powerful by virtue of special pulse sequences (such as echo planar and spiral scanning) and hardware which permit the encoding of a brain slice while using a single RF pulse, allowing the entire brain to be imaged in a matter of a few seconds. A wide variety of different pulse sequences are used in fMRI, and this remains an area of continuing innovation. Moreover, the versatility of MRI for neuroscience extends beyond fMRI, and MR can also be used to assay various aspects of brain chemistry, through a technique known as magnetic resonance spectroscopy (MRS, a detailed of which is beyond the scope of the present article). Because some variants of MRS can measure the presence of brain metabolites at temporal resolutions on the order of minutes, and spatial resolutions not far from those of BOLD fMRI, MRS is in many ways conceptually related to fMRI. II.G Summary A strong, spatially uniform magnetic field aligns a small but significant fraction of the hydrogen nuclei of water molecules in a brain. A carefully controlled sequence of gradient fields and rf-pulses is used to generate NMR signals that can be reconstructed to form a three-dimensional image in which contrast is dependent, in part, on the blood flow and/or oxygenation changes caused by neural activity. Thus, MRI can be used non-invasively to detect changes in local neural activity in the human brain. III. Experimental Desig

n Designing experiments for fMRI-based studies presents unique opportunities and challenges. First, fMRI (like PET using O) depends on the indirect signals generated by hemodynamic changes (i.e., changes in blood flow and/or blood chemistry) rather than the more direct electro-chemical changes associated with neural activity. Second, there are numerous technical challenges that follow from the particular physics of MRI when used for high-speed speed imaging of the human brain. Third, there are a number of practical considerations associated with both safety and the physical requirement for minimum movement of the subjects in fMRI studies that add to the challenges of fMRI experimental design. All of these factors affect (and, in turn, are affected by) the current practical and future potential limits of spatial and temporal resolution associated with fMRI. Finally, as with any experimental approach to important questions concerning human psychology, the most fundamental and difficult problems arise in choosing tasks and stimuli that allow one to be convincing to one's self and to one's audience that the psychological question being asked is truly addressed by the experiment being performed. (Can you convince your audience, for example, that when you use fMRI to measure changes in brain activity during the color Stroop task, that you actually studying some general attribute of inhibition and higher cognitive function?) Encyclopedia of the Brain Functional Magnetic Resonance Imaging Robert Savoy Page 6 of 21IIIA. Experimental Design and Hemodynamics Functional MRI is dependent upon hemodynamic changes rather than the electrical consequences of neural activity. The spatial and temporal characteristics of these hemodynamic effects must be taken into account when designing experiments and analyzing the data from these experiments. The spatial characteristics arise from the underlying vasculature; the temporal characteristics include a delay in the onset of detectable MR signal changes in response to neural activity and a dispersion of the resulting hemodynamic changes over a longer time than the initiating neural events. With regard to the temporal aspects of the hemodynamics, functional MRI experiments fall into two broad categories: “block” designs and “event-related” designs. In block designs, the experimental task is performed continuously in blocks of time, typically 20-60 seconds in duration. The idea here is to ignore the details of the temporal characteristics by virtue of setting up a "steady state" of neuronal and hemodynamic change. The fact that there is a brief delay before the MR signal changes are detected is often unimportant when analyzing a long block of steaty-state activity. This approach is conceptually simple; it is analogous to older PET experimental designs; and it is of great practical importance for fMRI because it is the optimal technique for detecting small changes in brain activity. The major weakness of block design is the requirement that all the stimuli or task characteristics remain unchanged for tens of seconds, precluding the use of many classic psychological paradigms (such as the "oddball" scheme). The other major approach—"event-related" design—makes use of the details of the temporal response pattern in the hemodynamics, as well as the largely linear response characteristics associated with multiple stimulus presentations. In event-related designs, the different stimuli are presented individually in a random order (rather than in blocks of similar or identical stimuli) and the hemodynamic response to each stimulus is measured. Event-related designs are further subdivided into “spaced single trial” designs and “rapid single trial” designs. In spaced single trial designs, stimuli are presented with a long interstimulus interval (ISI) relative to the hemodynamic response to a single stimulus. Specifically, an ISI of at least 10 seconds, and more typically 12-20 seconds is used in an effort to allow the hemodynamic response to each stimulus to return to its resting state before the next stimulus is presented. This approach is conceptually simple, but very inefficient in its use of imaging time—a great deal of imaging time is spent collecting data when the MR signal variation due to hemodynamcs is small or not detectable. (This is not only wasteful of expensive imaging time, but it is also boring for the subject, who is only doing something once every 15 seconds or so.) In contrast to spaced single trial designs, rapid single trial designs take advantage of the linearity and superposition properties of the hemodynamic responses to neural activity. To a first approximation, the hemodynamic changes associated with multiple stimulus presentations are additive, and, when presented at slightly times, are simple time-shifts of each other. This permits the much more efficient design of experiments in which novel stimuli appear in quasi-random order and with variable inter-stimulus intervals (typically presenting a new stimulus every 1-3 seconds, on average). The associated data analysis is more difficult because the hemodynamic responses to the different stimuli overlap in time (and there are consequent weaknesses relative to block designs in terms of the de

tection of small effects) but the rapid single trial designs are particularly powerful and useful when it is essential to have random order in the presentation of individual stimuli—i.e., in the situation where a block design with long periods of the same type of stimulus would not permit the desired comparisons, for neural activations. It is also more efficient in the use of imaging time and more engaging (less boring) for the subject. One final approach to experimental design should be mentioned. All of the above techniques typically make use of averaging over multiple instances of a given trial type. In block design the trials all occur together, so the averaging is done as much by the hemodynamic and neural systems as by any data analysis software. In event related designs the averaging over the effects of multiple stimulus presentations is done explicitly in software during data analysis. It is possible, however, to analyze spaced single trial data on the basis of activation from a single event (rather than averaging over multiple instances of the same trial type). This technique has not yet been widely applied, primarily because the elicited signals to single stimulus events are generally weak. However, high field MRI systems, and the selection of experimental paradigms that elicit strong, focal neural activity, have been used to demonstrate the feasibility of single event fMRI. IIIB Spatial and Temporal Resolution in High Speed MR Imaging The physiology of the circulatory system and the physics of the MR imaging devices constrain the spatial and temporal resolution of fMRI. It is routine, today, to obtain 1mm x 1mm x 1mm structural MR images, and 5mm x 5mm x 5mm functional MR images. The temporal resolution of fMRI is on the order of 1-3 seconds. Neither the spatial nor temporal resolution numbers are indicative of absolute limits in terms of the physiology or the imaging hardware. Rather, they represent a snapshot in the development of ever-improving resolutions. Moreover, at any give stage of technical development in MRI, the various imaging parameters can be manipulated to emphasize one aspect of resolution in exchange for another. When investigators approach experimental design in fMRI, they must recognize that the key physical variables—spatial resolution, temporal resolution, brain coverage, and signal-to-noise ratio—are quantities whose values can be manipulated by trading one off against the others. For example, extremely high spatial resolutions are possible, but the techniques needed to achieve them involve reduced temporal resolution, limited brain coverage, and/or decreased signal-to-noise ratio. Alternately, extremely rapid imaging can be performed, but at Encyclopedia of the Brain Functional Magnetic Resonance Imaging Robert Savoy Page 7 of 21the cost of spatial resolution, and/or brain coverage. Tradeoffs will continue to exist even as the overall power of scanning technology improves. As an indication of the numbers associated with these issues, and the manner in which they are changing, consider the issue of the rate at which individual images can be collected. The first whole-body high speed (EPI) fMRI system could collect 20 images per second for about a minute, and then it would overheat. At a slower operating rate of 10 EPI images per second (which was still very fast in 1992), there was no overheating, but the time to reconstruct the images from the raw data was so long that the subject (in an fMRI experiment) had to wait a long time between scans. At an even slower rate of 5 EPI images per second, the scanner could operate continuously and reconstruct the images in real time—but the memory for buffering those images would fill after about 2000 images. In contrast, modern machines can operate at 20 images per second continuously. Analogous improvement is ongoing, in all of the mentioned domains. Higher field MRI (from 3 to 8Tesla) will improve spatial resolution and will yield the added signal that may improve the practicality of "single-event" ƒMRI designs and the possible use of the "initial dip" in oxygenation to improve temporal resolution. However, these high field machines are not yet as widely available as 1.5 Tesla machines, and are considerably more expensive, difficult, and dangerous to use. With respect to the current state of affairs, the message for experimental design is simply that these resolution limits must be taken into account. There is little point to designing a conventional experiment to detect changes in a structure that is much smaller than your spatial resolution permits, nor in designing a study that requires the detection of temporal changes that are too rapid for your current technology. At the same time, because these imaging parameters can be traded off, one should not dismiss difficult-sounding experiments too quicky! IIIC. Practicalities: Psychophysiological Laboratory in the Magnet; Safety; Costs The physical properties of MRI, as well as the financial costs, place a number of practical constraints on the design and execution of fMRI-based studies, and thereby impact experimental design. As indicated above, the experiments take place in the bore of a large, powerful magnet. The presence of this large, static magn

etic field precludes the participation of subjects who would be adversely affected by it. For example, subjects with pacemakers or other forms of implanted metalic devices that would be subjected to strong forces by the magnet are clearly ineligible. The fact that subjects must lie in a relatively confined space rules out volunteers who suffer from claustrophobia. The physical position and limitations of subject's movement also constrains various experimental procedures that would be simple in an ordinary behavioral laboratory. (See Figure 2 for a schematic diagram of a typical fMRI psychophysical set up.) In addition to the main, static magnetic field, there are strong varying electromagnetic fields from the gradient magnets (for generating images) and from the radio frequency oscillator (for flipping the protons to obtain the NMR signal). Each of these fields has associated safety considerations. For the most part, this is a minor issue at 1.5Tesla. It can be more of an issue for some pulse sequences at higher fields. The manufacturers of MRI scanners are required to build in various safety measures to protect subjects (such as calculating the heating affects of the rf pulses for a person of a given size and weight). Nonetheless, each imaging facility normally includes a screening form (and sometimes a metal detector) to prevent the inadvertent harming of subjects from a collection of (sometimes not-so-obvious) potential dangers. In addition to these safety considerations, the physics of MRI has other practical consequences. All of the devices used to present stimulation (visual, auditory, etc.) and to obtain behavioral and physiological response measures (button pushes, breathing and heart rate, etc.) must be constructed in an MR-compatible manner. As fMRI has become a more wide-spread enterprise, various companies have made it a business to supply such equipment. However, custom design of devices for specialized experiments is still common. The single most vexing problem in the practical application of fMRI is head movement. While pulse sequences have been developed to collect an entire slice of brain data in less than 50 msec, and multiple slices (for entire brain coverage) can be collected in a 2-3 seconds, the amount of information mirrorrear projection LCD projector with custom lensheadphonesbutton-boxpatient table Figure 2. Subject in the Magnet Functional MRI is conducted in the environment of a Magnetic Resonance Imaging suite. There are many ways to present stimuli and obtain responses from the subject in such a suite, but all must be compatible with the difficult and hostile electro-magnetic environment of MRI. In the example shown, visual stimuli are projected onto a rear-projection screen and are viewed by the subject through a mirror. Auditory stimuli can be presented via MR-compatible headphones or by the speaker systems typically included in MRI scanners. Finally, subject responses can be collected using an MR-compatible b utton box. A variety of commercial and custom approaches to the problems of presenting stimuli and recordingresponsesinfMRIhavebeendeveloped Encyclopedia of the Brain Functional Magnetic Resonance Imaging Robert Savoy Page 8 of 21in each such image is limited. That is, the amount of functional contrast in the images—the differences in the signals between two experimental states—is small. To make up for this, many images are collected over extended periods of time: at least minutes, and sometimes hours. During these time periods it is important that the subject's head move as little as possible. A variety of techniques are used to encourage subjects to keep their heads as motionless as possible, but none is perfect. For young, well-motivated healthy subjects, this is usually not an insurmountable problem. For older, patient populations, it can be the main reason that data is discarded. While there are data analytic procedures for transforming images of moving heads back to a fixed position, these procedures are limited. Indeed, because the moving head actually distorts the main magnetic field in different ways, no motion correction algorithms can fix the problem perfectly. (There are many extra coils in an MRI scanner that are used to make the main magnetic field as uniform as possible, despite the irregularities introduced by the presence of a human head in the bore of the magnet. These "shimming" coils are supplied with electric current designed to minimize the magnetic field distortions introduced by the head at the beginning of a scanning session. However, they are not modified on the fly, during the session, so any subject head movement results in more than just a displacement of the image; it also causes distortions that are much harder to Finally, it should be noted that MRI time is not cheap. Charges for an hour of clinical imaging are numbered in the hundreds of dollars. Therefore, when designing a study, the total number of imaging minutes is one of the parameters that must also be considered in the tradeoffs. IIID. Comparing Activation States Fundamental to the understanding of fMRI as a tool for representing the localization of brain function is the idea that a single image, in isolation, conveys little if any useful informat

ion. Rather, it is the comparison of multiple images that are collected during different states of neural activity that supply interpretable data. Note that this statement is true for structural MR images. A single structural image conveys a great deal of useful information because data about is not sought (except on a much longer time scale, as in developmental and longitudinal studies of brain structure). In contrast, functional imaging data is almost exclusively about in neuronal activity. One might ask: Why isn't a single image, collected during rest, a useful definition of the "resting" or "neutral" or "idling" state of the brain? In some ways, a single image might be interpretable this way. Indeed, some variants of PET can be used to yield a single snapshot of the metabolic state of the brain. However, the variation in local activity in the brain during "rest" is not very meaningful—the demonstration that one portion of the brain is more active during rest than another has limited value. On the other hand, the demonstration that a particular manipulation (of the stimulus ore task requirements for the subject) causes a localized change in neuronal activity is far more useful. The art of fMRI experimental design lies largely in the creation of tasks which accurately probe the cognitive function of interest. One natural way to design an experiment in functional neuroimaging is to create two tasks that are identical except for one small difference. This is the basis of the classic "subtraction" method originally delineated by Donders and widely used in cognitive research. Such experimental designs are sometimes called "tight" task comparisons. The difference between experimental conditions in a tight task comparison is either in the stimulus alone (while keeping the response task of the subject fixed), or in the response task alone (while keeping the stimulus fixed). Such an approach is particularly useful for testing specific hypotheses about the activation pattern in a single brain region. However, there are practical and theoretical reasons for including experimental conditions that are more broadly different from the main conditions of interest. Frequently this is accomplished via the use of a "low-level control task" such as simple visual fixation or rest. This has sometimes been called a "loose" task comparison. It is particularly useful for seeing the simultaneous activation of many areas of the brain. The loose task comparison not only provides an internal check for the integrity of the data collected (because it typically includes robust activations of no direct experimental interest, but the absence of which could indicate a problem with the subject, the machine, or the data analysis), but also serves as an important point of reference for observed differences within the tight task comparison. For instance, a difference between two conditions in a tight task comparison could reflect either an increase in activity in one condition, or a decrease in activity in the other. The addition of a loose task comparison provides a means of disambiguating such a situation by providing a baseline against which the two tight task conditions can be compared. More generally, it is essential to have at least two conditions to be compared, but the power of fMRI-based experiments to test interesting theories is greatly enhanced by the presence of more conditions in the design. Sometimes these multiple conditions are qualitatively different (as indicated above), but increasingly subtle experiments are being done that make use of quantitative (parametric) variation in the experimental conditions. In general, when attempting to model and understand the networks of the brain, all types of experimental sampling are needed. Finally, the critical importance (and occasional irrelevance!) of behavioral measures must be discussed. It might seem obvious that obtaining observable behavioral responses could only be a good thing in functional neuroimaging research. Certainly most investigators try to have an observable behavioral measure for their tasks, when possible. (In "imagination" studies, such as imagining visual images or imagining performance of a motor task, it is sometimes impossible to have an observable behavioral response measure, but even in the context of something as Encyclopedia of the Brain Functional Magnetic Resonance Imaging Robert Savoy Page 9 of 21"unobservable" as mental rotation, investigators have sometimes found ways to obtain associated reaction times and accuracy measures.) On the other hand, at least one prominent psychologist has argued against the necessity of behavioral response measures, suggesting that the imaging data are sufficient and that adding irrelevant behavioral tasks will only confuse the issue by eliciting neural activity unrelated to the particular cognitive task of interest. And several researchers have commented that, independent of anything else, it is good to have a behavioral task associated with the imaging study because it will help keep the subject awake in the scanner. Each of these observations has merit, but there are more important uses for behavioral response measures in most studies, and for some studies they are critical. Specifically, a

number of studies have made the analysis of the imaging data depend crucially on the observed behavioral responses. Examples from the study of memory and from the study of the effects of cocaine on brain activity are described in the “Research Applications” section. III.E Summary Experimental design in fMRI-based experiments is challenging, but rewarding. Practical limitations related to the safety and behavior of human subjects, technical limitations in MR imaging devices, underlying properties of the spatial arrangement of blood vessels and the temporal characteristics of the coupling between neuronal activity and blood flow are all intertwined. In addition to these technical considerations there is the art of experimental design associated with any question in understanding human psychology. The application of the technology of fMRI to neuroscience entails a collection of tradeoffs. Nonetheless, the current strengths of fMRI-based investigations include the best spatial and temporal resolutions for non-invasive, volumetric brain mapping, the most flexibility experimental designs, and a constantly-improving set of instrument-based limits to the technology's sensitivity and resolution. IV Data Analysis A typical fMRI scanning session lasts 1-2 hours and results in the collection of hundreds of megabytes of data. The theory and practicalities associated with processing that data are complex and evolving. In contrast to functional neuroimaging associated with PET—where the total amount of data is much smaller, where the understanding and agreement about the sources and nature of noise in the data is well-established, and where there is a consequent widespread agreement about the basic issues in data analysis—the situation with fMRI data is much more complex. The sources of machine-related noise in the raw MR images are relatively well-understood. However, the general consensus regarding noise in fMRI data is that the most important sources are physiologically based (in the subject) rather than machine based (from the scanner). There is less agreement about the details and the consequences of modeling these noise sources in terms of the practical consequences for data analysis. Perhaps even more importantly, the present (and future) spatial and temporal resolution of fMRI data encourages modeling of brain systems at a level that may substantially exceed that of previous volumetric imaging systems. Some of these advances—for example, the ability to obtain precise delineation of multiple visual areas in occipital cortex by virtue of their retinotopic regularities—require different kinds of data analysis, and different kinds of visualization tools than made sense in the context of systems with poorer spatial resolution. Finally, the ability to image the same subject multiple times, and the associated potential for the collection of many kinds of functional data from that same subject, encourages novel approaches to data analysis. Data analysis is a critical, still time consuming, and sometimes controversial part of ƒMRI-based experimentation. While the nature of many of the problems is well-defined, the appropriate solutions are not. There is general agreement on how to handle some of the issues associated with data analysis (e.g., algorithms to detect head movement and correct for head movement) but there are no universally agreed upon approaches to many other issues (e.g., the appropriate statistical tests to define the detection of neural activation, the best way to compare data across different subjects, and the best way to visualize and report the results of data analysis). There are a host of software tools for data analysis, each having its strengths and weaknesses. Because of the rapid development in all aspects of ƒMRI-based research, no de facto standard approach to data analysis has yet emerged. Figures 3 and 4 indicate some of the procedures that are discussed in more detail below. IV.A Preprocessing Before the essential part of data analysis can begin, a number of preliminary steps are typically taken. Some spatial smoothing and temporal smoothing may be applied, but the first and most important step is the assessment of subject head movement during the imaging ssession. The problem of subject motion is a pervasive one in ƒMRI, and arises not only in constraining experimental design but also in the analysis of images of a brain that may have moved over the course of an experiment. The high speed imaging techniques used in fMRI typically minimize the effects of movement in any one image. However, many images are collected in each run, which are typically 2-8 minutes long, and there are many runs in a typical 2-hour session, representing 40-200 brain volumes per session. Because the fMRI-based signal modulation is intrinsically small (typically 0.5-5%), data from all the images collected in these long runs are normally needed to gain statistical power. Thus, it is important that the images within a run and across runs are properly aligned. Head motion makes this process a challenge. In addition, even if the skull were perfectly immobile, the brain still moves. The pulsatile flow of arterial blood causes movement virtually everywhere in the brain, particularly in subcorti

cal structures. Encyclopedia of the Brain Functional Magnetic Resonance Imaging Robert Savoy Page 10 of 21For all of these reasons, the data analytic approach to motion detection and motion correction has been based on the brain images themselves, rather than on monitoring head movement externally. Efforts are made to minimize subject head movement, and it is not presently possible to correct for severe or rapid movement. (All the current algorithms for correcting head movement assume rigid motion of the head. While a single slice of brain imaging data is collected very rapidly compared to most head movement, the time needed to collect an entire brain volume—consisting of 20 or more slices—is much longer many head movements. Such motion cannot be corrected with these algorithms.) However, if the movement is not too great in amplitude and not too rapid, there are algorithms available in most ƒMRI data analysis packages that are adequate to detect the motion and to transform the data in an attempt to compensate for the effects of that motion. A key feature of these these algorithms is that they automatically reveal many kinds of movement, including stimulus-correlated movement. If the subject moves every time they are supposed to start a task, the movement could create MR signal artifacts that appear as a false activation signal. There is no good way to correct for such data and it must be detected and discarded. Subject movement is generally regarded as the biggest problem for getting consistent data in ƒMRI-based experiments. Experienced, well-motivated subjects who use bite bars in the scanner can routinely be expected to yield data free of serious motion artifact. In contrast, in studies with clinical patients or other difficult subjects, as much as 20-30% of data may need to be discarded because of subject motion. There are methods for helping to minimize physical motion during data acquisition and to detect and possibly compensate for it after data acquistion, but none of these is, as yet, fully satisfactory. IV.B Basic Detection of Change The first goal of any analysis of ƒMRI-based data is to determine whether the experimental manipulation has resulted in a measurable change in the MR signal, and to specify where in the brain, and when (in time) that change has occurred. In principle, any statistical method that can be applied to a time series can be used with fMRI data. In practice, the demands of the experimental paradigm, Raw Anatomica l Images Raw Functional Scans 3D Anatomical Volume Assembled Functional Images - 2D-3DFunctional-Anatomical Alignment- Talairach transformation3D Functional Data Statistical Tests3D Overlaid Activation MapData Preprocessing(motion correctiontemporal andspatial smoothing) transformationAnatomical Volume in Talairach Space Figure 3. Highlights of an fMRI Data Processing StreamData from fMRI-based experiments is analyzed in many steps. The number and order of these steps is still a topic of some controversy, with variations across laboratories and software packages. Figure 3 is a simplified representation of the generic steps. Both high resolution structural MRI images, and lower resolutionfunctional images pass through a variety of preprocessing steps. Early steps may transform the raw anatomical images from individual (two-dimensional) slices of the brain into volumetric (multi-slice, three-dimensional) arrays that are more suitable for the detection of head movement. At the same time, data is often transformed to a standard three-dimensional orientation and overallsize scale (Talairach coordinates). In addition to the essential step of detecting the presence of head motion in the data, several other (arguably optional) steps may be applied. Motion correction algorithms can help if head movement is not too large (though these algorithms are sometimes unnecessary or counterproductive if motion is small). There are both theoretical and practical reasons for smoothing the data in the spatial and/or temporal domains, though some investigators argue against performing these steps. Finally, statistical tests are performed, contrasting the data collected during different experimental conditions. The resulting statistical maps are typically thresholded and overlaid on anatomical images, as indicated in Figure 4. Further considerations are attendant to the comparisons across the brains of different subjects, as discussed in the text. (Activated areas, normally printed in color, do not appear in this gray-scale figure.) Encyclopedia of the Brain Functional Magnetic Resonance Imaging Robert Savoy Page 11 of 21limitations of the tool, and the capabilities of distributed software packages constrain the sorts of analyses that are typically performed. A few broad classes of common data analysis options are detailed below, though the presentation is not comprehensive. With the exception of Principle Component Analysis (PCA) and other multivariate techniques, each of these tests is applied at the voxel level. When these statistics are computed for each voxel in the brain, and the resulting collection of statistics is presented in the form of an image in which color or intensity is used to represent the value of that statistic, the result is called a

"statistical map" of brain activation. High speed imaging (e.g., EPI) is used to collect many images of the brain during each of the experimental conditions designed. The simplest (and, historically, the first) comparison was obtained by subtracting the average all the images collected during one condition from the average of all the images collected during another condition. The resulting "difference image" clearly showed areas that were brighter, indicating greater MR signal during one condition than another. This sort of comparison is the only one that, strictly speaking, is "subtraction", although the term is sometimes used informally during discussions of contrasts between conditions, even if those contrasts are based on some other statistic. Instead of subtracting (on a voxel by voxel basis) the averaged data from different conditions, the more general approach is to compute a statistic based on the collection of values at each specific spatial voxel, collected across the thresholdcolor look-up table transformationstatistical mapanatomical mapfinal overlaid activation mapthresholded activation mapColor Scale(shown here in black and white) Figure 4. Production of a Color-Coded Activation MapAfter preprocessing, comparison of the values of the functional MR images collected during different experimental conditions are used to generate a statistical map. The underlying question is whether the collection of values from one condition is likely to have been generated by statistically different levels of brain activity, when compared with the collection of values obtained during a second condition. These statistics are computed on a voxel-by-voxel basis, resulting in a spatial map (shown at the left, top row of the figure) in which gray-scale intensity indicates magnitude of the statistic. Middle grayrepresents little difference between the two experimental conditions in question; bright regions occur where the first condition elicited much stronger MR signals than the second condition; darker regions occur where the first condition elicited much weaker MR signals than the second condition. Because of the need to collect many functional images in a short period of time, functional images typically have substantially less spatial resolution than structural (anatomical) images. (These differences are a consequence of the different pulse sequences that are used to collect functional versus structural MRI data.)In order to combine information from the statistical map with the higher resolution structural images, two transformations are applied to the statistical map. First, the gray-scale intensities used to represent the statistics are mapped into a color scale, shown immediately to the right (and, unfortunately, in black-and-white in this printing. Similarly activated areas, normally printed in color, do not appear in this gray-scale figure.). Second, a threshold is applied so that statistical values that arwithin a user-defined range close to zero are mapped to transparency. This permits the combining of the two maps (thresholded pseudo-color map of statistics, and high resolution gray-scale map of anatomy) by overlaying the color map on top of the structural map. In this way, it is possible to get a better sense of the location of the changes in neural activitassociated with the different experimental conditions. (For a discussion of the pitfalls associated with this procedure, see, for examplethearticlebyRobertSavoyonHumanBrainMappingandFunctionalNeuroimaging) Encyclopedia of the Brain Functional Magnetic Resonance Imaging Robert Savoy Page 12 of 21times of the many images. Such generic statistical computations on grouped images are more accurately described as “contrasts” or “comparisons” rather than "subtractions". IV.C Systematic Detection of Change The most obvious and simple statistical test that can be used in fMRI data analysis is student's t-test. This test assumes that each number in each group is independent, and that the underlying distribution of numbers is Gaussian (i.e., it is a parametric test). In fact, both of these assumptions are often violated in actual fMRI data. Nonetheless, parametric statistics like the t-test are the most widely used measures of the difference between the groups of numbers collected in fMRI images across conditions. Other statistical tests are possible and sometimes used. The most commonly used approach to the detection of systematic effects in fMRI data is the general linear model, which uses correlational analysis. Here, the fMRI data is compared with some kind of reference temporal function to see where in the brain there are high correlations between the reference function and the MR data. The reference function is obtained from the experimental design. For example, because the brain's hemodynamic response follows a fairly consistent profile, a boxcar function defining the experimental paradigm is often convolved with an estimated hemodynamic response function to yield the reference function. The resulting reference function is smoother than a boxcar and better takes into account the shape of the hemodynamic response, generally resulting in better correlation between the MR signal timecourses and the regressor timecourse. Several

functions have been historically used to model the hemodynamic response, including a Poisson function and, more recently, a gamma function. Often, a single canonical hemodynamic response function is used across the entire brain and across subjects, though there is evidence for variation in hemodynamic response shape across subjects and brain regions. Some software packages make provisions for this, allowing for independent modelling of the hemodynamic response function on a voxel-wise basis. There are a number of variations on this general scheme. For multiple experimental conditions, the above scheme can be easily extended using multiple regression. In addition, it is also possible, though less common, to perform nonlinear regression on fMRI data, given some nonlinear prior model of expected brain response. As with any statistical test, one must exercise some caution when using correlational analysis to ensure that incorrect inferences are not made due to violation of the assumptions inherent in the statistical test. In particular, the assumption of independence of consecutive samples is sometimes badly violated in fMRI data, inflating estimates of significance. All of the preceding approaches make the assumption that the variations of interest in the data are those that occur in temporal synchrony with the experimental variations built in to the design. These tests cannot detect novel temporal variations triggered by the experiment, but not part of the design. (For instance, if a change was triggered at stimulus onset and stimulus offset, most standard data analytic packages, as they are typically employed, could not detect that response.) In contrast, various multivariate approaches (such as principal component analysis) seek regularities in the spatiotemporal structure of the fMRI data that is not specified beforehand. Such techniques typically detect the experimental variation that was designed by the experimenter, as well as some physiological variations (such as those due to breathing or heartbeat). The challenge is to refine these tests so that it is easy to interpret the regularities that are detected. Principal component analysis (PCA) is not really a statistical test. Rather, it is a re-representation of the data that condenses as much of the variability in that data as possible into a small number of "eigenimages", each of which is associated with an "eigenfunction" that specifies a temporal fluctuation for the entire image. Thus, instead of one temporal variation for each voxel in a brain volume, there are a small number of volumetric images, each of which varies as a single relative image according to some time course. The key virtue of PCA is that it has the power to pick out particular areas in the brain that exhibit a timecourse similar to that in the experimental design without the experimenter ever having specified that design to the analysis procedure. Similarly, it can detect temporal changes that are different from the ones built into the experiment. On the other hand, there is no obvious way to which eigenimages and eigenfunctions actually correspond to an important or interpretable variation. PCA and related techniques have great theoretical appeal, but they have been rarely used in practical ƒMRI data analysis. A related multivariate technique, called independent component analysis (ICA), is designed to help with the interpretation of the data. Instead of projecting data into a lower dimensional space that accounts for the most variation (as PCA does), ICA finds a space in which the dimensions are as independent as possible, thus facilitating interpretation of the components. IV.D Comparing Brains Nearly all fMRI studies use multiple subjects and perform statistical analyses across data collected from multiple subjects. This practice introduces a number of practical problems which fMRI data analysis must address. A first, relatively simple step towards comparing activity across the brains of multiple subjects is to transform the representations of those brains so that they are similar in overall size and similarly oriented in space. To accomplish this, the brain images are rigidly rotated and linearly scaled into a common "box." The Talairach stereotactic coordinate system is the most widely used standard coordinate system "box" for comparing brains. In the full Talairach transformation, a rigid rotation and translation to a standardized orientation is followed by a piecewise linear scaling of the anterior, middle, and posterior portions of each hemisphere, independently. The standard orientation in three Encyclopedia of the Brain Functional Magnetic Resonance Imaging Robert Savoy Page 13 of 21dimensions is determined by the line between two inter-hermispheric fiber bundles – the anterior commissure (AC) and the posterior commissure (PC) – and the plane between the two hemispheres. The anterior, middle, and posterior portions of each hemisphere are defined in terms of the AC-PC line: the portion of each hemisphere in front of the anterior commisure is the anterior, the portion of each hemisphere between the AC and PC points is the middle, and the portion behind the posterior commisure is the posterior. In some software packages an abbreviated form

of the Talairach transformation is performed, in which the brain is scaled as a whole, without piecewise linear portions for each hemisphere. This has the advantage of being much faster and simpler to implement. Indeed, some packages compute this transformation automatically, by comparing the given brain to a standard "average" brain that was generated by transforming the anatomical MR images of 305 brains to Talairach coordinates and averaging. This process eliminates the tedious and often tricky steps of finding the AC-PC line and other landmarks for each individual brain. Despite the fact that the indivdiual anatomy of the AC-PC line is ignored and the transformation has fewer degrees of freedom than the full Talairach transformation, this automatic process yields data that is adequate for most purposes. The more serious problems with either the simplified Talairach transformation or the full Talairach transformation are caused by the fact that real brains are not rigid transformations of one another. The simplified Talairach transformation, being strictly linear, cannot hope to account for these differences. Even the full Talairach transformation, which is only piecewise linear with a small number of pieces, is clearly inadequate for dealing with these individual differences in brain anatomy. More powerful non-linear approaches have therefore been developed.There are a wide range of approaches to more general transformations of brains to facilitate data display and inter-subject comparison. One approach is to permit complicated non-linear warping procedures based on sulcal and gyral landmarks to guide computer-generated distortions of one brain into another (or to a standard). Another approach, which is also based on non-linear transformations, is to try to match the perimeters of given brain slices between different brains. Perhaps the most widely used alternative to Talairach and these other non-linear transformations is to "inflate" the brain as a means of removing all sulci and gyri. This "inflation" is often followed by cutting the inflated brain in a small number of places to permit "flattening". The goal of inflating is to obtain a three-dimensional, smooth, non-convoluted surface representation of cortex. The goal of flattening is to lay that surface representation on a flat plane. Given that a brain hemisphere (when inflated) looks something like an ellipsoid, it is necessary to cut the ellipsoid in one or more places to allow it to be flattened. Qualitatively, this is similar to the need to cut a globe to get a flattened representation of the world. Quantitatively, however, for an inflated brain, the analogy is closer to a cylinder. When a globe is cut and flattened, it is necessary to create many cuts or else to have some very large distortions. On the other hand, when a cylinder is cut, the resulting surface can be flattened with virtually no distortions. In these terms, the inflated cortex is more like a cylinder than a sphere, and the distortions are not terribly large. Flattened representations are visually and logically very appealing. Unlike Talairach coordinates, however, they are not three dimensional and only apply to the cortical surface. Subcortical structures cannot be represented. (Talairach originally invented his system for subcortical structures, although it does not include the cerebellum). Given the good spatial resolution of ƒMRI and the ability to detect activations in individual subjects, some researchers eschew averaging across subjects. Their position seems to be that the right way to compare across subjects is to look at each individual's functional map (preferably in a flattened brain format to facilitate inter-subject comparison). Elaborations on this approach can include warping within the flattened space, and could therefore eventually include averaging in that space. Recent developments in brain comparisons involve the use of more sophisticated algorithms to inflate the brain to a sphere, but then warp the surface borders on that sphere (associated with major and almost universal sulcal/gyral landmarks) toward a common standard. This transformation permits a smoother and more effective comparison of activation sites across the brains of different subjects than the Talairach transformations. IV.E Comparing Groups One of the most obvious and important classes of questions that are addressed with human functional brain imaging is the search for differences between groups. For example, can fMRI be used to detect the early onset of Alzheimer's disease? Does a remedial training program in reading cause changes in brain activity preferentially for one diagnostic classification of dyslexia versus another? Does a given drug treatment lead to greater area of functional brain activity? All these questions have, as an essential component, the attempt to make quantitative distinctions between different groups of subjects. Functional MRI (and functional brain imaging more broadly) can be used to address at least two types of questions. One question might be thought of as the attempt to represent "typical" brain function and associated networks of activity. In that context, collecting more and more data about a single brain doing a single ta

sk might be useful because the error bars associated with any particular aspect of the associated brain activity might be expected to decrease with increased measurement. In statistics, this is called a "fixed effects" model. On the other hand, to know whether there are differences in brain function and networks of activity between two putatively different groups of subjects, it is important to sample many of members of each group, even if the individual measurement of any one member of the group is noisy. In particular, knowing with extreme precision that Encyclopedia of the Brain Functional Magnetic Resonance Imaging Robert Savoy Page 14 of 21two members of one group differ from two members of another group is only useful if the within-group variation (i.e., between brains) is as small as the within-brain variation (i.e., between multiple measurements of the same brain). If not, then the exceptional precision of the measurement of the small number of subjects is not useful. In statistics, this is the "random effects" model. The practical implication of the fixed versus random effects model of variance for functional neuroimaging is that it is better to have measurements on lots of brains if the goal is to claim group differences. On the other hand, it is may be better to have lots of measurements on a few brains if the goal is to delineate functional systems as precisely as possible. V. Research Applications Human functional MRI based on the endogenous contrast agent (deoxyhemoglobin) was first reported in 1991. In the ensuing ten years the growth of fMRI-based research applications has been explosive. The easiest (and probably the most accurate) way to summarize the range of fMRI-based research applications is "all of psychology and neuroscience". In addition to widespread reports of results of fMRI-based research in general scientific and popular journals, there are two journals devoted exclusively to the technical developments and applications of human brain mapping, for which fMRI is a primary tool. Research applications range from the classical psychophysical questions of sensation, perception, and attention to higher level processes of cognition, language, and emotion, in both normal and patient populations. Even domains ranging from psychotherapy to genetics are beginning to make use of fMRI-based experiments. The impact of fMRI on a few select areas of research are elaborated below. V.A. Retinotopy / Multiple Cortical Visual Areas The first application of fMRI-based research was in the domain of the early stages of visual processing. Indeed, the very first human fMRI study involved the demonstration that a region of the brain associated with early visual processing—occipital cortex in the calcarine fissure—yielded an NMR signal that varied as flashing lights were presented (or not) to a subject. This demonstration was exciting, but the excitement was limited for several reasons. First, nothing "new" had been demonstrated about human visual cortex. Second, there were a host of technical concerns which, had they been correct, would have meant that the spatial resolution obtainable with fMRI would be seriously compromised. And finally, most of the next simple advances would not go beyond what we already know from (invasive) single cell recordings in non-human primates. However, the development of fMRI in the ensuing years for the study of early visual processing addressed all these concerns, and went far beyond them. First, retinopy was demonstrated for area V1 at a level of spatial resolution that exceeded any previously demonstrated with a non-invasive technique. Second, retinotopy was used to delineate multiple visual areas. Differences between the layout of human visual areas as compared with other primate species was demonstrated, and new visual areas apparently unique to humans were claimed. At the same time, some classic psychological effects, such as the motion aftereffect, were seen to be associated with detectable brain activity localized to specific parts of the cortex associated with visual motion processing. The early dependence upon connection to known primate neurophysiology is, in recent times, being turned around. Several laboratories are now developing functional MRI suites designed specifically to study non-human primates. The idea will be to use the invasive technologies like single cell recording, adapted for the MR environment, and get a deeper understanding of both the functional brain structures, and the relationship between neural activity and hemodynamics, using methods that would be unethical with human subjects. V.B. Modulatory Effects of Attention One early fMRI-based study demonstrated that the use of voluntary attention (deciding whether to attend to a subset of moving dots or to a subset of stationary dots in a field of moving and stationary dots) caused detectable changes in MR signals associated with a visual motion processing area in cortex (see Figure 5). This study did not have an overt behavioral measure to provide external evidence that subjects were actually performing their assigned tasks. But the data were sufficiently clean and unambiguous that this study was published and gained considerable attention. Over the ensuing year

s the study was replicated and extended in a number of ways by different laboratories around the world. The initial basic demonstration of attentional modulation became the starting point for much more subtle experiments, experiments that were more tightly tied to behavioral measures. Importantly, both the qualitative and the quantitative measures of attentional modulation were replicated. For instance, the motion processing area was active whenever there was visual movement present, but that activity increased by about 50% when the subject was attending to the movement, in contrast to when the subject was not attending to the movement. The studies that used analogous tasks as part of their design found quantitatively similar changes. The basic paradigm was adapted to more complex stimulus situations, in which subjects could attend to various, different aspects of a complex scene. This permitted the testing of specific hypotheses about the allocation and connection of visual attention to different aspects of a stimulus. For example, it was demonstrated that when an object was attended because of one attribute (say, motion), there was increased processing of other attributes of that object (say, whether it was a familiar face or represented a familiar location) even though the other attributes were irrelevant to Encyclopedia of the Brain Functional Magnetic Resonance Imaging Robert Savoy Page 15 of 21the attentional task. Thus, fMRI-based experiments were being applied to theoretical questions in cognitive psychology of long-standing interest. V.C. Use of Behavioral Responses The use of behavioral responses in fMRI-based studies began as a comforting demonstration that subjects were doing what 04080120160200 04080120160200 -0.50.5 Time (seconds) Figure 5. Voluntary Attention Modulates Activity in Human Visual Cortex This collection of images summarizes an early fMRI-based experiment demonstrating the detection of neural modulation due to theexertion of voluntary attention. Subjects viewed a continuous movie consisting of a cross in the middle of the visual vield (on which they were instructed to fixate) and moving black dots and stationary white dots in the periphery. The cartoon at the upper right represents one frame of this movie, with arrows indicating the direction of motion. (In the actual stimuli, of course, there were no arrows present—only moving, stationary dots, and the fixation cross. The motion was always radial, toward the fixation point, to make it easy for the subjects to maintain fixation. Additional testing with an MR-compatible eyetracker revealed that subjects could maintain fixation.) While looking at this movie for several minutes, subjects received verbal instructions to one collection of colored dots or the other. These instructions alternated every 20 seconds, as indicated in the figure by the black ("Attend Black") and white ("Attend White") arrows on the timeline, below the visual stimulus. When the subjects heard "Attend Black", they would continue to fixate the central cross, but they were supposed to pay more attention to the black (moving) dots than the white (stationary) dots during that time. Similarly, when they heard "Attend White", they were supposed to attend more to the white (stationary) dots. The imaging data were collected with a small coil of wire (about 13 cm in diameter) placed near the occipital cortex (the back of the head). This yielded a stronger signal in the brain regions of interest for the experiment, but yielded weak signals from the rest of the brain, as indicated in the structural image shown at the upper left and the functional image shown in the lower left. Data for 5 slices, oriented parallel to the calcarine fissure (primary visual cortex) were collected (as indicated by the red lines in the upper left). Data from one of those slices is shown at the lower left. As described in Figure 4, a pseudo-color representation of the results of a statistical test comparing the MR data collected during one condition ("Attend Black") versus the other condition ("Attend White") is displayed. There was a clear increase in activity on both the left and right sides of this brain, in a region that corresponds anatomically to a known visual motion p rocessing area of the cortex. Data from the voxels of the brain whose statistic exceeded the threshold used to specify the color map were averaged; the results are plotted as a function of time in the graph at the lower right. Data collected during the time that subjects were attending to moving stimuli (indicated by one shade of background for the graph) were clearly higher in amplitude than the data collected during the time that subjects were attending to the stationary stimuli (indicated by the other shade of background), even though the visual stimulus was unchanged throughout the entire scanning period. This experiment represents a simple, dramatic, demonstration of the ability of functional MRI to detect the neural consequences of changes in cognitive state. (Data and analysis courtesy of Kathleen O'Craven.) (Apologies again, that activated areas, normally printed in color, do not appear in this gray-scale figure.) Encyclopedia of the Brain Functional Magnetic Resonance Imaging Robert

Savoy Page 16 of 21the experimenter had asked them to do. But behavioral measures can be much more useful. Two studies of memory, Happy/PositiveNeutralSad/Negative Stimulus OFF (fixation cross) Fusiform GyrusLeft Inferior Frontal -505101520-505101520 -0.5 Figure 6. Strength of Affect versus Difficulty of Processing As described in section V.D., detection of the hemodynamic responses to different types of events can reveal unintuitive effects. The stimuli and timing for this experiment are indicated in the top row. The stimuli were "positive", "negative", and "neutral" faces and words. One of these was presented for 2 seconds every 8 seconds, in random order. Subjects were required to categorize each stimulus presentation as being "positive", "negative" or "neutral". Two of the resulting activation foci are presented in this figure. A region of the brain known to respond strongly to face stimuli (the fusiform gyrus on the right side of the brain) and a region known to respond strongly to words (the inferior frontal region on the left side of the brain) were detected, and their locations are indicated by the cross hairs in the anatomical images shown on the left side of the next two rows in this figure. The graphs to the right of those figures indicate the hemodynamic responses to the three classes of stimuli (positive, negative, and neutral). For words in the frontal region and for pictures of faces in the fusiform region, the most activity was elicited—not by the most emotionally salient and affective stimuli— b ut by the neutral stimuli. Apparently, categorizing happy or sad stimuli places a smaller processing load on these areas than categorizing a neutral stimulus. (Data and analysis courtesy of Patricia Deldin and David Cox.) Encyclopedia of the Brain Functional Magnetic Resonance Imaging Robert Savoy Page 17 of 21for example, made use of behavioral data collected after the MRI scanning session was over, and the subject was out of the magnet, to retroactively specify the data analytic process. One study of the effects of a drug used the subject's behaviorally reported mental state to obtain a temporal function that could be correlated with the brain imaging data. The two memory studies each made use of the visual presentation of stimuli during the fMRI scanning session. In one case the stimuli were pictures; in the other case words. In both cases the subjects had an irrelevant task to perform related to these stimuli. After the scanning session was over, the subjects were given a memory task (without prior warning) to determine which of the test stimuli they recalled seeing. The key idea here was to group the imaging data according to whether the data was collected during the presentation of stimuli that were subsequently rememberedversus the presentation of stimuli that were subsequently forgotten. The expectation—which was confirmed—was that various parts of the brain associated with long term memory and encoding would have been more active on those trials where the stimulus was subsequently recalled. The drug study used behavioral measures more directly in analyzing the fMRI data. The study involved the challenging task of measuring fMRI changes during the administration of a psychoactive drug: cocaine. Subjects were regular cocaine users who had declined treatment, but who had volunteered for a study. During the course of an imaging session they were given either a placebo or an injection of cocaine. (There were two imaging runs, so each subject got the cocaine on one run and the placebo on the other.) During the runs subjects regularly reported on their subjective state of "high", "low", "rush", and "craving"—terms that were known to be associated with cocaine experiences. Note, first of all, that there are unique technical challenges in this study. Cocaine, in addition to being a psychoactive drug, is also a cardiovascular stimulant. Therefore, before considering the possible effects of cocaine in its psychoactive and addicting role, it was necessary to demonstrate that such effects would not be masked by the circulatory effects of the drug. To accomplish this, the investigators did two things. First, they used a standard stimulus (flashing light) to calibrate neuronally triggered hemodynamic responses. Second, they used two imaging pulse sequences: one that was sensitive to BOLD effects and one that was sensitive to flow effects. This combination allowed them to demonstrate that cocaine influenced the flow-dependent MR signal changes, but not the BOLD MR signal changes. Thus, they could use the BOLD changes to study the effects of cocaine in its role as a psychoactive stimulant, relatively independent of its role as a cardiovascular stimulant. Using the timecourse profile obtained from the behavioral ratings (specifically, the temporal modulation of "craving" and "rush") they could find brain areas whose activity followed a similar profile, allowing them to conclude that those areas were implicated in the experience of these sensations. V.D. Emotional Affect versus Cognitive Processing Load A unique strength of functional brain imaging is the ability to test various intuitions and hypotheses about our mental activities by virtue of the quantitative natur

e of the MR signal changes. Sometimes the most salient aspect of a stimulus (such as its emotional valence) may be less cognitively engaging than the lack of that cue. More specifically, while the localization of function repeatedly found in studies of the low-level aspects of sensory processing appears to have analogs in other cognitive and emotional tasks, the tasks and stimuli that most effectively activate those areas may be counter-intuitive. Higher contrast in visual stimuli generally evokes stronger modulation of early visual processing areas in the brain; but high contrast in an emotional domain does not always evoke the strongest variation in the brain areas associated with processing those stimuli. The data and experiment presented in Figure 6 exemplify this idea. Subjects were required to classify stimuli along an emotional scale as either "neutral", "positive", or "negative". The stimuli were individual words (e.g., "calm", "delighted", "insecure") intermixed with individual pictures of human faces (see the top row of Figure 6 for examples). There is ample evidence, both from the domain of human functional neuroimaging, and from the literature of human brain lesions, to know that words and faces are exceptionally good stimuli for the activation of specific brain regions. Pictures of faces are good stimuli to activate the fusiform gyrus, especially on the right side. Single words, when associated with a semantic (rather than a purely perceptual) task are effective stimuli for activating the inferior frontal region, almost always most strongly on the left side. One might reasonably expect that variation along the important dimension of emotional valence would modulate the strength of activation in these two areas. Given the demonstrated power of emotional stimuli to activate areas of the brain associated with general arousal, one might also predict that the most emotionally powerful stimuli (the positive and negative stimuli) would elicit greater neural activity than the neutral stimuli. The stimuli were presented for 2 seconds each, with 8 seconds between the onset of each stimulus. This design, as one might deduce from sections III.A, is less than optimal, as it does not take advantage of the power of rapid single trials, nor does it completely isolate the hemodynamic responses from the different stimulations. However, it was sufficient to address the preceding question, and it is useful in illustrating the way in which event-related fMRI data is often reported: via overlapping plots of the timecourse of the hemodynamic responses to the different stimulus types. The stimuli were effective in eliciting emotional responses. Unsurprisingly, the emotional faces (happy, in particular, and, to a lesser extent, sad) evoked stronger amygdala responses than neutral faces, with a weaker finding (but in the same relative order of strength) for words. Also unsurprisingly, faces of any type elicited minimal response in left inferior frontal cortex and words of any type elicited minimal response in right fusiform cortex. Encyclopedia of the Brain Functional Magnetic Resonance Imaging Robert Savoy Page 18 of 21However, in the context of this categorization task, neutral stimuli (both faces and words) were far more effective activators of the regions known to be especially responsive to such stimuli (right fusiform and left inferior frontal, respectively) than were the emotionally powerful stimuli. The graphs in Figure 6 show the timecourse of activity for each stimulus type in the relevant regions of the brain. The amplitude of the hemodynamic responses to the neutral stimuli was roughly twice as big as that to the positive stimuli, and exceeded the response to the negative stimuli even more dramatically. Interpretation of this result is not trivial. Behavioral measures of reaction time and accuracy for the words suggests one possible explanation. In the case of the word stimuli, the reaction times were longest, and percent correct lowest, for the neutral words. The fact that it was faster and easier to categorize positive and negative words could mean that the relevant brain area (left inferior frontal) was active for a shorter period of time during the emotional words, resulting in less time for the hemodynamic signal to grow. However, this kind of explanation can not be the whole story. In the case of face stimuli, it was the negative (rather than neutral) faces that had the longest reaction times and lowest percent correct. Face stimuli were generally classified more quickly than words, but neutral faces may still evoke more processing because the observer tries harder to find positive or negative nuances (albeit quickly). However, these are speculations. The point of recounting this study is to emphasize both the complexity of interpretting fMRI data, and its potential non-intuitiveness. It can naturally seem to an experimenter that positive and negative stimuli will, in one sense, evoke stronger responses than neutral stimuli. And, for some brain areas, this is no doubt true. But the constraints of a classification task are different. In that context, the fact that neutral stimuli elicit more activity from their respective processing areas (for words and faces) can b

e plausibly interpreted as an indicator of greater processing effort. VI. Clinical Applications The ability of fMRI to image brain activity in vivo makes it a promising tool for the diagnosis, interpretation, and treatment evaluation of clinical disorders involving brain function. A great deal of effort is currently being exerted to develop concrete clinical applications for fMRI, as well as to use fMRI to better understand various psychiatric and neurological disorders. Until we better understand the wealth of data being generated from neurologically intact individuals, however, the use of fMRI-based data in actual clinical applications is likely to be limited. The development of clinical applications of fMRI is of great importance to the fMRI community for many reasons. Functional MRI-based research has historically been closely tied to the medical community. Indeed, one reason why research using fMRI has been able to expand so rapidly and extensively is availability of conventional MRI machines. MRI machines are very expensive, and any new, clinically relevant application would help subsidize costs of existing machines and the purchase of new machines (or the upgrading of existing machines) for fMRI use. Additionally, such demand encourages manufacturers to invest in the development of scanners that are more specifically designed with fMRI applications in mind. The widespread acceptance of the development costs for higher field (3 and 4 Tesla) scanners by virtually all MRI manufacturers is almost certainly due to the potential promise of the neural-activation MRI (described in the present article) and related imaging techniques such as diffusion-weighted MRI and diffusion-tensor MRI (which are more relevant to the analysis of stroke and white-matter anatomy, respectively). There is at least one area of clinical importance in which fMRI is already playing an active role: presurgical planning. In situations where a surgeon is going to be removing portions of a patient’s brain, it is critical to know exactly where various motor and sensory functions are mapped in that individual’s brain. Some information can be obtained during surgery via direct cortical stimulation, or prior to the main surgery via a separate surgical procedure for the implantation of electrode arrays in the brain. Functional MRI, however, is a non-surgical technique for obtaining similar information well before any surgical intervention starts. Furthermore, it is almost always the case that a structural MRI will be obtained prior to surgery, so it may be a relatively small incremental cost to obtain functional information during the same MRI session. Many other areas of obvious potential clinical importance (in psychopharmacology, neurology, stroke treatment and recovery, drug addiction, and psychiatric disorders) are still largely in the stages of initial research. While many studies have been performed, there are not yet specific clinical interventions that are driven by fMRI. A brief summary of some of the ideas in this area will be described. VI.A Preoperative One promising clinical application for fMRI is in preoperative planning and risk-assessment. Since fMRI allows for the creation of maps of brain activity corresponding to the performance of a specific task, one natural use of fMRI is in identifying areas of the brain that are functionally important and therefore should be carefully avoided during neurosurgery. It should be emphasized that it is the creation of maps specific to the individual patient in question (rather than maps based on averages across many subjects) that is of use to the surgeon. Functional MRI is particularly well-suited to the creation of such individualized maps. Intractable focal epilepsy is sometimes treated by excising the epileptogenic focus surgically. (“Intractable” means, in this context, “not successfully treated with drugs”; and “focal” means that there is a single site that appears to be the source or trigger for the epileptic seizures.) The areas to be removed Encyclopedia of the Brain Functional Magnetic Resonance Imaging Robert Savoy Page 19 of 21are often close to brain areas critical to language (so-called "eloquent" cortex), so surgeons must exercise extreme caution lest their patients acquire severe language impairments as a result of the operation. For most adults, language function is strongly lateralized, meaning that damage to one hemisphere (typically the left) has much greater consequences for language comprehension and production than damage to the other (typically the right) hemisphere. Approximately 95% of right-handed individuals are left-lateralized for language, while left-handed individuals show a much more variable language lateralization (both in left versus right, and in the degree of lateralization). Historically, the best procedure for assessing the side and degree of language lateralization in an individual patient has been the Wada test. In this procedure, amobarbitol is injected unilaterally into the left or right carotid artery, resulting in the anesthetization of the corresponding hemisphere of the brain. Both sides are tested in this way. If the subject is relatively unimpaired on language and memory tasks performed during the anesth

etization of one hemisphere, then it is deemed safe to operate on that hemisphere. Functional MRI offers several advantages over the Wada test: it is completely non-invasive, and it provides a better estimate of areas important to language within each hemisphere. In the early days of at attempting to use fMRI to assess language lateralization, the results were equivocal. Today, fMRI is a robust measure of language lateralization. On the other hand, fMRI has not yet been demonstrated to be as sensitive a measure of memory function as the Wada test, but here, too, progress is being made. At least one hospital in the United States has used fMRI to replace the Wada test for presurgical planning, but at the time of the writing of this article, use of this alternative is not widespread. Notwithstanding this slow start, it is not crazy to speculate that the first generally accepted clinical application of fMRI will be as a replacement for Wada test. More detailed functional maps are being developed for presurgical planning and risk assessment relevant to other brain areas (besides "eloquent" cortex). For instance, during the surgical removal of tumors and other abnormalities near the central sulcus, one risk is the unnecessary removal of portions of primary motor cortex, resulting in serious impairments of motor control. Functional MRI has been used to map the boundaries of primary motor cortex in order to help weigh the risks and benefits of various treatment options. Obtaining an accurate, individualized functional map in this instance is particularly important because brain abnormalities in question often displace structures and make anatomical landmarks ambiguous, as well as potentially disturbing the underlying functional maps of normal brain structures. Depending on the type of tumor, if fully resecting a tumor would endanger primary motor cortex, then partial resection might be in the patient’s best interest. If, on the other hand, the entire tumor can be safely removed without endangering primary motor areas, then it is the patient’s best interest to remove the entire tumor. VI.B Pharmacological Pharmacology is another area where fMRI has great potential. While fMRI is poorly suited to identifying the binding sites of a drug (due to its inherent lack of sensitivity to chemicals in such relatively low concentrations), its good spatial resolution and moderate temporal resolution make it quite well-suited to identifying which functional brain systems a drug influencesStudies of the action of clinically and socially significant drugs (such as addictive drugs) have revealed specific patterns and locations of activation via fMRI. Such studies (which include cocaine and nicotine and a growing list of psychoactive pharmaceuticals) are being conducted to learn more about how these drugs affect the brain. A better understanding of the anatomy and physiology of addiction may eventually lead to more effective treatments. More generally, an important possible use of fMRI could be the determination, on an individual patient level, of whether or not a drug is affecting the appropriate brain systems, and to quantify the strength of that effect and thus potentially guide dosage. Since it is difficult to predict the dose-response effects of a drug on any given individual, fMRI could potentially speed the process of prescribing effective drugs in appropriate doses. Along similar lines, fMRI has the potential to aid drug development by quickly identifying the brain areas on which a drug acts, increasing knowledge about an existing drug or helping to identify potential uses of a new drug. And finally, because fMRI has a temporal resolution that is rapid compared to most of the effects of psychoactive drugs, it is possible to use fMRI to follow the pharmacokinetic profile of such drugs. VI.C Understanding Neurological and Psychiatric Disorders In contrast to presurgical planning and some pharmacology, the application of fMRI-based studies to neurological and psychiatric disorders might better be characterized as in the developmental, rather than application stages. The primary thrust is in the area of refining diagnosis. The wealth of studies using neurologically intact subjects supplies a natural baseline for using fMRI to derive more sensitive and/or more specific diagnostic criteria. For every robust finding in the functional localization of tasks involving frontal cortex with healthy subjects, there will eventually be a comparison study involving patients with all manner of neuropscychiatric disorders, from Alzheimer's disease to psychosis, schizophrenia, and autism. Many such studies have been conducted already. The strength of fMRI is in obtaining spatially localized maps of function, especially in the context of purely cognitive function. These may be of value in diagnosing a variety of disorders. On the other hand, a weakness of fMRI is its extreme lack of sensitivity for directly detecting the presence and concentration of specific drugs in the brain—everything stated so far herein refers to the detection of hydrogen atoms in water molecules. In contrast, PET detects virtually every Encyclopedia of the Brain Functional Magnetic Resonance Imaging Robert Savoy Page 20 of 21decay of a rad

ioactive molecule, and is an consequently exquisitely sensitive measure for localizing the sites of activity for suitably labeled psychoactive drugs. Functional MRI is an imaging modality—it generates pictures that have a great deal of spatial specificity. Magnetic resonance spectroscopy (MRS), in contrast, sometimes collects data from the whole head to detect the presence and concentration of some of the body's more plentiful chemicals (such as lactate). There is a tradeoff between detecting weak signals (there are far more water molecules than lactate molecules in the body) and being able to make spatial maps. As the MRI devices are made more sensitive (via stronger main magnets, better coils, etc), the "whole head" MRS data can be refined to yield greater and greater spatial resolution. The clinical relevance of relevance of MRS will increase in coming years, and some of that improvement will be associated with blood flow changes, and hence to fMRI. VI.D Dyslexia A particularly active region of clinically relevant research using functional MRI is the study of developmental dyslexia. What makes this effort particularly promising is that reading is of such fundamental importance to society and education, and yet there is limited understanding of the development and actions of the relevant cognitive systems underlying reading even in normal readers. Psychophysical studies of temporal processing, not only in the auditory domain, but also in the context of motor activity and coordination and in the visual perception of motion have all been implicated, by at least some researchers, in the etiology of dyslexia. Coupling fMRI with behavioral studies in this context has especially rich Again, here as with some of the preceding potential clinical applications, the likelihood is not for a treatment based on fMRI, but rather an improved ability to differentially diagnose different types dyslexia, and to monitor the effectiveness and modes of action of any behavioral or drug-based treatments. Dyslexia is a complex disorder, with an etiology that is likely to include low level physiology, high-level cognitive structures and other levels as yet undetermined. It is not clear whether fMRI-based research will be able to tap into all aspects of dyslexia, but initial work is encouraging. The discussion of clinical applications of fMRI closes with a discussion of a simpler disorder than dyslexia, but one which couples directly with the particular strengths of hemodynamically based fMRI. VI.E Migraine A recent tour-de-force in fMRI-based experimentation brings together some of the most elegant work in a research application context (retinotopic mapping of visual cortex) and a long-standing phenomenon of clinical importance (migraine headaches). Migraines are an intense form of headache, often associated with visual auras—i.e., the perception of various strange visual patterns, typically around a circular arc or perimeter of some portion of the visual field, bilaterally—and an associated temporary blindness (a temporary scotoma) within that perimeter. The fact that these auras and scotomas appear to both eyes at the same portion of the visual field is very strong suggestive evidence that the underlying effect is being controlled at the cortical level—where these corresponding portions of the visual field share the same physical location in the brain. Moreover, migraines have long been understood to be associated with changes in dilation and constriction of the cerebral vasculature. It is very difficult to study this phenomenon using fMRI, both because it is relatively short-lived (sometimes 30-60 minutes, sometimes 2-4 hours), and is associated with aversion to loud noises and bright lights (on the part of the sufferer). Therefore, it is difficult to get a migraine sufferer to volunteer for an fMRI study; and even if they were willing, it would be rare that they got a migraine while they were near the scanner. One research group was fortunate enough to find a volunteer who predictably and regularly triggered his own migraine headache by dint of intense athletic activity (playing basketball). He was, therefore, available for repeated (schedulable!) scanning immediately before and during the onset of his migraine attacks. The investigators happened to be experts in visual retinotopy and they designed a protocol which revealed, in exquisite detail, the neurological correlate of the patients visual symptomotology. As the scotoma grew, and as the aura changed in size (both of which phenomena could be reported subjectively by the patient), fMRI data revealed the location on the cortex and the functional variation in amplitude of response to a flickering checkerboard of visual stimulation. Combining this data with previously obtained retinotopic maps of the subjects visual cortex permitted a precise connection between measurable function and subjective loss. While this study does not immediately suggest a treatment for migraine attacks, it certainly demonstrates a method for objectively assessing the effectiveness of candidate therapies. VII Closing Given the strong technical components of functional MRI, perhaps it is appropriate to close with a discussion of the ultimate spatial and temporal resolutions t

hat might be obtainable in the not-too-distant future. The temporal resolution of fMRI is not likely to be limited by the imaging tool, but rather by the vagaries of the hemodynamic response. We are probably close to that limit already. While there are aspects of temporal properties of hemodyamics that we can detect on the time scale of 100 msec, for most practical purposes, the fMRI temporal resolution limit is likely to remain around 1 second. Significant improvements in temporal resolution associatedwith fMRI are likely to come from integration with modalities like EEG and MEG whose intrinsic temporal resolution is the msec range. Technological developments—especially in terms of higher field magnets and more sensitive and versatile imaging coils—will increase the effective spatial resolution of Encyclopedia of the Brain Functional Magnetic Resonance Imaging Robert Savoy Page 21 of 21functional MRI. Because higher field strength increases the signal-to-noise ratio, less averaging of signals across space is required, allowing for smaller voxels and thus greater spatial resolution. Although there are some safety issues which arise as field strength increases, there is no known reason why MRI cannot be done with humans at much higher field strength than the conventional 1.5 Tesla. An increasing number of 3-4T scanners are in routine use, and at the time of the writing of this article, a handful of 7-8T scanners for use on humans are either in use currently or are being built. Even without the higher field strengths, it would be possible to increase spatial resolution by using longer imaging times. However, the ultimate spatial resolution limits will not be determined by the MR scanner. Rather, they will be determined by hemodynamic limits, i.e., by the spatial resolution of the smallest vessels that show local changes with neural activity. Based on the available evidence, this limit is approximately the size of a cortical column – somewhere between 0.1 mm and 1 mm in linear dimension. If that spatial resolution could be achieved in routine fMRI-based experiments, it should represent a dramatic leap forward in the ability to develop and test far more interesting and explicit models of functioning neural systems in the human brain. Bibliography: General Bushong, S. C. (1995 (Second Edition: 1996)). Magnetic Resonance Imaging: Physical and Biological Principles . Boston: Mosby-Year Book, Inc. Calvin, W. H., & Ojemann, G. A. (1995). Conversations with Neil's Brain: The Neural Nature of Thought and Language . Reading, Massachusetts: Perseus Publishing. Moonen, C. T. W., & Bandettini, P. A. (Eds.). (1999). Functional MRI . Berlin: Springer-Verlag. Savoy, R. L. (2001). History and Future Directions of Human Brain Mapping and Functional Neuroimaging. Acta Psychologica, 107 (1-3), 9-42. Toga, A. T., & Mazziotta, J. C. (Eds.). (2000). Brain Mapping: The Systems . San Diego: Academic Press. Bibliography: Specific Studies Beauchamp, M. S., Cox, R. W., & DeYoe, E. A. (1997). Graded Effects of Spatial and Featural Attention on Human Area MT and Associated Motion Processing Areas. Journal of Neurophysiology, 77 (7), 516-520. Breiter, H. C., Gollub, R. L., Weisskoff, R. M., Kennedy, D. N., Makris, N., Berke, J. D., Goodman, J. M., Kantor, H. L., Gastfriend, D. R., Riorden, J. P., Mathew, R. T., Rosen, B. R., & Hyman, S. E. (1997). Acute Effects of Cocaine on Human Brain Activity and Emotion. Neuron, 19 (9), 591-611. Brewer, J. B., Zhao, Z., Desond, J. E., Glover, G. H., & Gabrieli, J. D. E. (1998). Making Memories: Brain Activity that Predicts How Well Visual Experience Will Be Remembered. Science, 281 , 1185-1187. Gollub, R. L., Breiter, H. C., Kantor, H., Kennedy, D., Gastfriend, D., Mathew, R. T., Makris, N., Guimaraes, A., Riorden, J., Campbell, T., Foley, M., Hyman, S. E., Rosen, B., & Weisskoff, R. (1998). Cocaine Decreases Cortical Cerebral Blood Flow But Does Not Obscure Regional Activation in Functional Magnetic Resonance Imaging in Human Subjects. Journal of Cerebral Blood Flow and Metabolism, 18 , 724-734. Hadjikhani, N., Sanches del Rio, M., Wu, O., Schwartz, D., Bakker, D., Fischl, B., Kwong, K. K., Cutrer, M. F., Rosen, B. R., Tootell, R. B. H., Sorensen, A. G., & Moskowitz, M. A. (2001). Mechanisms of migraine aura revealed by functional MRI in human visual cortex. Proceedings of the National Academy of Sciences, 98 (8), 4687-4692. O'Craven, K. M., Downing, P. E., & Kanwisher, N. (1999). fMRI evidence for objects as the units of attentional selection. Nature, 401 , 584-587. O'Craven, K. M., & Kanwisher, N. (2000). Mental Imagery of Faces and Places Activates Corresponding Stimulus-Specific Brain Regions. Journal of Cognitive Neuroscience, 12 (6), 1013-1023. O'Craven, K. M., Rosen, B. R., Kwong, K. K., Treisman, A., & Savoy, R. L. (1997). Voluntary Attention Modulates fMRI Activity in Human MT/MST. Neuron, 18 Tootell, R. B. H., Dale, A. M., Sereno, M. I., & Malach, R. (1996). New images from human visual cortex. Trends in Neuroscience, 19 (11), 481-489. Wagner, A. D., Schacter, D. L., Rotte, M., Koutstaal, W., Maril, A., Dale, A. M., Rosen, B. R., & Buckner, R. J. (1998). Building Memories: Remembering and Forgetting of Verbal Experiences as Predicted by Brain Activity. Science, 281