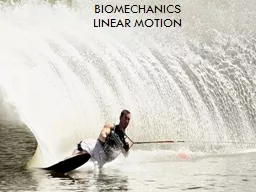
June 2013 June 2013 June 2013 Pure linear motion Linear motion movement of a body in a straight line or curved line where all parts move the same distance in the same direction over the same time ID: 643493
Download Presentation The PPT/PDF document "Biomechanics Linear motion" is the property of its rightful owner. Permission is granted to download and print the materials on this web site for personal, non-commercial use only, and to display it on your personal computer provided you do not modify the materials and that you retain all copyright notices contained in the materials. By downloading content from our website, you accept the terms of this agreement.
Slide1
Biomechanics
Linear motionSlide2
June 2013Slide3
June 2013Slide4
June 2013Slide5
Pure linear motionSlide6
Linear motion movement of a body in a straight line or curved line, where all parts move the same distance, in the same direction over the same time.
Linear motionSlide7
starterState the key concepts
Distance
Displacement
Velocity
Acceleration
Speed
DecelerationSlide8Slide9
Distance
Total length of the path covered.
DISPLACEMENT
Shortest line from the start to finish
.
As the crow flies.Slide10
RecapHow do we calculate?
Speed
Velocity
AccelerationSlide11
speed
SPEED
Speed = rate of change in distance.
Speed is
measured in metres per second (m/s)Slide12
Velocity = displacement / time taken
Displacement is measured in metres (m)
Time taken is measured in seconds (s)
Velocity is measure in metres per second (m/s)
Velocity is the rate of change in displacement.
VELOCITYSlide13
Acceleration = (
final velocity
–
initial velocity
) /
time taken
Time is measured in seconds (s)
Change in Velocity is measured in metres per second (m/s)
Acceleration is measured in metres per second
second
(m/s/s)
Acceleration
is the range of velocity.Slide14
decelerationDeceleration occurs when the rate of change is velocity is negative or there is a decrease in velocity over time.Slide15
Distance: calculate the distance of 40 lengths of a 25m swimming pool. Slide16
Displacement- calculate the displacement of a 1km swim in the 25m pool.Slide17
Speed Dafne Schippers broke the 200m record with a time of 21.63s. The distance from the start to the finish. Calculate the average speed.Slide18
Velocity is measured in m/sUsain bolt broke the world record 100m in 2009, time 9.58s. Calculate the average velocity.Slide19
Acceleration is measured in m/s/s.When Usain Bolt ran the 100m his splits were 20m 2.98s. His velocity at 20m was 6.92 m/shis velocity at 0m was 0m/s.
calculate the acceleration.Slide20
Decelerationas the sprinter crosses the line they slow up by sitting up and stop pedalling.When they cross the line they are travelling at 9m/s two seconds later they are travelling at 5m/s. calculate the deceleration as the rate of change in velocity.Slide21
Answers
Factor
Answer
Distance
= 1km (1000m)
Displacement
=0m
Speed
=
(distance /time taken)
(200m/21.63s) = 9.25m/s
Velocity= (displacement
/ time taken)
(100m
/9.58s) 10.44m/s Acceleration = (Final velocity – initial velocity) / time taken = 2.39m/s/s/(20m/2.89s) = 6.92 m/s (6.92 – 0.0) / 2.89s. = 2.39m/s/sDeceleration = (final velocity – initial velocity / time)5 m/s – 9 m/s /2s = -2m/s/sSlide22
Graphs of Linear MotionGraphs of Linear Motion can be recorded using three graphs:
Distance / Time
Speed / Time
Velocity / Time
With ALL Linear Motion graphs,
time is along the horizontal axis
Slide23
Graphs of distance time
REST
ACCELERATION
CONSTANT SPEED
DECELERATIONSlide24
Distance time GRAPHSlide25
Speed time graphsSlide26
Speed time graphfinal velocity- initial velocity / time taken.Acceleration calculation (8m/s – 3 m/s / time taken =2.5m/sSlide27
Velocity time graphSlide28
Velocity/time graphSlide29
Describe what is happening in the diagram.Slide30
Task 2Using the table:
Plot a distance / time graph for the two athletes
Analyse the motion plotted
Compare the two sprinters
Distance (m)
Bolt (time in seconds)
Fraser-Pryce (time in seconds)
0m
0.00
0.00
20m
2.88s
3.03s
40m
4.64s4.98s60m
6.31s
6.88s
80m
7.92s
8.77s
100m
9.58s
10.73sSlide31Slide32Slide33
Task 3Using the
distance / time graph
created:
Compare average speed over 100m
Compare speed at 60m
Calculate velocity at each 20m interval for both athletes and draw a velocity / time graph
Distance (m)
Bolt (time in seconds)
Fraser-Pryce (time in seconds)
0m
0.00
0.00
20m
2.88s
3.03s40m4.64s4.98s
60m
6.31s
6.88s
80m
7.92s
8.77s
100m
9.58s
10.73sSlide34
Bolt
Fraser
average speed over 100m
10.44
average speed over 100m
9.31 m/s
speed at 60m
9.5 m/s
speed at 60m
8.7 m/s
20m
6.9 m/s
20m
6.6 m/s
40m8.62 m/s40m8 m/s60m9.5 m/s
60m
8.72 m/s
80m
10.1 m/s
80m
9.1 m/s
100m
10.4 m/s
100m
9.3 m/sSlide35
Average velocity Displacement
Time Slide36
Task 4Using the
velocity / time graph
created:
Compare maximum velocity of Bolt and Fraser-Pryce
Compare the average acceleration over the first 20m of the sprint
Distance (m)
Bolt (time in seconds)
Fraser-Pryce (time in seconds)
0m
0.00
0.00
20m
2.88s
3.03s
40m4.64s4.98s
60m
6.31s
6.88s
80m
7.92s
8.77s
100m
9.58s
10.73sSlide37
Component of linear motionDescription
Equation
Distance
The total path covered in m
N/A
Displacement
The shortest
route from the start to the finish
N/A
Speed
The rate of change
of distanceDistance/ time m/s
Velocity
The rate of change of displacement
Distance / velocity m/sAccelerationThe range of velocityFinal velocity – initial velocity / time taken m/s/sForce A force is a push or pull upon an object resulting from the object's interaction with another objectForce is mass x acceleration
Deceleration
The range
of velocity
Final
velocity – initial velocity / time taken m/s/s
SUMMARYSlide38
Jan 2011Slide39
Answer Jan 2011Slide40
Jan 2012Slide41Slide42
Jan 2013 Slide43