/
El  Ni ñ o–Southern  Oscillation (ENSO El  Ni ñ o–Southern  Oscillation (ENSO

El Ni ñ o–Southern Oscillation (ENSO - PowerPoint Presentation

donetrand
donetrand . @donetrand
Follow
342 views
Uploaded On 2020-06-24

El Ni ñ o–Southern Oscillation (ENSO - PPT Presentation

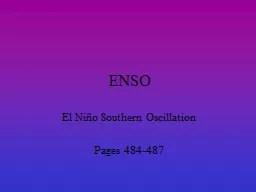
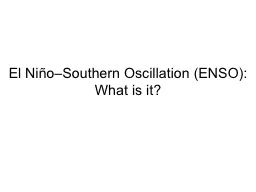
What is it South America Southeast Asia Australia North America Normal conditions in equatorial Pacific Ocean Warm water in the w estern Pacific C old water in the eastern ID: 785632

noaa pacific cpc conditions pacific noaa conditions cpc normal equatorial south source water ocean surface americasource

Share:

Link:

Embed:

Download Presentation from below link

Download The PPT/PDF document "El Ni ñ o–Southern Oscillation (ENS..." is the property of its rightful owner. Permission is granted to download and print the materials on this web site for personal, non-commercial use only, and to display it on your personal computer provided you do not modify the materials and that you retain all copyright notices contained in the materials. By downloading content from our website, you accept the terms of this agreement.


Presentation Transcript

Slide1

El

Ni

ñ

o–Southern

Oscillation (ENSO

):

What is it?

Slide2

South America

Southeast Asia

Australia

North America

Normal

conditions

in equatorial Pacific OceanWarm water in the western PacificCold water in the eastern Pacific

Source: NOAA/CPC

Slide3

Normal

conditions

in equatorial

Pacific

Ocean

Deep convective storms and heavy rain concentrated over warm water in western PacificWarm water provides “fuel” for storms

South AmericaSoutheast AsiaAustraliaNorth AmericaSource: NOAA/CPC

Slide4

Normal

conditions

in equatorial

Pacific

OceanWalker Circulation is in place

Rising air over western Pacific, sinking motion over eastern Pacific

Winds: easterly (east to west) at surface, westerly (west to east) aloft South AmericaSoutheast AsiaAustraliaNorth AmericaSource: NOAA/CPC

Slide5

Normal

conditions

in equatorial

Pacific

OceanUpwelling brings cold water to the surface near the western coast of South America

South America

Southeast AsiaAustraliaNorth AmericaSource: NOAA/CPC

Slide6

El Ni

ño

conditions

in equatorial Pacific Ocean

Warm water spreads eastward across the Pacific

South America

Southeast AsiaAustraliaNorth AmericaSource: NOAA/CPC

Slide7

El Ni

ño

conditions

in equatorial Pacific Ocean

Convective storms shift eastward into central and eastern North Pacific,

remaining fixed over warm waterLocation of convective storms varies from event to event

South AmericaAustraliaNorth AmericaSource: NOAA/CPCSoutheast Asia

Slide8

El Ni

ño

conditions

in equatorial Pacific Ocean

Walker Circulation weakens

Surface easterlies weaken or become westerly

Upward motion develops over central/eastern PacificSouth AmericaAustraliaNorth AmericaSource: NOAA/CPC

Southeast Asia

Slide9

El Ni

ño

conditions

in equatorial Pacific Ocean

Upwelling decreases in eastern Pacific and warm water reaches coast of South America

South America

AustraliaNorth AmericaSource: NOAA/CPCSoutheast Asia

Slide10

La Ni

ña

conditions

in equatorial

Pacific

OceanBig

difference in sea surface temperatures between western and eastern PacificWarm water in western Pacific, cold water in eastern PacificSouth AmericaAustraliaNorth AmericaSource: NOAA/CPC

Southeast Asia

Slide11

La Ni

ña

conditions

in equatorial Pacific Ocean

Convective storms shift westward, remaining fixed over warm water

Source: NOAA/CPC

South AmericaAustraliaNorth AmericaSoutheast Asia

Slide12

La Ni

ña

conditions

in equatorial Pacific Ocean

Walker Circulation strengthens

Source: NOAA/CPC

South AmericaAustraliaNorth AmericaSoutheast Asia

Slide13

La Ni

ña

conditions

in equatorial Pacific Ocean

Upwelling increases in eastern Pacific, and water is cold along coast of South America

Source: NOAA/CPC

South AmericaAustraliaNorth AmericaSoutheast Asia

Slide14

Tracking the evolution of ENSO

Highly variable with lots of fluctuations; no regular cycle

El Ni

ñ

o or La Niña events

typically last 9–12 months, sometimes even longer

On average, El Niños and La Niñas occur every 3–5 yearsImpacts on ocean and atmosphere usually most significant in Northern Hemisphere

Sea surface temperature departure from average over central equatorial Pacific – a commonly used ENSO measurement

El Ni

ño

La Ni

ña

Source: NOAA/CPC

Slide15

Ocean temperatures for past

El Ni

ño and La Niña events

Source: NOAA/CPC

Strong

El Ni

ño eventStrong La Niña event

Slide16

Current Conditions

Sea surface temperature anomalies

3–30 January 2016

Warmer than normal

Cooler than normal

Source: NOAA/CPC

Slide17

Fewer

clouds/rain than normal

More

clouds/rain than normal

Current Conditions

Source: NOAA/CPC

Outgoing longwave radiation anomalies3–28 January 2016

Slide18

Links to animations

Recent evolution of Pacific sea surface temperatures:

http://www.cpc.ncep.noaa.gov/products/analysis_monitoring/enso_update/sstanim.shtml

Comparison between 1997 and 2015 sea surface temperatures:

https://youtu.be/

whsQbIwWjBo

Slide19

Impacts of El Niño on

wintertime

weather over the U.S.

Slide20

El Niño’s

typical impact

on

wintertime weather over the U.S.

Warmer

than normal across northern U.S.

Wetter than normal across the southern U.S.Drier than normal over northeastern U.S.Source: NOAA/Climate.gov

Slide21

How

has

El

Niño

affected the U.S. in past winters?

Precipitation relative to normal

Temperature relative to normalCooler

Warmer

Drier

Wetter

1982–1983

1997–1998

Source: NOAA/ESRL

Slide22

What about this winter?

It was

super warm in December 2015 over the U.S

….and across the globe

Temperature relative to normal

Cooler

WarmerSource: NOAA/ESRL

Global

temperature time series for

all Decembers on record

1880

2015

Source: NOAA/NCDC

Warmest December on record for Albany, for New York State, for the U.S., and for the entire globe!

Slide23

Precipitation relative to normal

Drier

Wetter

…and it has been

raining/snowing

a lot in some areas

Precip anomaly for Nov 2015–Jan 2016Source: NOAA/NWSWhat about this winter?

Slide24

Source: National Drought Monitor

Drought conditions

in early

October

2015

Slide25

Current drought conditions

Source: National Drought Monitor

Drought has improved in many areas in the West!