/
Spinal Cord Injury Spinal Cord Injury

Spinal Cord Injury - PDF document

dora
dora . @dora
Follow
343 views
Uploaded On 2021-09-25

Spinal Cord Injury - PPT Presentation

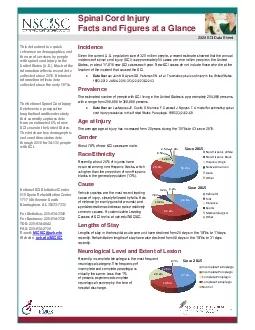
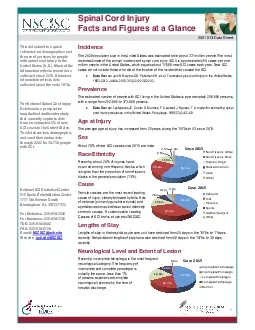
Facts and Figures at a Glance2021SCI Data SheetThis datasheet is a quick reference on demographics and the use of services by people with spinal cord injury in the United StatesUSMuchof theinformation ID: 885609

sci injury ais year injury sci year ais 2015 spinal cord years data persons abc diseases people national center

Share:

Link:

Embed:

Download Presentation from below link

Download Pdf The PPT/PDF document "Spinal Cord Injury" is the property of its rightful owner. Permission is granted to download and print the materials on this web site for personal, non-commercial use only, and to display it on your personal computer provided you do not modify the materials and that you retain all copyright notices contained in the materials. By downloading content from our website, you accept the terms of this agreement.


Presentation Transcript

1 Spinal Cord Injury Facts and Figur
Spinal Cord Injury Facts and Figures at a Glance 202 1 SCI Data Sheet This data sheet is a quick reference on demographics and the use of services by people with spinal cord injury in the United States (U.S.) . M uch of t h e information reflects recent data collected since 2015 . H istorical information reflects data collected since the early 1970s. The National Spinal Cord I njury Database is a prospective longitudinal multicenter study that currently captures data from an estimated 6 % of new SCI cases in the U nited S tates . The database has demographic and condition status data through 20 20 for 3 4 , 734 people with SCI. National SCI Statistical Center 515 Spain Rehabilitation Center 1717 6th Avenue South Birmingham, AL 35233 - 7330 For Statistics: 205 - 934 - 3342 For Business: 205 - 934 - 3320 TDD: 205 - 934 - 4642 FAX: 205 - 934 - 2709 E - mail: NSCISC@uab.edu Website: uab.edu/NSCISC Incidence T he 2020 about 331 million people .The most recent e stimate of the annual in cidence of spinal cord injury (SCI) is approximately 54 cases per one million people in the United Stat es, which equals about 17,900 new SCI cases each year. New SCI cases do not include those who die at the location of the incident that caused the SCI.  Data Source: Jain NB, Ayers GD, Peterson EN, et al. Traumatic spinal cord injury in the United States, 1993 - 2012. JAMA. 2015;313(22):2236 - 2243. Prevalence T he estimated number of people with SCI living in the U nited S tates is approximately 2 9 6 , 000 persons, with a range from 2 5 2 ,000 to 3 73 00 persons.  Data Source: Lasfargues JE, Custis D, Morrone F, Carswell J, Nguyen T. A model for estimating spinal cord injury prevalence in the United States. Paraplegia. 1995;33(2):62 - 68. Age at Injury The average age at injury has increased from 29 years during the 1970s to 4 3 since 2015 . Sex About 78 % of new SCI cases since 2015 are male. Race/Ethnicity Recently, a bout 2 4 % of injuries have occu r r ed among non - H ispanic blacks, which is higher than proportion of non - Hispanic blacks in the general population (1 3 %) . Cause V ehicle crashes are the most recent leading cau se of injury, closely followed by falls . A cts of violence (primarily gunshot wounds) and sports /recreation activities are also relatively common causes . A customizab le Leading Causes of SCI tool is at uab.edu/N SCISC. Length s of S tay Lengths of stay in the hospital acute care have declined from 24 days in the 1970s to 11 days recently . Rehabilitation lengths of stay have also declined from 98 days in the 1970s to 3 0 days rece nt ly . Neurologic al L evel and E xtent of L esion Recently, i ncomplete tetraplegia is the most frequent neurologic al category . The frequency of i ncomplete and complete paraplegia is virtually the same . Less than 1% of persons experienced complete neurologic al recovery by the time of hospital discharge. 58.1% 24.2% 13.3% 0.5% 2.5% 1.4% Since 2015 Non-Hispanic White Non-Hispanic Black Hispanic Origin Native American Asian Other 38.2% 32.3% 14.3% 7.8% 4.1% 3.3% Since 2015 Vehicular Falls Violence Sports Medical/surgical Other 47.4% 19.7% 19.9% 12.4% 0.6% Since 2015 Incomplete Tetraplegia Incomplete Paraplegia Complete Paraplegia Complete Tetraplegia Normal Education Since 2015, about a quarter of persons with SCI have a college degree at the time of their injury , compared with 4 6 % of people who survived 40 years of injury. Education (%) At Injury Year 1 Year 10 Year 20 Year 30 Year 40 High School Only 51. 7 52. 2 50. 2 4 6. 4 41. 8 34. 6 College or Higher 2 3.7 26. 1 27.6 26. 7 34.9 45. 6 Occupational S tatus Since 2015, 1 8 % of persons with SCI are employed at year 1 post - injury . The employment rate increases over time to 3 2 % at 3 0 or more years post injury . Status (%) At I njury Year 1 Year 10 Year 20 Year 30 Year 40 Employed 6 8.3 18. 2 2 4 . 8 30.0 31. 9 32. 3 Student 7.6 7. 0 2.8 0. 8 0 . 3 0.0 Marital Status Since 2015, t he percentage of people who are married is relatively consistent up to year 3 0 post - injury , with single/never married status slowly de creasing and divorce status slowly increasing . Status (%) At Injury Year 1 Year 10 Year 20 Year 30 Year 40 Single 44. 3 4 2.8 37. 3 3 7.2 33. 4 24. 5 Married 37. 8 3 7.0 34. 2 3 4.5 3 5.4 4 4 . 3 Divorced 8. 7 10. 5 19.3 19. 3 21. 8 2 1.6 Re - H ospitalization Since 2015, a bout 30 % of persons with SCI are re - hospitaliz ed one or more ti

2 mes during any given year following
mes during any given year following injury . Among those re - hospitalized , the length of hospital stay averages about 1 8 days. Diseases of the genitourinary system are the leading cause of re - hospitalization, followed by disease of the skin. Respiratory, digestive, circulatory , and musculoskeletal diseases are also common causes. Historical Lifetime C osts T he average yearly expenses (health care costs and living expenses ) and the estimated lifetime costs that are directly attributable to SCI vary greatly based on education, neurological impairment , and pre - injury employment history. The below estimates do not include any ind irect costs such as losses in wages, fringe benefits, and productivity (indirect costs average d $7 8 , 633 per year in 20 20 dollars ). Severity of Injury Average Yearly Expenses (in 20 20 dollars) Estimated Lifetime Costs by Age a t Injury (discounted at 2%) First Year Each Subsequent Year 25 years old 50 years old High Tetraplegia (C1 – C4) AIS ABC $1,163,425 $202,032 $5,162,152 $2,837,031 Low Tetraplegia (C5 – C8) AIS ABC $840,676 $123,938 $3,771,791 $2,319,988 Paraplegia AIS ABC $567,011 $75,112 $2,524,270 $1,656,602 Motor Functional at Any Level AIS D $379,698 $46,119 $1,724,594 $1,217,266 Data Source: Economic Impact of SCI published in the journal Topics in Spinal Cord Injury Rehabilitation , Volume 16 , Number 4 , in 2011. ASIA Impairmen t Scale (AIS) is used to grade the severity of a person’s neurological impairment following spinal cord injury . Historical Life E xpectancy The averag e remaining years of life for persons with SCI have not improved since the 1980s and remain si gnificantly below life expectancies of persons with out SCI . Mortality rates are significantly higher during the first year after injury than during subsequent years, particularly for persons with the most severe neurological impairments . A customizable Li f e Expectancy Calculator tool is at uab.edu/NSCISC. Age at Injury No SCI Life E xpectancy (years) for P ost - I njury by S everity of I njury and A ge at I njury For P ersons W ho S urvive the F irst 24 H ours For P ersons S urviving at L east 1 Y ear P ost - I njury AIS D M otor Fu nctional (Any Level ) AIS ABC Para AIS ABC Low T etra (C5 – C8) AIS ABC High T etra (C1 – C4) V entilator Dependent (Any Level ) AIS D M otor Fu nctional (Any Level ) AIS ABC Para AIS ABC Low T etra (C5 – C8) AIS ABC High T etra (C1 – C4) Ventilator Dependent (Any Level ) 20 59.4 52.1 44.8 39. 2 32.5 10.0 52. 5 45. 2 40. 1 33.6 1 7.1 40 40.7 3 5.0 29. 6 24. 8 20. 7 8. 7 35. 2 30.0 25. 5 21.7 13.1 60 23.3 19. 4 16. 1 13. 1 11. 2 3. 7 19. 6 16. 5 13. 8 12.4 7.9 Historical Cause s of D eath Persons enrolled in the National SCI Database have now been follo wed up to 4 7 years after injury. During that time, the causes of death that appear to have the greatest impact on reduced life expectancy for this population are pneumonia and septicemia. Mortality rates are declining for cancer, heart disease, stroke, arterial diseases, pulmonary embolus, urinary diseases, digestive diseases, and suicide. However, these gai n s are being offset by increasing mortality rates for endocrine, metabolic and nutritional diseases, accidents, nervous system diseases, musculoskeletal disorders , and mental disorders. There has been no change in the mortality rate for septicemia over the past 4 7 years, and there has only been a slight decrease in mortality due to respiratory diseases. © 202 1 Board of Trustees, University of Alabama. This is a publication of the National Spinal Cord Injury Statisti cal Center in collaboration with the Model Systems Knowledge Trans lation Center . The contents of this publication were developed under grant s from the National Institute on Disability, Independent Living, and Rehabilitation Research (NIDILRR grant number s 90DP00 83 and 90DP0082 ). NIDILRR is a Center within the Administration for Community Living (ACL), Department of Health and Human Services (HHS) . The contents of th is publication do not necessarily represent the policy of NIDILRR, ACL, HHS, and you should not assume endorsement by the Fed eral Government. Data from t he National SCI Database is from 2 9 federally funded SCI Model Systems since 1973. Presently, there are 14 systems and 5 Form II (follow up) centers sponsored by NIDILRR. For a complete list of current SCI Model Systems, go to www.msktc.org/sci/model - system - centers . Document Citation: National Spinal Cord Injury Statistical Center, Facts and Figures a t a Glance. Birmingham, AL: University of Alabama at Birmingham, 202 1 .