/
Figure 4 Figure 4. Maximum-likelihood (ML) phylogenetic tree of unique sequences Figure 4 Figure 4. Maximum-likelihood (ML) phylogenetic tree of unique sequences

Figure 4 Figure 4. Maximum-likelihood (ML) phylogenetic tree of unique sequences - PowerPoint Presentation

elise
elise . @elise
Follow
66 views
Uploaded On 2023-07-26

Figure 4 Figure 4. Maximum-likelihood (ML) phylogenetic tree of unique sequences - PPT Presentation

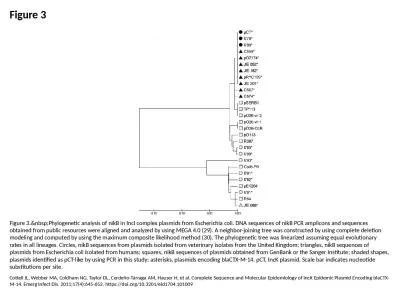
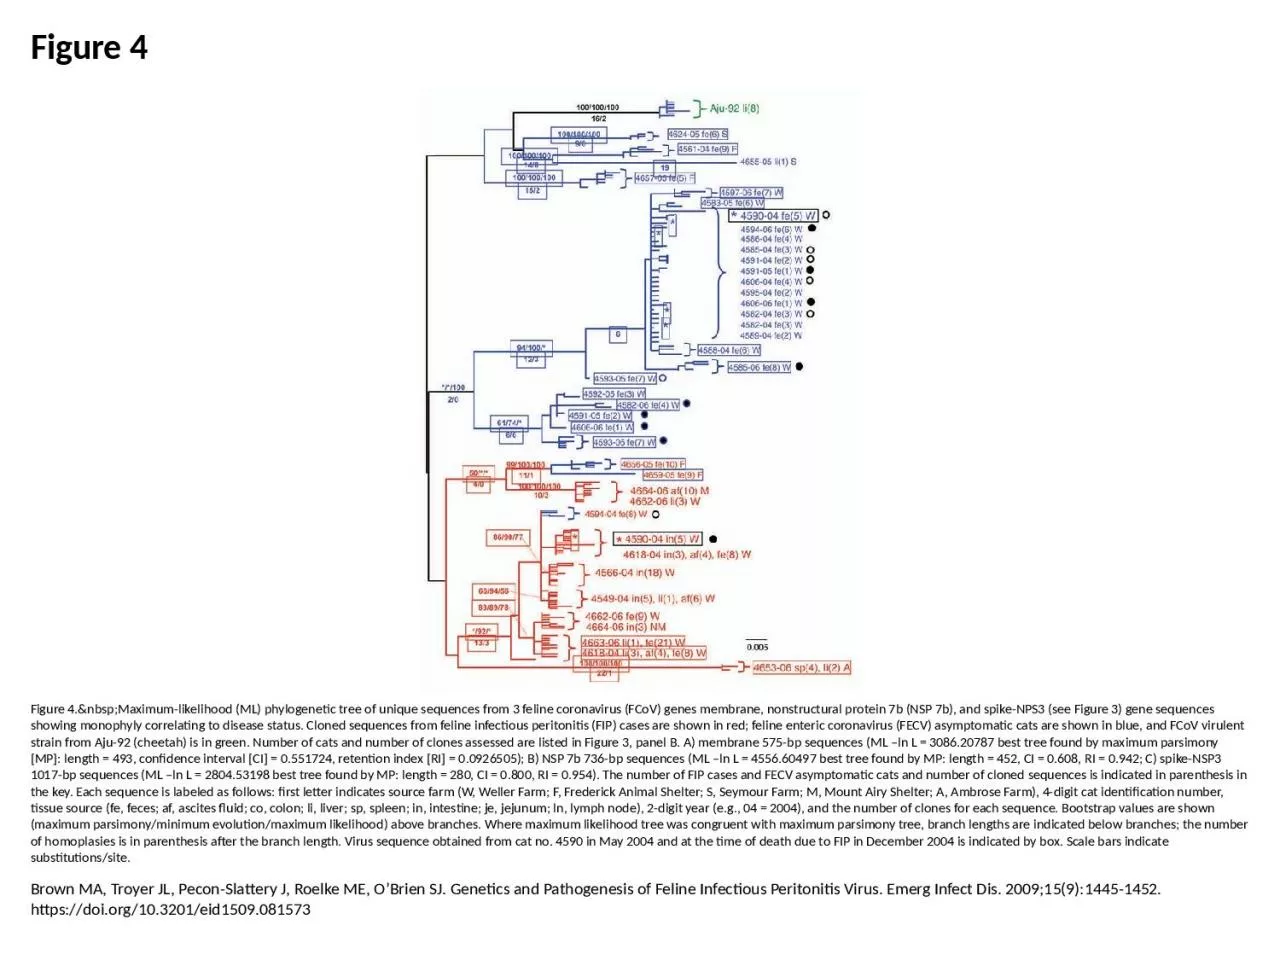
Brown MA Troyer JL PeconSlattery J Roelke ME OBrien SJ Genetics and Pathogenesis of Feline Infectious Peritonitis Virus Emerg Infect Dis 200915914451452 httpsdoiorg103201eid1509081573 ID: 1011514

sequences number tree maximum number sequences maximum tree farm length feline fip sequence 2004 parsimony cats shown figure likelihood

Share:

Link:

Embed:

Download Presentation from below link

Download Presentation The PPT/PDF document "Figure 4 Figure 4. Maximum-like..." is the property of its rightful owner. Permission is granted to download and print the materials on this web site for personal, non-commercial use only, and to display it on your personal computer provided you do not modify the materials and that you retain all copyright notices contained in the materials. By downloading content from our website, you accept the terms of this agreement.


Presentation Transcript

1. Figure 4Figure 4. Maximum-likelihood (ML) phylogenetic tree of unique sequences from 3 feline coronavirus (FCoV) genes membrane, nonstructural protein 7b (NSP 7b), and spike-NPS3 (see Figure 3) gene sequences showing monophyly correlating to disease status. Cloned sequences from feline infectious peritonitis (FIP) cases are shown in red; feline enteric coronavirus (FECV) asymptomatic cats are shown in blue, and FCoV virulent strain from Aju-92 (cheetah) is in green. Number of cats and number of clones assessed are listed in Figure 3, panel B. A) membrane 575-bp sequences (ML –ln L = 3086.20787 best tree found by maximum parsimony [MP]: length = 493, confidence interval [CI] = 0.551724, retention index [RI] = 0.0926505); B) NSP 7b 736-bp sequences (ML –ln L = 4556.60497 best tree found by MP: length = 452, CI = 0.608, RI = 0.942; C) spike-NSP3 1017-bp sequences (ML –ln L = 2804.53198 best tree found by MP: length = 280, CI = 0.800, RI = 0.954). The number of FIP cases and FECV asymptomatic cats and number of cloned sequences is indicated in parenthesis in the key. Each sequence is labeled as follows: first letter indicates source farm (W, Weller Farm; F, Frederick Animal Shelter; S, Seymour Farm; M, Mount Airy Shelter; A, Ambrose Farm), 4-digit cat identification number, tissue source (fe, feces; af, ascites fluid; co, colon; li, liver; sp, spleen; in, intestine; je, jejunum; ln, lymph node), 2-digit year (e.g., 04 = 2004), and the number of clones for each sequence. Bootstrap values are shown (maximum parsimony/minimum evolution/maximum likelihood) above branches. Where maximum likelihood tree was congruent with maximum parsimony tree, branch lengths are indicated below branches; the number of homoplasies is in parenthesis after the branch length. Virus sequence obtained from cat no. 4590 in May 2004 and at the time of death due to FIP in December 2004 is indicated by box. Scale bars indicate substitutions/site.Brown MA, Troyer JL, Pecon-Slattery J, Roelke ME, O’Brien SJ. Genetics and Pathogenesis of Feline Infectious Peritonitis Virus. Emerg Infect Dis. 2009;15(9):1445-1452. https://doi.org/10.3201/eid1509.081573