/
Random Genetic Drift Random Genetic Drift

Random Genetic Drift - PowerPoint Presentation

ellena-manuel
ellena-manuel . @ellena-manuel
Follow
407 views
Uploaded On 2017-09-06

Random Genetic Drift - PPT Presentation

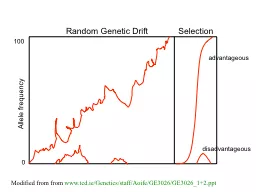
Selection Allele frequency 0 100 advantageous disadvantageous Modified from from wwwtcdieGeneticsstaffAoifeGE3026GE302612ppt Purifying selection in GTA genes dNdS lt1 for GTA genes has been used to infer selection for function ID: 585637

psi blast synonymous sequences blast psi sequences synonymous query coli genes subi sequence search selection genome ckp iteration specific

Share:

Link:

Embed:

Download Presentation from below link

Download Presentation The PPT/PDF document "Random Genetic Drift" is the property of its rightful owner. Permission is granted to download and print the materials on this web site for personal, non-commercial use only, and to display it on your personal computer provided you do not modify the materials and that you retain all copyright notices contained in the materials. By downloading content from our website, you accept the terms of this agreement.


Presentation Transcript

Slide1

Random Genetic Drift

Selection

Allele frequency

0

100

advantageous

disadvantageous

Modified from from

www.tcd.ie/Genetics/staff/Aoife/GE3026/GE3026_1+2.ppt

Slide2

Purifying selection in GTA genes

dN/dS <1 for GTA genes has been used to infer selection for function

GTA genes

Lang AS, Zhaxybayeva O, Beatty JT. Nat Rev Microbiol. 2012 Jun 11;10(7):472-82

Lang, A.S. & Beatty, J.T. Trends in Microbiology , Vol.15, No.2 , 2006Slide3

Purifying selection in E.coli ORFans

dN-dS < 0 for some ORFan

E. coli

clusters seems to suggest they are functional genes.Adapted after Yu, G. and Stoltzfus, A. Genome Biol Evol (2012) Vol. 4 1176-1187

Gene groupsNumberdN-dS>0dN-dS<0dN-dS=0E. coli ORFan clusters3773944 (25%)1953 (52%)876 (23%)

Clusters of E.coli sequences found in Salmonella sp., Citrobacter sp.

610104 (17%)

423(69%)

83 (14%)Clusters of E.coli sequences found in some Enterobacteriaceae

only3738 (2%)

365 (98%)

0 (0%)Slide4

Vincent Daubin and Howard Ochman: Bacterial Genomes as New Gene Homes: The Genealogy of ORFans in

E. coli. Genome Research 14:1036-1042, 2004

The ratio of non-synonymous to synonymous substitutions for genes found only in the E.coli - Salmonella clade is lower than 1, but larger than for more widely distributed genes.

Fig. 3 from Vincent Daubin and Howard Ochman, Genome Research 14:1036-1042, 2004Increasing phylogenetic depthSlide5

Vertically Inherited Genes Not Expressed for FunctionSlide6

Counting Algorithm

1 non-synonymous change

X=2 1 nucleotide substitution

X=2 1 amino acid substitutionSlide7

Simulation AlgorithmSlide8

Evolution of Coding DNA Sequences Under a Neutral ModelE. coli Prophage Genes

Probability distribution

Count distribution

Non-synonymous

Synonymous

n= 90k= 24p=0.763P(≤24)=3.63E-23

Observed=24P(≤24) < 10-6

n= 90

k= 66p=0.2365P(≥66)=3.22E-23

Observed=66P(≥66) < 10-6

n=90

n=90Slide9

Probability distribution

Count distribution

Synonymous

Synonymous

n= 723

k= 498p=0.232P(≥498)=6.41E-149

n= 375k= 243p=0.237P(≥243)=7.92E-64

Observed=498

P(≥498) < 10-6

Observed=243P(≥243) < 10-6

n=723

n=375Evolution of Coding DNA Sequences Under a Neutral ModelE. coli Prophage GenesSlide10

Our values well under the

p

=0.01 threshold suggest we can reject the null hypothesis of neutral evolution of prophage sequences.

Evolution of Coding DNA Sequences Under a Neutral ModelE. coli Prophage Genes

  OBSERVEDSIMULATEDDnapars

SimulatedCodeml

Gene

AlignmentLength (bp)

Substitutions

Synonymous changes*

Substitutions

p-value synonymous (given *)Minimum number of substitutions

dN/dS

dN/dS

Major

capsid

1023

90

66

90

3.23E-23

94

0.113

0.13142

Minor

capsid C

1329

81

59

81

1.98E-19

84

0.124

0.17704

Large

terminase

subunit

1923

75

67

75

7.10E-35

82

0.035

0.03773

Small

terminase

subunit

543

100

66

100

1.07E-19

101

0.156

0.25147

Portal

1599

55

46

55

1.36E-21

*64

0.057

0.08081

Protease

1329

55

37

55

4.64E-11

55

0.162

0.24421

Minor

tail H

2565

260

168

260

1.81E-44

260

0.17

0.30928

Minor

tail L

696

30

26

30

1.30E-13

30

0.044

0.05004

Host

specificity J

3480

723

498

723

6.42E-149

*773

0.137

0.17103

Tail

fiber K

741

41

28

41

1.06E-09

44

0.14

0.18354

Tail

assembly I

669

39

33

39

3.82E-15

40

0.064

0.07987

Tail

tape measure protein

2577

375

243

375

7.92E-64

378

0.169

0.27957Slide11

Evolution of Coding DNA Sequences Under a Neutral ModelB. pseudomallei Cryptic Malleilactone Operon Genes and

E. coli transposase sequences

OBSERVED

SIMULATED

Gene

Alignment Length (bp)

Substitutions

Synonymous changes*Substitutions

p-value synonymous (given *)

Aldehyde dehydrogenase

1544

133

134.67E-04

AMP- binding protein

1865

9

6

9

1.68E-02

Adenosylmethionine-8-amino-7-oxononanoate aminotransferase

1421

20

12

20

6.78E-04

Fatty-acid CoA ligase

1859

13

2

13

8.71E-01

Diaminopimelate

decarboxylase

1388

7

3

7

6.63E-01

Malonyl

CoA-acyl

transacylase

899

2

1

2

4.36E-01

FkbH

domain protein

1481

17

9

17

2.05E-02

Hypothethical

protein

431

3

2

3

1.47E-01

Ketol

-acid

reductoisomerase

1091

2

0

2

1.00E+00

Peptide synthase regulatory protein

1079

10

5

10

8.91E-02

Polyketide

-peptide synthase

12479

135

66

135

4.35E-27

OBSERVED

SIMULATED

Gene

Alignment Length (

bp

)

Substitutions

Synonymous changes*

Substitutions

p-value synonymous

(given *)

Putative

t

ransposase

903

175

107

175

1.15E-29Slide12

Trunk-of-my-car analogy: Hardly anything in there is the is the result of providing a selective advantage. Some items are removed quickly (purifying selection), some are useful under some conditions, but most things do not alter the fitness.

Could some of the inferred purifying selection be due to the acquisition of novel detrimental characteristics (e.g., protein toxicity, HOPELESS MONSTERS)? Slide13

Other ways to detect positive selection

Selective sweeps -> fewer alleles present in population

(see contributions from archaic Humans for example) Repeated episodes of positive selection -> high dNSlide14

Fig. 1 Current world-wide frequency distribution of CCR5-Δ32 allele frequencies. Only the frequencies of Native populations have been evidenced in Americas, Asia, Africa and Oceania. Map redrawn and modified principally from <ce:cross-ref refid="bib5"> B...

Eric Faure , Manuela Royer-Carenzi Is the European spatial distribution of the HIV-1-resistant CCR5-Δ32 allele formed by a breakdown of the pathocenosis due to the historical Roman expansion?

Infection, Genetics and Evolution, Volume 8, Issue 6, 2008, 864 - 874http://dx.doi.org/10.1016/j.meegid.2008.08.007Slide15

Manhattan plot of results of selection tests in Rroma, Romanians, and Indians using TreeSelect statistic (A) and XP-CLR statistic (B).

Laayouni H et al. PNAS 2014;111:2668-2673

©2014 by National Academy of SciencesSlide16

Variant arose about

5800 years agoSlide17

The age of haplogroup D was found to be ~37,000 yearsSlide18
Slide19

PSI

(position-specific iterated) BLAST

The NCBI page described PSI blast as follows:

“Position-Specific Iterated BLAST (PSI-BLAST) provides an automated, easy-to-use version of a "profile" search, which is a sensitive way to look for sequence homologues. The program first performs a gapped BLAST database search. The PSI-BLAST program uses the information from any significant alignments returned to construct a position-specific score matrix, which replaces the query sequence for the next round of database searching.

PSI-BLAST may be iterated until no new significant alignments are found. At this time PSI-BLAST may be used only for comparing protein queries with protein databases.”  Slide20

The Psi-Blast Approach

1. Use results of BlastP query to construct a multiple sequence alignment

2. Construct a position-specific scoring matrix from the alignment

3. Search database with alignment instead of query sequence4. Add matches to alignment and repeat

Psi-Blast can use existing multiple alignment, or use RPS-Blast to search a database of PSSMs Slide21

PSI BLAST schemeSlide22

Position-specific Matrix

M Gribskov, A D McLachlan, and D Eisenberg (1987) Profile analysis: detection of distantly related proteins. PNAS 84:4355-8.

by Bob FriedmanSlide23

Psi-Blast

Results

Query: 55670331 (intein)

link to sequence

here, check BLink Slide24

Psi-Blast is for finding matches among divergent sequences (position-specific information)

WARNING

: For the nth iteration of a PSI BLAST search, the E-value gives the number of matches to the profile NOT to the initial query sequence! The danger

is that the profile was corrupted in an earlier iteration. PSI BLAST and E-values!Slide25

Often you want to run a PSIBLAST search with two different databanks -

one to create the PSSM, the other to get sequences:To create the PSSM: blastpgp -d nr -i subI -j 5 -C subI.ckp -a 2 -o subI.out -h 0.00001 -F f

blastpgp -d swissprot -i gamma -j 5 -C gamma.ckp -a 2 -o gamma.out -h 0.00001 -F fRuns 4 iterations of a PSIblastthe -h option tells the program to use matches with E <10^-5 for the next iteration, (the default is 10-3 )-C creates a checkpoint (called subI.ckp),-o writes the output to subI.out,-i option specifies input as using subI as input (a fasta formated aa sequence).

The nr databank used is stored in /common/data/-a 2 use two processors -h e-value threshold for inclusion in multipass model [Real] default = 0.002 THIS IS A RATHER HIGH NUMBER!!!(It might help to use the node with more memory (017) (command is ssh node017

)PSI Blast from the command lineSlide26

To use the PSSM:

blastpgp -d /Users/jpgogarten/genomes/msb8.faa -i subI -a 2 -R subI.ckp -o subI.out3 -F fblastpgp -d /Users/jpgogarten/genomes/msb8.faa -i gamma -a 2 -R gamma.ckp -o gamma.out3 -F f

Runs another iteration of the same blast search, but uses the databank /Users/jpgogarten/genomes/msb8.faa-R tells the program where to resume-d specifies a different databank-i input file - same sequence as before -o output_filename-a 2 use two processors-h e-value threshold for inclusion in multipass model [Real] default = 0.002. This is a rather high number, but might be ok for the last iteration.Slide27

PSI Blast and finding gene families within genomes

2nd step: use PSSM to search genome:

Use protein sequences encoded in genome as target:

blastpgp -d target_genome.faa -i query.name -a 2 -R query.ckp -o query.out3 -F fB) Use nucleotide sequence and tblastn. This is an advantage if you are also interested in pseudogenes, and/or if you don’t trust the genome annotation:blastall -i query.name -d target_genome_nucl.ffn -p psitblastn -R query.ckpSlide28

Psi-Blast finds homologs among divergent sequences (position-specific information)

WARNING

: For the nth iteration of a PSI BLAST search, the E-value gives the number of matches

to the profileNOT to the initial query sequence! The danger is that the profile was corrupted in an earlier iteration.