/
Thinking Like An Economist Thinking Like An Economist

Thinking Like An Economist - PowerPoint Presentation

ellena-manuel
ellena-manuel . @ellena-manuel
Follow
478 views
Uploaded On 2016-04-01

Thinking Like An Economist - PPT Presentation

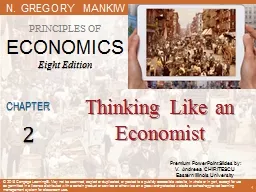
E conomics E S S E N T I A L S O F N Gregory Mankiw Premium PowerPoint Slides by Ron Cronovich 2 THINKING LIKE AN ECONOMIST 1 The Economist as Scientist Economists play two roles 1 ID: 272484

economist ppf 000 thinking ppf economist thinking 000 economy production goods cost economists wheat labor resources opportunity world hours computers models firms

Share:

Link:

Embed:

Download Presentation from below link

Download Presentation The PPT/PDF document "Thinking Like An Economist" is the property of its rightful owner. Permission is granted to download and print the materials on this web site for personal, non-commercial use only, and to display it on your personal computer provided you do not modify the materials and that you retain all copyright notices contained in the materials. By downloading content from our website, you accept the terms of this agreement.


Presentation Transcript

Slide1

Thinking Like An Economist

E

conomics

E S S E N T I A L S O F

N. Gregory Mankiw

Premium PowerPoint Slides by Ron Cronovich

2Slide2

THINKING LIKE AN ECONOMIST

1

The Economist as ScientistEconomists play two roles:1. Scientists: try to explain the world

2. Policy advisors: try to improve itIn the first, economists employ the scientific method

, the dispassionate development and testing of theories about how the world works. Slide3

THINKING LIKE AN ECONOMIST

2

Assumptions & ModelsAssumptions simplify the complex world, make it easier to understand. Example: To study international trade,

assume two countries and two goods. Unrealistic, but simple to learn and gives useful insights about the real world.Model: a highly simplified representation of

a more complicated reality. Economists use models to study economic issues. Slide4

THINKING LIKE AN ECONOMIST

3

Some Familiar ModelsA road mapSlide5

THINKING LIKE AN ECONOMIST

4

Some Familiar ModelsA model of human anatomy from high

school biology classSlide6

THINKING LIKE AN ECONOMIST

5

Some Familiar Models

A model airplaneSlide7

THINKING LIKE AN ECONOMIST

6

Some Familiar ModelsThe model teeth at the dentist’s office

Don’t forget to floss!Slide8

THINKING LIKE AN ECONOMIST

7

Our First Model: The Circular-Flow DiagramThe

Circular-Flow Diagram: a visual model of the economy, shows how dollars flow through markets among households and firmsTwo types of “actors”: householdsfirms Two markets:the market for goods and services

the market for “factors of production”Slide9

THINKING LIKE AN ECONOMIST

8

Factors of ProductionFactors of production: the resources the economy uses to produce goods & services, includinglabor

land capital (buildings & machines used in production)Slide10

THINKING LIKE AN ECONOMIST

9

FIGURE 1:

The Circular-Flow Diagram

Households

:Own the factors of production, sell/rent them to firms for income

Buy and consume goods & services

Households

Firms

Firms

:

Buy/hire factors of production,

use them to produce goods and services

Sell goods & servicesSlide11

THINKING LIKE AN ECONOMIST

10

FIGURE 1: The Circular-Flow Diagram

Markets for Factors of Production

Households

Firms

Income

Wages, rent, profit

Factors of production

Labor, land, capital

Spending

G & S bought

G & S sold

Revenue

Markets for Goods & ServicesSlide12

THINKING LIKE AN ECONOMIST

11

Our Second Model: The Production Possibilities Frontier

The Production Possibilities Frontier (PPF): a graph that shows the combinations of two goods the economy can possibly produce given the available resources and the available technology Example:

Two goods: computers and wheatOne resource: labor (measured in hours)Economy has 50,000 labor hours per month available for production.

0Slide13

PPF Example

Producing one computer requires 100 hours labor.

Producing one ton of wheat requires 10 hours labor.

5,000

0

4,000

100

2,500

250

1,000

400

50,000

0

40,000

10,000

25,000

25,000

10,000

40,000

0

500

0

50,000

E

D

C

B

A

Wheat

Computers

Wheat

Computers

Production

Employment of

labor hours

0Slide14

THINKING LIKE AN ECONOMIST

13

Point on graph

Production

Com-puters

Wheat

A

500

0

B

400

1,000

C

250

2,500

D

100

4,000

E

0

5,000

A

B

C

D

E

PPF ExampleSlide15

A.

On the graph, find the point that represents

(100 computers, 3000 tons of wheat), label it F. Would it be possible for the economy to produce this combination of the two goods?Why or why not?

B. Next, find the point that represents (300 computers, 3500 tons of wheat), label it G. Would it be possible for the economy to produce this combination of the two goods?

A C T I V E L E A R N I N G

1

Points off the PPF

14Slide16

A C T I V E L E A R N I N G

1

Answers

15

Point

F

:

100 computers, 3000 tons wheat

Point

F

requires 40,000 hours

of labor.

Possible but

not efficient: could get more

of either good

w/o sacrificing any of the other.

FSlide17

A C T I V E L E A R N I N G

1

Answers

16

Point

G

:

300 computers, 3500 tons wheat

Point

G

requires 65,000 hours

of labor.

Not possible because

economy

only has

50,000 hours.

GSlide18

THINKING LIKE AN ECONOMIST

17

The PPF: What We Know So FarPoints on the PPF (like A – E)

possibleefficient: all resources are fully utilizedPoints under the PPF (like F

) possiblenot efficient: some resources underutilized (e.g., workers unemployed, factories idle)

Points above the PPF (like G) not possibleSlide19

THINKING LIKE AN ECONOMIST

18

The PPF and Opportunity CostRecall: The opportunity cost

of an item is what must be given up to obtain that item.

Moving along a PPF involves shifting resources (e.g., labor) from the production of one good to the other.

Society faces a tradeoff: Getting more of one good requires sacrificing some of the other. The slope of the PPF tells you the opportunity cost of one good in terms of the other. Slide20

A C T I V E L E A R N I N G

2

PPF and Opportunity Cost

19

In which country is the opportunity cost of cloth lower?

FRANCE

ENGLANDSlide21

A C T I V E L E A R N I N G

2

Answers

20

FRANCE

ENGLAND

England

, because its PPF is not as steep as France’s.Slide22

THINKING LIKE AN ECONOMIST

21

Economic Growth and the PPF

With additional resources or an improvement in technology,

the economy can produce more computers,

more wheat,

or any combination in between.

Economic growth shifts the PPF outward.Slide23

THINKING LIKE AN ECONOMIST

22

The Shape of the PPFThe PPF could be a straight line, or bow-shapedDepends on what happens to opportunity cost

as economy shifts resources from one industry to the other.If opp. cost remains constant, PPF is a straight line.

(In the previous example, opp. cost of a computer was always 10 tons of wheat.)If opp. cost of a good rises as the economy produces more of the good, PPF is bow-shaped. Slide24

THINKING LIKE AN ECONOMIST

23

Why the PPF Might Be Bow-Shaped

Mountain Bikes

Beer

As the economy shifts resources

from beer to mountain bikes:

PPF becomes steeper

opp. cost of mountain bikes increases Slide25

THINKING LIKE AN ECONOMIST

24

Why the PPF Might Be Bow-ShapedSo, PPF is bow-shaped when different workers have different skills, different opportunity costs of producing one good in terms of the other.

The PPF would also be bow-shaped when there is some other resource, or mix of resources with varying opportunity costs (E.g., different types of land suited for different uses).Slide26

THINKING LIKE AN ECONOMIST

25

The PPF: A SummaryThe PPF shows all combinations of two goods that an economy can possibly produce, given its resources and technology.

The PPF illustrates the concepts of

tradeoff and opportunity cost, efficiency and inefficiency,

unemployment, and economic growth. A bow-shaped PPF illustrates the concept of increasing opportunity cost. Slide27

THINKING LIKE AN ECONOMIST

26

Microeconomics and MacroeconomicsMicroeconomics is the study of how households and firms make decisions and how they interact in markets. Macroeconomics

is the study of economy-wide phenomena, including inflation, unemployment, and economic growth. These two branches of economics are closely intertwined, yet distinct – they address different questions. Slide28

The Economist as Policy Advisor

As scientists, economists make

positive statements, which attempt to describe the world as it is. As policy advisors, economists make normative statements,

which attempt to prescribe how the world should be. Positive statements can be confirmed or refuted, normative statements cannot. Govt employs many economists for policy advice. E.g., the U.S. President has a Council of Economic Advisors, which the author of this textbook chaired from 2003 to 2005.

27Slide29

A C T I V E L E A R N I N G

3

Identifying positive vs. normative

28

Which of these statements are “positive” and which are “normative”? How can you tell the difference?

a.

Prices rise when the government increases the quantity of money.

b.

The government should print less money.

c.

A tax cut is needed to stimulate the economy.

d.

An increase in the price of burritos will cause an increase in consumer demand for video rentals.Slide30

A C T I V E L E A R N I N G

3

Answers

29

a.

Prices rise when the government increases the quantity of money.

Positive – describes a relationship, could use data to confirm or refute.

b.

The government should print less money.

Normative – this is a value judgment, cannot be confirmed or refuted.Slide31

A C T I V E L E A R N I N G

3

Answers

30

c.

A tax cut is needed to stimulate the economy.

Normative – another value judgment.

d.

An increase in the price of burritos will cause an increase in consumer demand for video rentals.

Positive – describes a relationship.

Note that a statement need not be true to be positive.Slide32

THINKING LIKE AN ECONOMIST

31

Why Economists DisagreeEconomists often give conflicting policy advice. They sometimes disagree about the validity of alternative positive theories about the world. They may have different values and, therefore, different normative views about what policy should try to accomplish.

Yet, there are many propositions about which most economists agree. Slide33

THINKING LIKE AN ECONOMIST

32

Propositions about Which Most Economists Agree (and % who agree)A ceiling on rents reduces the quantity and quality of housing available. (93%)

Tariffs and import quotas usually reduce general economic welfare. (93%)The United States should not restrict employers from outsourcing work to foreign countries. (90%)The United States should eliminate agriculture subsidies. (85%)

continued…Slide34

CHAPTER SUMMARY

As scientists, economists try to explain the world using models with appropriate assumptions.

Two simple models are the Circular-Flow Diagram and the Production Possibilities Frontier.

Microeconomics studies the behavior of consumers and firms, and their interactions in markets. Macroeconomics studies the economy as a whole.

As policy advisers, economists offer advice on how to improve the world.

33