PDF-TABLES AND MAPS
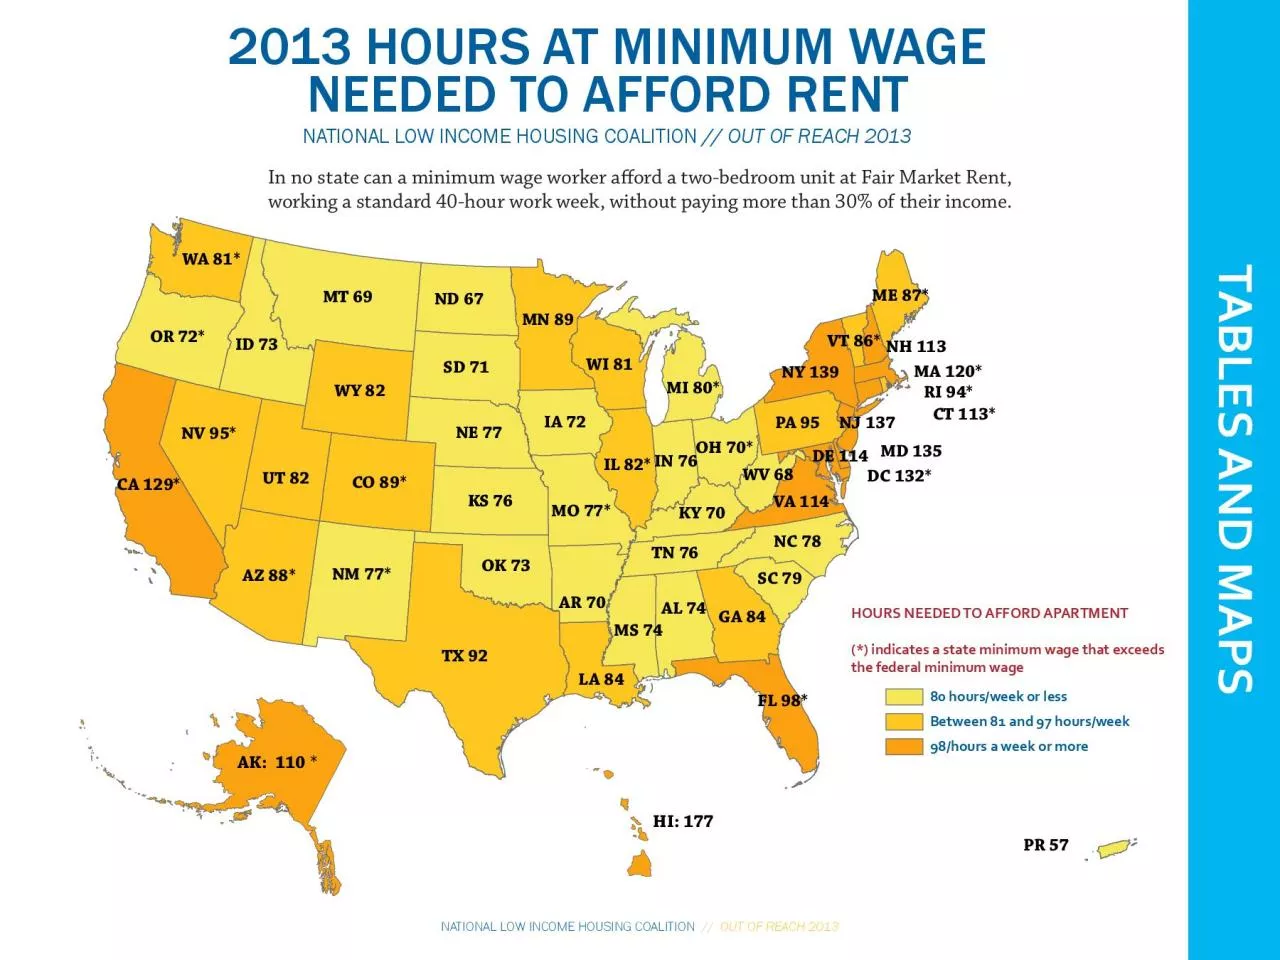
In no state can a minimum wage worker a31ord a twobedroom unit at Fair Market Rent working a standard 40hour work week without paying more than 30 of their income2013
Download Presentation
"TABLES AND MAPS" is the property of its rightful owner. Permission is granted to download and print materials on this website for personal, non-commercial use only, provided you retain all copyright notices. By downloading content from our website, you accept the terms of this agreement.
Presentation Transcript
Transcript not available.