/
MONTHLY PERFORMANCE MONTHLY PERFORMANCE

MONTHLY PERFORMANCE - PDF document

freya
freya . @freya
Follow
344 views
Uploaded On 2021-08-17

MONTHLY PERFORMANCE - PPT Presentation

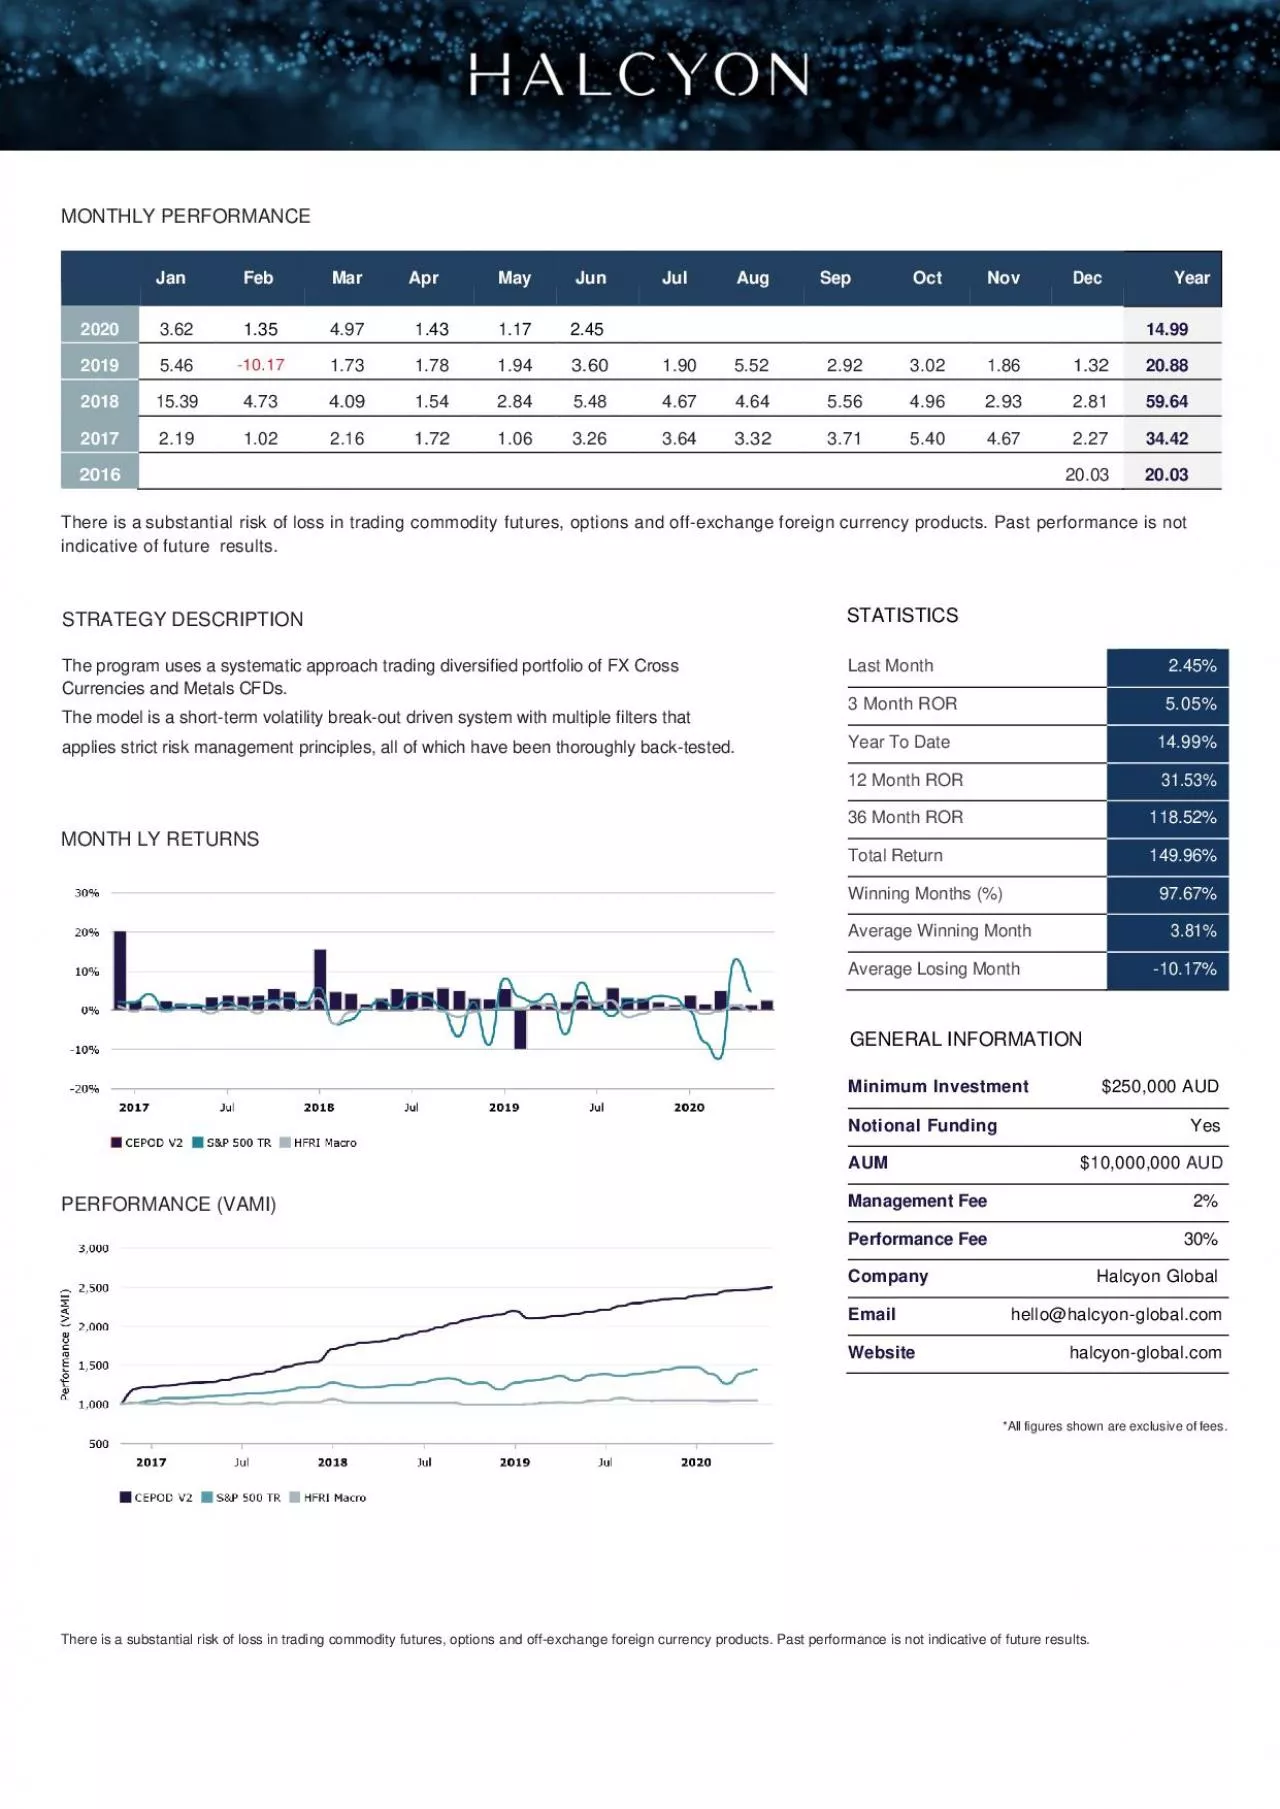
JanFebMarAprMayJunJulAugSepOctNovDecYear202036213549714311724514992019546101717317819436019055229230218613220882018153947340915428454846746455649629328159642017219102216172106326364332371540467227344 ID: 865395

performance month ror trading month performance trading ror global halcyon risk 000 foreign commodity futures options management currency products

Share:

Link:

Embed:

Download Presentation from below link

Download Pdf The PPT/PDF document "MONTHLY PERFORMANCE" is the property of its rightful owner. Permission is granted to download and print the materials on this web site for personal, non-commercial use only, and to display it on your personal computer provided you do not modify the materials and that you retain all copyright notices contained in the materials. By downloading content from our website, you accept the terms of this agreement.


Presentation Transcript

1 MONTHLY PERFORMANCE Jan Feb M
MONTHLY PERFORMANCE Jan Feb Mar Apr May Jun Jul Aug Sep Oct Nov Dec Year 2020 3.62 1.35 4.97 1.43 1.17 2.45 1 4.99 2019 5.46 - 10.17 1.73 1.78 1.94 3.60 1.90 5.52 2.92 3.02 1.86 1.32 2 0.88 2018 15.39 4.73 4.09 1.54 2.84 5.48 4.67 4.64 5.56 4.96 2.93 2.81 59.64 2017 2.19 1.02 2.16 1.72 1.06 3.26 3.64 3.32 3.71 5.40 4.67 2.27 34.42 2016 20.03 20.03 There is a substantial risk of loss in trading commodity futures, options and off - exchange foreign currency products. Past performance is not indicative of future results. STRATEGY DESCRIPTION The program uses a systematic approach trading diversified portfolio of FX Cross Currencies and Metals CFDs. The model is a short - term volatility break - out driven system with multiple filters that applies strict risk management principles, all of which have been thoroughly back - tested. MONTH LY RETURNS PERFORMANCE (VAMI) *All figures shown are exclusive of fees. There is a substantial risk of loss in trading commodity futures, options and off - exchange foreign currency products. Past performance is not indicative of future results. Last Month 2.45 % 3 Month ROR 5.05 % Year To Date 1 4.99 % 12 Month ROR 3 1.53 % 36 Month ROR 1 1 8.52 % Total Return 14 9.96 % Winning Months (%) 9 7. 6 7 % Average Winning Month 3. 8 1 % Average Losing Month - 10.17 % Minimum Investment $250,000 AUD Notional Funding Yes AUM $10,000 ,000 AUD Management Fee 2% Performance Fee 30% Company Halcyon Global Email hello@halcyon - global.com Website halcyon - global.com GENERAL INFORMATION STATISTICS