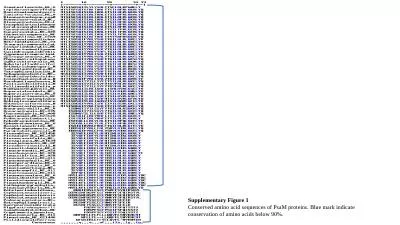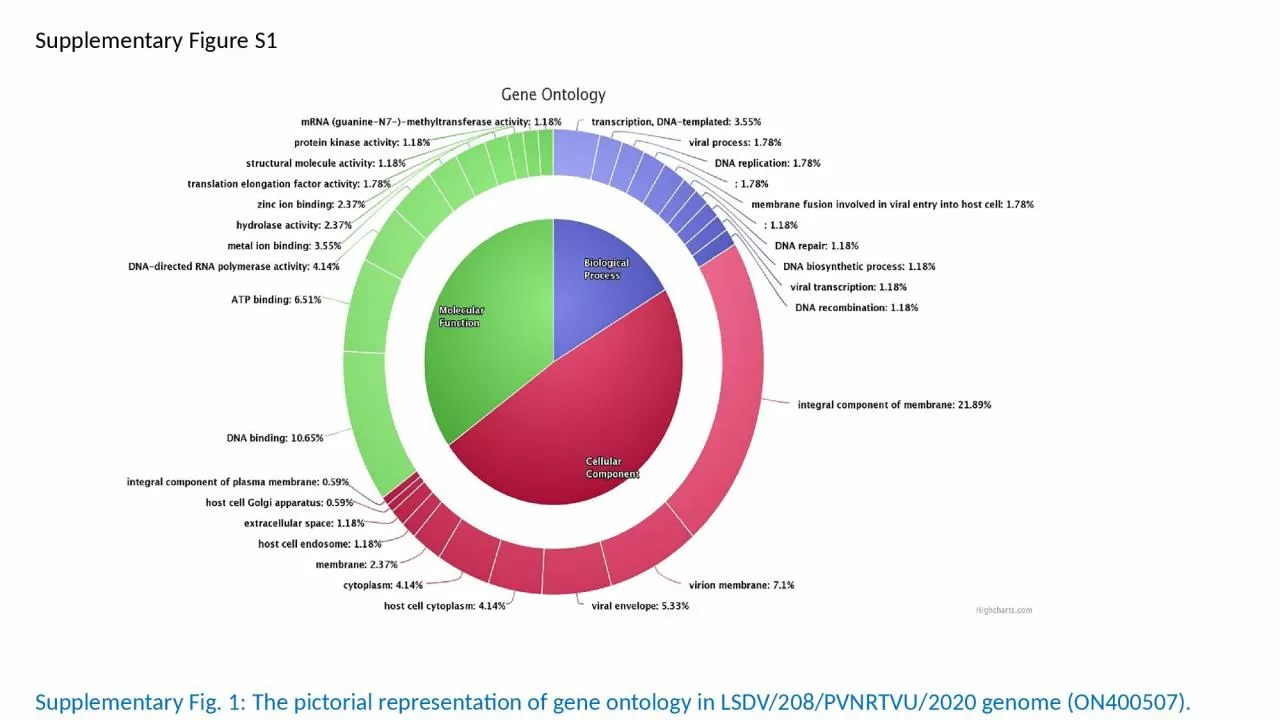
PPT-Supplementary Figure S1 Supplementary Fig. 1: The
Author : hanah | Published Date : 2024-03-13
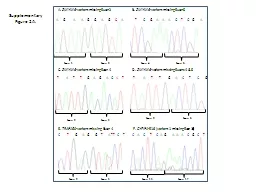
pictorial representation of gene ontology in LSDV208PVNRTVU2020 genome ON400507 S No Accession No Isolate Host Country Genome size 1 MT1340421 LSDVRussiaUdmurtiya2019
Presentation Embed Code
Download Presentation
Download Presentation The PPT/PDF document "Supplementary Figure S1 Supplementary Fi..." is the property of its rightful owner. Permission is granted to download and print the materials on this website for personal, non-commercial use only, and to display it on your personal computer provided you do not modify the materials and that you retain all copyright notices contained in the materials. By downloading content from our website, you accept the terms of this agreement.
Supplementary Figure S1 Supplementary Fig. 1: The: Transcript
Download Rules Of Document
"Supplementary Figure S1 Supplementary Fig. 1: The"The content belongs to its owner. You may download and print it for personal use, without modification, and keep all copyright notices. By downloading, you agree to these terms.
Related Documents