/
Intro to Climate Change Intro to Climate Change

Intro to Climate Change - PowerPoint Presentation

hazel
hazel . @hazel
Follow
67 views
Uploaded On 2024-01-29

Intro to Climate Change - PPT Presentation

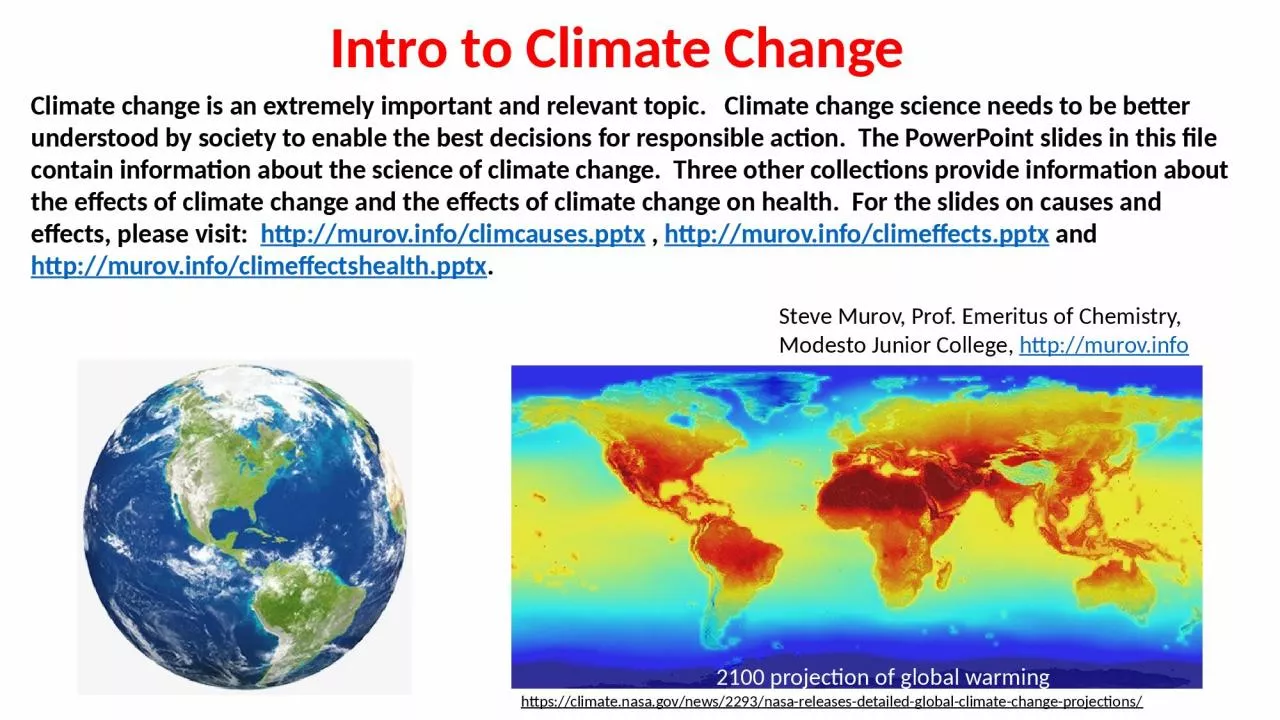
Climate change is an extremely important and relevant topic Climate change science needs to be better understood by society to enable the best decisions for responsible action The PowerPoint slides in this file contain information about the science of climate change Three other collections pr ID: 1041553

change climate ozone co2 climate change co2 ozone http global murov info depletion yale gases freons ppm shell pptx

Share:

Link:

Embed:

Download Presentation from below link

Download Presentation The PPT/PDF document "Intro to Climate Change" is the property of its rightful owner. Permission is granted to download and print the materials on this web site for personal, non-commercial use only, and to display it on your personal computer provided you do not modify the materials and that you retain all copyright notices contained in the materials. By downloading content from our website, you accept the terms of this agreement.


Presentation Transcript

1. Intro to Climate Change Climate change is an extremely important and relevant topic. Climate change science needs to be better understood by society to enable the best decisions for responsible action. The PowerPoint slides in this file contain information about the science of climate change. Three other collections provide information about the effects of climate change and the effects of climate change on health. For the slides on causes and effects, please visit: http://murov.info/climcauses.pptx , http://murov.info/climeffects.pptx and http://murov.info/climeffectshealth.pptx. 2100 projection of global warminghttps://climate.nasa.gov/news/2293/nasa-releases-detailed-global-climate-change-projections/ Steve Murov, Prof. Emeritus of Chemistry, Modesto Junior College, http://murov.info

2. Is the climate of the earth undergoing enhanced climate change and if so, are humans significantly contributing to the change?In developing a theory to explain the ice ages, Svante Arrhenius, in 1896, was the first to use basic principles of physical chemistry to calculate estimates of the extent to which increases in atmospheric carbon dioxide (CO2) will increase the Earth's surface temperature through the greenhouse effect.

3. The percent of climate change scientists who consider climate change to be a real human caused threat is: a. 25% b. 50% c. 70% d. 97% e. None of the answers given. D or 97% is the correct answer but non-scientists give a wide range of answers to this question with an average (70%) significantly below the correct answer with only 15% responding 90% or higher. According to a Yale web site, what percentage of people achieve grades of A or B on a basic test on climate change science? a. 8% b. 40% c. 52%Unfortunately % of C + D grades % of F grades8% is correct! Multiple choiceWhat percent of Americans think global warming is caused by humans?a. 10% b. 40% c. 58% d. 75% e. 97% http://climatecommunication.yale.edu/wp-content/uploads/2018/04/Climate-Change-American-Mind-March-2018-1.pdf c. 58%. While climate change scientists have a 97% confidence percentage, non-scientist are much more skeptical.CLIMATE CHANGE SURVEY RESULTS FROM YALE

4. http://environment.yale.edu/climate-communication/article/knowledge-of-climate-change-across-global-warmings-six-americas1The Yale study presents grades for understanding of climate change grouped according to opinions towards climate change. True or False: The chart indicates that the better the understanding, the higher the concern level. People who flunk the climate change test are likely deniers.

5. http://climatecommunication.yale.edu/wp-content/uploads/2016/02/2010_10_Americans’-Knowledge-of-Climate-Change.pdf The Yale survey reveals some American conceptions of the causes of global warming. 61% think the ozone hole contributes and 54% blame aerosol spray cans.Multiple choicea. The ozone hole is intimately connected to global warming.As ozone depletion increases, global warming increases.Ozone depletion and climate change are relatively independent problems. The primary connection is that ozone depletion gases such as chlorofluorocarbons (freons) cause ozone depletion and are also greenhouse gases.d. None of the above.The answer is C as freons contribute to the depletion of ozone and formation of the ozone hole but are also effective Greenhouse gases. The major Greenhouse gases, H2O, CO2 and methane are not responsible for ozone depletion.

6. Time is not on our side.Catastrophic consequences of climate change are just steps away, according to a slew of reports released at the end of 2018. The Intergovernmental Panel on Climate Change (IPCC) says that without swift action, global temperatures will rise by 1.5 °C by 2030 and 2 °C by 2050—and will continue to climb beyond then. Those increases will cause disastrous effects, including record-breaking sea-level rise, flooding, wildfires, extreme weather events, famine, and wildlife habitat destruction, the IPCC says. The impacts will hit the world’s poor particularly hard.Feb. 25, 2019

7. The oxygen that animals need for respiration is O2 or diatomic oxygen. Ozone is O3 and is much more reactive than O2. As a result, O3 is toxic and one of the most damaging gases when present in the lower atmosphere. However, ozone plays the very important role in the stratosphere of filtering harmful ultraviolet rays that cause cancer. Stratospheric ozone was being reduced by the emission of freons into the atmosphere. Fortunately, most of the bad freons are no longer used but it will take several decades for recovery of the ozone layer.More on theozone issue.

8. October average minimum ozone over Antarcticahttps://svs.gsfc.nasa.gov/30602 Ozone depletion by freons was first predicted publicly in the early 70’s. Taken seriously, in 1977, the U.S. acted to phase out the most damaging freons and the world followed in 1987 with the Montreal Protocol. The graph on the upper left shows a slow recovery began about 1995 as a result of the significantly dropped production of freons as shown in the upper right. Images of ozone hole over Antarcticprojected

9. Shell-thickness index of Eurasian Sparrowhawks (Accipiter nisus) in Britain, 1870–1997; the research program came to an end in 1998. Shell-thinning became apparent very quickly from 1947, following the widespread introduction of DDT in agriculture. The problem improved from the 1970s, following progressive restrictions in the use of the chemical, which was banned altogether from 1986. Each dot represents the mean shell index of a clutch (or part-clutch), and more than 2000 clutches are represented from all regions of Britain. Shell index was measured as shell weight (mg)/ shell length 3 breadth (mm). Adapted from Newton 1986. Historical analogies and lessons for climate change include the ozone issue and the DDT problems experienced from the mid 1940’s until the 1990’s. Societal action helped to decrease the impacts of ozone and DDT.

10. Name the four most abundant gases in air excluding water (the humidity varies widely by location, weather, time of the year from a trace to 4%) in decreasing order of abundance. Name formula % abundance Lewis Structure model1. Nitrogen N2 78.1%2. Oxygen O2 20.9% (Note: the Lewis structure for oxygen is one of the few failures of the Lewis structure method as it predicts incorrect magnetic properties of O2)3. Argon Ar 0.93% 4. Carbon CO2 0.04% dioxideMany people do not name nitrogen as the most abundant gas, extremely few name argon as the third most abundant gas and CO2 is commonly named as one of the three most abundant gases. Presumably the latter is a conclusion reached because plants need CO2 and animals exhale CO2. However, only 3% of human exhaled gas is CO2 and most is N2. Why? The importance of these misconceptions is the topic of the next slide.

11. Is the carbon dioxide content of the atmosphere increasing?Multiple choicea. The CO2 concentration has increased by about 50% since 1700.The CO2 concentration averaged about 230 ppm for 800,000 years and about 280 ppm for 1000 to 1800.c. The CO2 concentration leveled off in 2000.The CO2 value of 410.52 ppm is a localized Hawaii value due to volcanic action.e. a and b are true, c and d are false.1960 - 2020800,000 years ago to 2019AD1000 AD to 2020 ADe. a and b are true, c and d are false. CO2 concentrations are obviously increasing (280 ppm to 411 ppm.)Current value= 419 ppm = 0.0419% by vol.and is approachinga 50% increase over pre-industrial value of 280 ppm.

12. True or False – There is a correlation among global temperature and total CO2 concentration.TRUEConclusion:Either the temperature increase causes CO2 to increase or CO2 increases causes temperature to increase.However, the additional correlation with the CO2 production strongly supports CO2 as the cause and temperature as the effect.CO2 production, solid greyTemperature,Dark lineatmospheric CO2,Blue line

13. For slides on the causes and effects of climate change, please visit: http://murov.info/climcauses.pptx , http://murov.info/climeffects.pptx , http://murov.info/climeffectshealth.pptx . For many PowerPointpresentations onother topics, please visit: http://murov.info