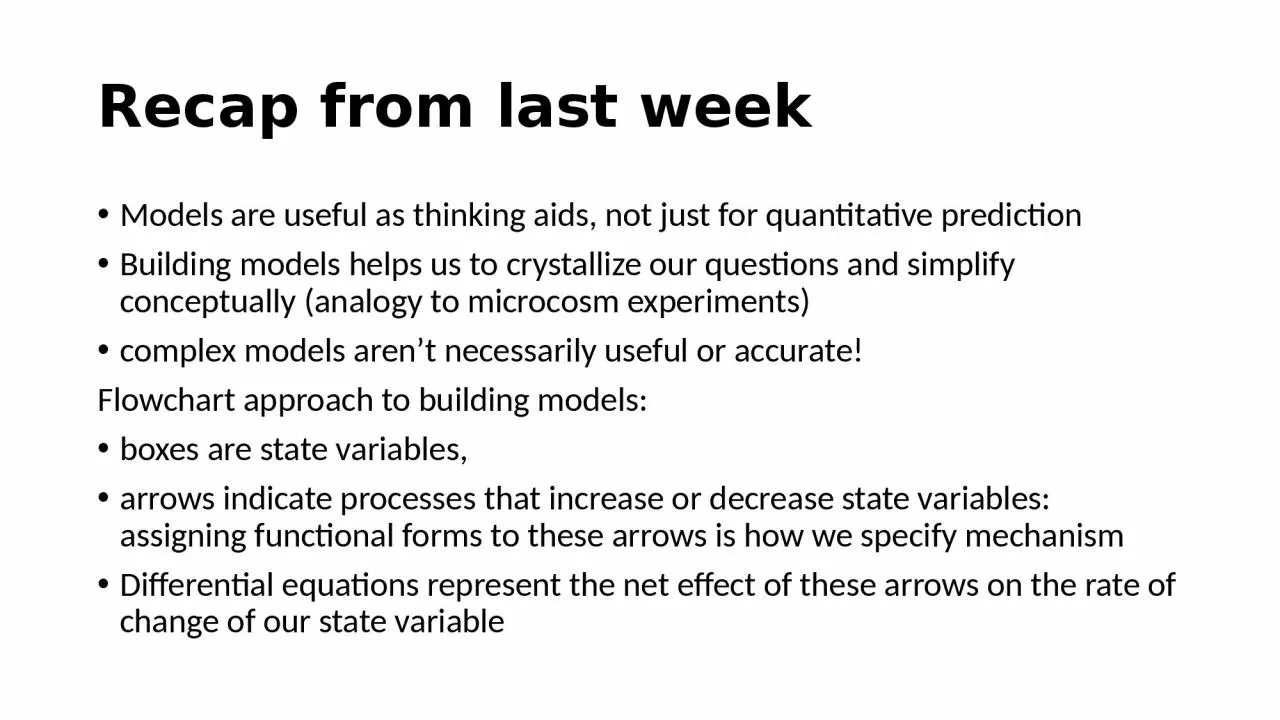
/
Recap from last week Models are useful as thinking aids, not just for quantitative prediction Recap from last week Models are useful as thinking aids, not just for quantitative prediction

Recap from last week Models are useful as thinking aids, not just for quantitative prediction - PowerPoint Presentation

isabella2
isabella2 . @isabella2
Follow
64 views
Uploaded On 2024-01-13

Recap from last week Models are useful as thinking aids, not just for quantitative prediction - PPT Presentation

Building models helps us to crystallize our questions and simplify conceptually analogy to microcosm experiments complex models arent necessarily useful or accurate Flowchart approach to building models ID: 1040615

rate hunting population capita hunting rate capita population size effort birth death functional form growth ratepopulation deriving models unit

Share:

Link:

Embed:

Download Presentation from below link

Download Presentation The PPT/PDF document "Recap from last week Models are useful a..." is the property of its rightful owner. Permission is granted to download and print the materials on this web site for personal, non-commercial use only, and to display it on your personal computer provided you do not modify the materials and that you retain all copyright notices contained in the materials. By downloading content from our website, you accept the terms of this agreement.


Presentation Transcript

1. Recap from last weekModels are useful as thinking aids, not just for quantitative predictionBuilding models helps us to crystallize our questions and simplify conceptually (analogy to microcosm experiments)complex models aren’t necessarily useful or accurate!Flowchart approach to building models:boxes are state variables, arrows indicate processes that increase or decrease state variables: assigning functional forms to these arrows is how we specify mechanismDifferential equations represent the net effect of these arrows on the rate of change of our state variable

2. Quiz results 1 strongly agree, 2 agree, 3 neutral, 4 disagree, 5 strongly disagreeI understand how and why mathematical models are used in Ecology 1.9I feel comfortable critically reading or reviewing ecology papers featuring mathematical models 3.5I know how to build models to answer ecological questions 3.7I can perform some simple analysis of math models (e.g. curve sketching or ”back of the envelope” calculations 3.5I plan to incorporate some mathematical modeling in my research 1.9

3. Logistic growth revisited“Woolly” question – what drives/regulates population growth?Malthus and Verhulst proposed that resources (food) limit growthThis equation seems to do a nice job of describing growth of some populations, but why? Where did it come from? 

4. Resource limitation and population size

5. Resource limitation and population size

6. Resource limitation and population size

7. Resource limitation and population size

8. Resource limitation and population size

9. Aside from being hangry….… what does this mean for individual fitness?

10. Boxes and arrows revisitedPopulation changes through births and deathsbirthsNdeaths

11. Boxes and arrows revisitedPopulation changes through births and deathsbirthsNdeathsTotal birth rate = per capita birth rate x population sizeTotal death rate = per capita death rate x population size

12. MechanismHow does the population size influence per capita birth and death rate?(1) Sketch it!per capita birth ratepopulation size (N)per capita death rateper capita birth ratepopulation size (N)

13. MechanismHow does the population size influence per capita birth and death rate?(1) Sketch it!per capita birth ratepopulation sizeper capita death rateper capita birth ratepopulation sizeMore people = less pie = less babiesMore people = less pie = higher starvation risk

14. MechanismHow does the population size influence per capita birth and death rate?(2) Write down the simplest functional form for your relationshipper capita birth ratepopulation size (N)per capita death rateper capita birth ratepopulation size (N)per capita birth rate = b0 – b1Nper capita death rate = d0 + d1N

15. Translate into equationIn words:Rate of change of population size = total birth rate – total death rate dN/dt = (b0 – b1N) x N – (d0 + d1N) x Nper capita birth ratepopulation sizeper capita death rateper capita birth ratepopulation sizeper capita birth rate = b0 – b1Nper capita death rate = d0 + d1N

16. Over to you: How do I get from this… dN/dt = (b0 – b1N) x N – (d0 + d1N) x N… to this? In other words, how are r and K related to b0, b1, d0 and d1?What does this tell us about their meanings? 

17. Logistic growth - summary r is the maximum population growth rateIncreasing density dependence in the birth or death rate (or both) reduces K (carrying capacity) b0d0

18. Hunting revisitedSo, my wild species exhibits logistic growth via resource limitation, but what else might limit its growth? Hunting by predators or people.Suppose we manage a fishing fleet where we decide how many vessels to deployBecause we have Ecology degrees, we’re interested in sustainable fishing as well as making money

19. QuestionsFor a given amount of hunting effort (e.g. boats deployed), what happens to my population size, and my fishing yield?

20. Conceptual modelHow would you modify this to account for hunting?birthsNdeaths

21. Conceptual modelbirthsNdeathsRemoval by hunting

22. MechanismLet’s call our hunting effort E. How do we think E and N influence the hunting rate (no of animals removed per unit time?)birthsNdeathsRemoval by hunting

23. Deriving a functional form for hunting

24. Deriving a functional form for hunting

25. Deriving a functional form for hunting

26. Deriving a functional form for hunting

27. Deriving a functional form for huntingDoubling effort doubles harvest

28. Deriving a functional form for hunting

29. Deriving a functional form for huntingDoubling population doubles harvest

30. Deriving a functional form for huntingSo, a reasonable first guess for harvest rate (catch per unit time)is q x E x N (what is q?)

31. Building the modelIn words: rate of change of population = growth rate (logistic) – harvest rate  

32. Over to youOur “wooly” question: for a given amount of hunting effort (e.g. boats deployed), what happens to my population size, and my fishing yield?Make the question less wooly: specify the time scale. Are we talking about long time scales? Does deploying a constant hunting effort result in a steady state or equilibrium?What are the response variables? Population size = N evaluated at equilibriumYield = amount harvested per unit time = qEN

33. Over to youSolve this model at equilibrium, and sketch population size (N) and yield (qEN) as functions of hunting effort (E)

34. Open access huntingUnfortunately, hunting isn’t usually managed by a sustainability-minded monopolyHunting of many wild species is unregulated, poorly enforced or poachedQuestion of conservation concern – under open access hunting, how does hunting effort change through time?

35. Hunting effortLet’s measure hunting effort as number of huntersHunting effort increases when more hunters are attracted to the profession, and decreases when they give up hunting – but what determines these rates?E

36. Hunting effortLet’s measure hunting effort as number of huntersHunting effort increases when more hunters are attracted to the profession, and decreases when they give up hunting – but what determines these rates? PROFITE+ $$$$$- $$

37. MechanismSuppose the market price per unit catch is pOne unit of hunting effort (E=1) yields a catch of qN per unit timeSuppose the cost of a unit hunting effort = cHunters will be attracted pqN >c, and deterred if pqN <c E+ $$$$$- $$

38. EquationRate of change of total hunting effort is proportional to total hunting effort x individual profitSo are we done? E  

39. Coupling the human and natural systemsPopulation decreases as exploitation increases, which reduces profit and slows increase in hunting effort – need to couple dynamics of the population to that of exploitation effort E    Nbirths‘natural’ deaths‘hunting’ deathsTotal income(price x catch)Total expenditure(cost x effort)