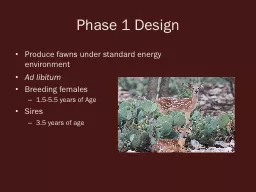
/
Phase 1 Design Produce fawns under standard energy environment Phase 1 Design Produce fawns under standard energy environment

Phase 1 Design Produce fawns under standard energy environment - PowerPoint Presentation

jewelupper
jewelupper . @jewelupper
Follow
343 views
Uploaded On 2020-06-20

Phase 1 Design Produce fawns under standard energy environment - PPT Presentation

Ad libitum Breeding females 1555 years of Age Sires 35 years of age Treatment and Year 2012 2013 2014 M F M F M F SEM L EM SEF LEF SEM L EM SEF LEF SEM L EM SEF LEF ID: 782382

weight antler sem tpwd antler weight tpwd sem 0001 birth year lem lef sef energy lbs body procedure years

Share:

Link:

Embed:

Download Presentation from below link

Download The PPT/PDF document "Phase 1 Design Produce fawns under stand..." is the property of its rightful owner. Permission is granted to download and print the materials on this web site for personal, non-commercial use only, and to display it on your personal computer provided you do not modify the materials and that you retain all copyright notices contained in the materials. By downloading content from our website, you accept the terms of this agreement.


Presentation Transcript

Slide1

Phase 1 Design

Produce fawns under standard energy environmentAd libitumBreeding females 1.5-5.5 years of AgeSires 3.5 years of age

Slide2

Treatment and Year

20122013

2014

M

F

M

F

M

F

SEM

L

EM

SEF

LEF

SEM

L

EM

SEF

LEF

SEM

L

EM

SEF

LEF

Standard Energy Males (SEM)

Low Energy Males (LEM)

Standard Energy Females (SEF)

Low Energy Females (LEF)

Slide3

Population at Weaning

n = 41

n

= 51

n

= 42

TPWD

TPWD

n

= 43

n

= 67

n

= 65

Slide4

Cohort Data

Remain on diet through 4 yrs of ageData collected annually in OctoberWeightTotal Body LengthHind Foot Length

Body Condition Score

Rump Fat

Antler Size

TPWD

Slide5

Diet

Pelleted 16% ProteinVitamin and MineralsStandard Energy > 2.8 Kcal/gLow Energy <

2.2 Kcal/g

DDM; SE = 61.5%, LE = 41.4%

TPWD

TPWD

TPWD

Slide6

Observational

Male Consumption

TPWD

Monthly Mean

Lbs

per Deer

Consumption at 1.5 years (

lbs

)

SEM

LEM

3.22

4.81

Slide7

Observational

Female Consumption

TPWD

Monthly Mean

Lbs

per Deer

Consumption at 1.5 years (

lbs

)

SEF

LEF

2.62

3.82

Slide8

Body Condition is predictive of

treatment

Slide9

Weight is treatment sensitive

Magnitude varies by sex

Variation across ages and birth year

Slide10

Skeletal size overall independent of treatment

Slide11

Weight - Birth Year 2012

TPWD

AGE

SEM

LEM

SEF

LEF

1.5

120.8

-18.5

91.7

-18.8

2.5

141.3

-8.6

104.2

-17.3

3.5

170.1

-26.8

110.8

-16.9

4.5

180.0

-29.6

107.3-14.8

Weight Gain in

lbs

P =

0.0004, P <.0001

Mixed Procedure

Test of Effect

P = 0.2749, P = 0.0003

P

<.0001, P =0.0002

P

< .0001 P <.0001

Slide12

Weight Gain in

lbs

Weight - Birth Year 2013

TPWD

AGE

SEM

LEM

SEF

LEF

1.5

118.1

-21.6

86.8

-.8

2.5

157.2

-35.7

98.4

-5.3

3.5

177.7

-40.2

100.8

-7.8

P

=

0.0001, P

= 0.5212

Mixed Procedure

Test of Effect

P <.0001, P =0.0002

P < .0001, P = .01871

Slide13

Weight - Birth Year 2014

TPWD

AGE

SEM

LEM

SEF

LEF

1.5

118.7

-25.2

88.7

-10.0

2.5

148.1

-35.6

93.5

-5.03

Weight Gain in

lbs

Mixed Procedure

Test of Effect

P

<.0001, P =0.1490

P

<.0001, P =0.0018

Slide14

Slide15

1.5

yrs - Antler Development

Mean Antler BCS

Birth Year

SEM

LEM

2012

74.3

46.9

2013

69.4

49.2

2014

66.2

47.4

Antler Weight

Grams

N = 156

P <.0001

GLM Procedure

Least Square Means

1.5 Median

Slide16

2.5

yrs - Antler Development

Mean Antler BCS

Birth Year

SEM

LEM

2012

117.5

90.9

2013

117.4

95.2

2014

105.9

73.2

2.5 Median

Antler Weight

Grams

N

= 132

P <.0001

GLM Procedure

Least Square Means

Slide17

3.5

yrs - Antler Development

Mean Antler BCS

Birth Year

SEM

LEM

2012

127.0

118.6

2013

144.6

109.1

Antler Weight

grams

P =0.3015

GLM Procedure

Least Square Means

P <.0001

3

.5 Median

N = 69

Slide18

4

.5 yrs - Antler Development

Mean Antler BCS

Birth Year

SEM

LEM

2012

141.1

121.5

Antler Weight

grams

P =0.0344

GLM Procedure

Least Square Means

4.5 Median

N = 20

Slide19

Discussion

At 1.5 and 2.5 years, male body weights and antler size differ by

>

20 percent and > 26 percent

Magnitude of effect for males and females varies by birth year across ages

Body weight and antler size are sensitive to dietary energy

Body Length and Hind Foot Length demonstrate canalization

Female body weights differ by

>

9 percent

Slide20

Discussion

LE consumption greater (>18%) at 1.5 years of age and remains similar with ageIncrease in feed intake not adequate despite more protein Yields opportunity to explore generational changes within a closed population

Slide21

Phase I Phase II

SE

L

E

?

?

Fawns per doe

1.66

Twinning Rate

.63

Twinning Rate

.51

Fawns per doe

1.66

Birth Weight

Male 6.0

Female 5.3

Birth Weight

Male 5.5

Female 5.3

Slide22

Generational Effect

n

= 43

n

=

n

=

n

= 43

n

=

n

=

Slide23

Acknowledgements

Kerr WMAFernando Gutierrez, Bjorn Palm, Evan McCoy, Lisa Wolle, John KinseyMason Mountain and Muse WMAMark Mitchell, Jeff Forman, Kelsey Behrens, Jim Gallagher, Devin Erxleben

Regional TPWD Staff

Numerous Volunteers

Slide24