/
Pension De-Risking Robert Marchessault, Pension De-Risking Robert Marchessault,

Pension De-Risking Robert Marchessault, - PowerPoint Presentation

jubilantbikers
jubilantbikers . @jubilantbikers
Follow
346 views
Uploaded On 2020-06-26

Pension De-Risking Robert Marchessault, - PPT Presentation

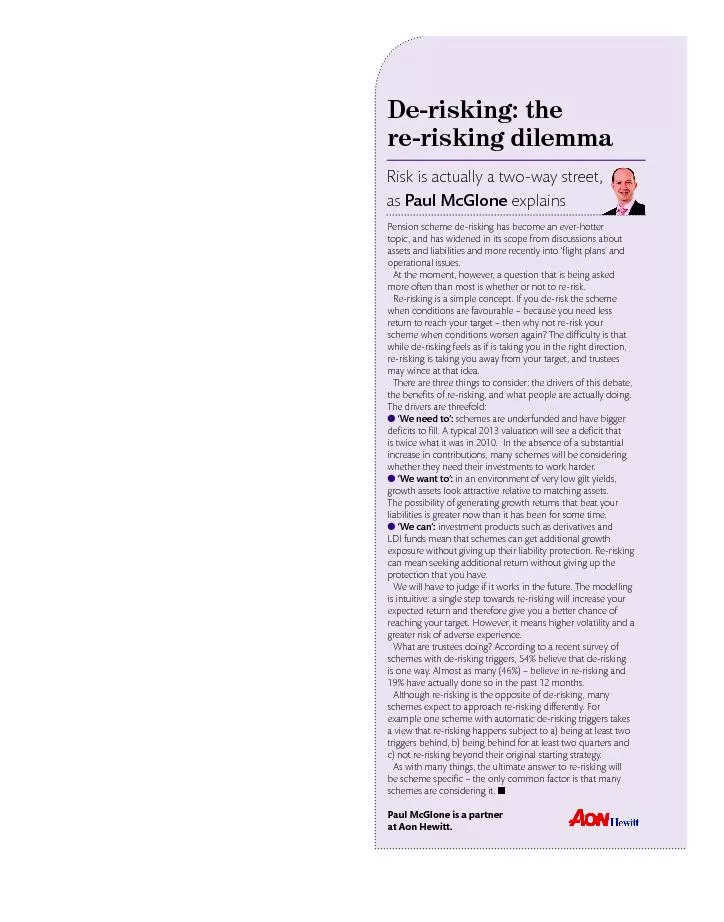
FCIA FSA Director Pension amp actuarial services May 16 2018 Canadas largest communications company Annual revenue 22B Enterprise value 78B Nationwide team 50000 One of the most ID: 788020

pension plan rate risk plan pension risk rate fixed interest strategy longevity solvency liability portfolio years swap overlay life

Share:

Link:

Embed:

Download Presentation from below link

Download The PPT/PDF document "Pension De-Risking Robert Marchessault," is the property of its rightful owner. Permission is granted to download and print the materials on this web site for personal, non-commercial use only, and to display it on your personal computer provided you do not modify the materials and that you retain all copyright notices contained in the materials. By downloading content from our website, you accept the terms of this agreement.


Presentation Transcript

Slide1

Pension De-Risking

Robert Marchessault, FCIA, FSADirector Pension & actuarial services

May 16, 2018

Slide2

Canada’s largest communications company

Annual

revenue

$22B+

Enterprise

value

~$78B

Nationwide team

50,000

One of the most

widely held

stocks in Canada

Customer connections

22M+

Slide3

Canada’s largest private sector pension fund

Active DB members

12,000

Solvency discount rate

~

3.1%

(Dec 31, 2017 prelim)

Longevity swap notional:

$5B

Going concern status

~110

%

Retiree and deferred

42,500

Slide4

Bell’s de-risking context and history

Regularly reassess to adapt to constantly changing environment and evolution of the plans

END POINT: Target Risk Level

Plan design changes

Bond portfolio

changesFunding strategy adjustments

De-risking strategy sophistication

De-risking & “Lock-down” strategiesClosed DB plans to new entrantsAdded DC component to existing DB plans for all new hiresAlign provisions on acquisitions

Increased bond portfolio duration over several years

Increased allocation: Fixed income grown from 40% of assets in 2008 to 70% of assets in 2017Diversify to find spread

Assess if advance contribution is desired

Establish guidelines on deficit funding decision processDaily tracking of financial situation Split portfolio by Return Generating (RGP) and Low Risk (LRP) to better align investment strategy with liability Structure to progressively shift to ultimate asset mix with acceptable risk level (glide path)Risk transfer (longevity swap)Fixed income overlay strategyKeep abreast of emerging initiatives and legislation changes

STARTING POINT

Bell Initiatives

Slide5

Longevity risk

Slide6

Risks remain in the “end game” - longevity risk

Observations

Life expectancy beyond age 65 has been increasing on an absolute basis and at an increasing rate

Current life expectancy beyond age 65 is ~19 years (or 84 years at death)

During the 80’s, life expectancy increased by ~1.0 years

During the 90’s, life expectancy increased by ~1.5 years

From 2002 to 2012, life expectancy increased by ~2 years

Slide7

First longevity insurance in North America

As per the pension plan provisions and not impacted by the longevity insurance

Bell Pension Plan

Variable Cash Flow =

Unindexed

Pension Payments

Pension Payments

Longevity Insurance ContractPartially re-insured with two global re-insurers

Fixed Cash Flow =

agreed monthly schedule~17,000Bell RetireesSun Life AssuranceCompany

Slide8

Swap cash flows - example

$1M swap

Pension Plan payments are fixed and known from day 1

Present value of Fixed Pension Plan payments is $1M under all scenarios

Net present value of exchanged cash flows is minimal under expected longevity

Slide9

Swap cash flows - example

-

Pension Plan payments are fixed and known from day 1 - unchanged

Present value of Fixed Pension Plan payments is $1M under all scenarios

Net present value of exchanged cash flows is $70K payable form insurance company to pension plan

Favourable MTM on swap offsets loss from improved longevity in pension plan (with basis risk)

Slide10

Interest rate risk

Slide11

Interest rate riskProjected DB solvency liability upon DB closure for new employee in 2004

Slide12

Interest rate riskActual DB

solvency liability upon DB closure for new employee in 2004solvency DB liability since plan closure 2004

Slide13

Interest rate riskActual DB

solvency liability upon DB closure for new employee in 2004solvency liability since plan closure 2004

Slide14

Interest rate protection with Overlay

Latest refinement of pension de-risking strategy to protect funded position

Fixed income or “bond” overlays can reduce interest rate risk independent of allocation to growth investments in the portfolio

With borrowing

cost

typically lower than the fixed income portfolio yield, the strategy is expected to generate positive carryInvolves leverage, therefore, total asset portfolio returns are more volatile (i.e. there is a normal risk / return trade-off from using leverage)However, in the context of de-risking strategy the solvency liability and current portfolio position, it has the attributes of being solvency risk reducing and return generating

The use of leverage through fixed income overlays allows the plan to benefit from equity exposure while reducing solvency risk from the interest coverage gap

Current portfolioOverlay“Equities”“Matching assets”Borrowing

Slide15

Stochastic testing of results

Solvency ratio improvement with overlay vs current mix (5 year projection)

The results of 1000 stochastic scenarios

examined

in three groups based on degree of interest rate change

When the observation falls above the horizontal line, the overlay strategy has outperformed the current mixWhen the observation falls to the right of the vertical line, the plan is over 100% fundedThe scenarios where the overlay strategy has underperformed while the plan is under-funded (i.e. where the strategy has added to funding requirements) are in the bottom left, highlighted, quadrant

Declining to modestly rising rates (<175bps)

Significantly rising rates (175bps - 475bps)

Extremely rising rates (>475bps)

Overlay yields superior

expected

returns in most interest rate scenarios

Slide16