/
Climate change risk in an unknowable future Climate change risk in an unknowable future

Climate change risk in an unknowable future - PowerPoint Presentation

khadtale
khadtale . @khadtale
Follow
342 views
Uploaded On 2020-08-06

Climate change risk in an unknowable future - PPT Presentation

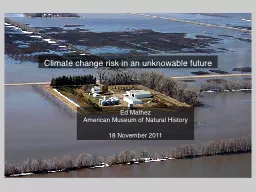
Ed Mathez American Museum of Natural History 18 November 2011 1 Climate change as risk case 1 common floods protected property case 2 uncommon floods no protection Risk determined by ID: 800239

probability climate risk change climate probability change risk sensitivity risks uncertainty feedbacks mega 2009 distribution emissions 2000 earthquake consequences

Share:

Link:

Embed:

Download Presentation from below link

Download The PPT/PDF document "Climate change risk in an unknowable fut..." is the property of its rightful owner. Permission is granted to download and print the materials on this web site for personal, non-commercial use only, and to display it on your personal computer provided you do not modify the materials and that you retain all copyright notices contained in the materials. By downloading content from our website, you accept the terms of this agreement.


Presentation Transcript

Slide1

Climate change risk in an unknowable future

Ed Mathez

American Museum of Natural History

18 November 2011

Slide2

1. Climate change as risk…

case 1: common floods, protected property

Slide3

case 2: uncommon floods, no protection

Slide4

Risk determined by:

(a) probability of an event occurring

(b) and consequences if it does

case 2: uncommon floods, no protection

Risk =

p

e

x

p

d

x c

p

e

= probability of an event

p

d

= probability of damage

c = consequence (cost in $, lives, etc.)

Slide5

The nature of climate risk

Why future climate is unknowableWhy risks differ depending on nature of impactWhy risks depend on extremesWhy risks depend on natural climate variabilityPositive feedbacks result in an inherent uncertainty in how the climate system responds to forcings

Could there be climate mega-events that pose risks similar to earthquake mega-events?

Slide6

Meinshausen et al., 2009; Allen et al., 2009

probability of exceeding 2°C

> preindustrial by 2100

Cumulative CO

2

emissions, 2000-2049, Gt CO

2

uncertainty of climate sensitivity to CO

2

rise

0 500 1000 1500 2000 2500

100%

50%

0%

1. Why future climate is unknowable

illustrative default

Slide7

Cumulative CO

2 emissions, 2000-2049, Gt CO2

uncertainty of climate sensitivity to CO

2

rise

0 500 1000 1500 2000 2500

100%

50%

0%

1000 Gt CO

2

42%

25%

10%

probability of exceeding 2°C

> preindustrial by 2100

illustrative default

Slide8

Cumulative CO

2 emissions, 2000-2049, Gt CO2

0 500 1000 1500 2000 2500

100%

50%

0%

emission growth at 2% per yr

42%

34%

20%

constant 2008 emissions

developed countries 80% cut, developing 1% growth

global 80% cut from 2010

88%

probability of exceeding 2°C

> preindustrial by 2100

Slide9

Cumulative CO

2 emissions, 2000-2049, Gt CO2

0 500 1000 1500 2000 2500

100%

50%

0%

emission growth at 2% per yr

20%

global 80% cut from 2010

88%

uncertainty of climate sensitivity to CO

2

rise

(science)

uncertainty in emissions

(socioeconomic, technologic, political development)

probability of exceeding 2°C

> preindustrial by 2100

Slide10

According to the UN

’s Framework Convention on Climate Change, avoiding “dangerous anthropogenic interference” meansallowing “ecosystems to adapt naturally to climate change,”

ensuring that

food production is not threatened,

and enabling

economic development to proceed in a sustainable manner.

”To help identify “dangerous anthropogenic interference,” the IPCC (2001)defined “reasons for concern” grouped them into categories reflecting different levels of risk

2. Why risks are different for different classes of impacts

Slide11

temperature, risk

Smith et al., 2009

Increased damage to unique and threatened systems

Single climate phenomenon with a major, world-wide impact

Number of impact metrics that are negative

Proportion of world population (or region) experiencing negative impact

Number of extreme weather events with substantial consequences

Slide12

Different risks and different timeframes…

Possible consequences…

loss of biodiversity more likely mild this decade

loss of sensitive ecosystems

severe storms/floods

severe heat waves

severe droughts

large increase in human diseases

significantly reduced water supplies

damaging sea level rise

widespread famine less likely catastrophic several decades

Slide13

The extreme summer temperature in 2003 compared with summer temperatures from 1864 to 2002, Switzerland

Mathez, 2009, after

Schar

et al., 2004

3

. How risks are governed by extremes

The western European summer heat wave of 2003

Slide14

Schä

r et al., 2004

2003

1864-2002 observed (CH)

1961-1990 JJA model simulation

2071-2100 JJA model simulation (A2 scenario)

(c) SCEN - CTRL

and

(d) relative change in std deviation

Slide15

Schä

r et al., 2004

2003

1864-2002 observed (CH)

1961-1990 JJA model simulation

2071-2100 JJA model simulation (A2 scenario)

(c) SCEN - CTRL

and

(d) relative change in std deviation

While we usually talk about mitigation efforts in terms of average conditions, we must remember that

it is the extreme rather than average condition that determines the risk

tomorrow

s extreme (and thus risk) could be much larger than today

s

Slide16

Percent change in rainfall relative to 1900-2008 mean

El Niño spring-summer

La Niña spring-summer

Verdon-Kidd and Kiem, 2010

4. How risks depend on natural climate variability

Slide17

Verdon-Kidd and Kiem, 2010

Multi-decadal variations in ratio of El Niño to La Niña years

Ratio of El Niño to La Niña (in 15-year window)

Fifteen-year running window of relative El Ni

ño to La Niña frequency

(from tree-ring chronologies from American SW of D

Arrigo et al., 2005)

Slide18

5. The inherent uncertainty due to positive feedbacks

1. Consider an expression for the sensitivity of climate to changes in radiative flux,

T =

R

f

.where

T

= equilibrium change in global mean surface air T (i.e., climate

sensitivity)

Rf = increment change in downward radiative flux  = constant When there are no feedbacks,  = 0 and 

T = T0, and

T0 = 0 Rf. (1)

Roe and Baker, 2007

Slide19

2. However, the system contains feedbacks, and those feedbacks are in total strongly positive, so

T/T0 > 1.

Assume that the change in forcing as a result of the feedbacks is

C x

T

(

C

= constant), i.e.,

CT is the added forcing due to the feedbacks. Then T = 0 (Rf + CT) (2)Substituting (1), T0 =

0

Rf, into (2) allows us to express T in terms of T0: T = T0 +

0(CT). (3)

Roe and Baker, 2007

Slide20

3. Define a total feedback factor,

f, with a magnitude f = 0 C. (4)

Substituting (4) into (3),

T =

T

0

+

0(CT), and rearranging yields T = T0 / (1 – f) (5)This expression relates

T

and

f

. When f > 0 (positive feedback), T/T0 > 1.

Roe and Baker, 2007

Slide21

h

T(

T)

= probability distribution that climate sensitivity is

T

Roe and Baker, 2007

h

f

(f)

= probability distribution of

f

, e.g., a normal distribution

4.

Slide22

h

T(

T)

= probability distribution that climate sensitivity is

T

Roe and Baker, 2007

h

f

(f)

= probability distribution of

f

, e.g., a normal distribution

4.

1.

Uncertainty is inherent in the system where net feedbacks are substantially positive.

2.

We can expect only limited improvement in our ability to reduce uncertainty in climate sensitivity.

Slide23

6. Mega-climate and mega- earthquakes events

Tōhoku (Honshu) earthquake

http://earthquake.usgs.gov/earthquakes/eqinthenews/2011/usc0001xgp/031111_M9.0prelim_geodetic_slip.php

Slide24

cascading consequences from a mega-earthquake

Slide25

cascading consequences from a mega-earthquake

Slide26

cascading consequences from a mega-earthquake

Slide27

cascading consequences from a mega-drought?

Indonesia, 2009 (D. Mahendra, Flickr)

Mogadishu, 2011

Slide28

To summarize…

Climate change should be popularly understood as an issue of risk, not an issue of science.

The major uncertainty in future climate is growth of emissions, which is impossible to predict because it depends on socioeconomic, technologic and political developments.

The risks associated with different impacts are different, e.g., destruction of sensitive ecosystems (high probability, limited consequence) vs world famine (low probability, severe consequence).

Risks depend on the extreme events and natural climate variability.

The probability distribution of climate sensitivity to GHG buildup displays a long tail on the high-T and a short tail on the low-T side. The distribution is inherent to systems with positive feedbacks, implying limited ability to reduce climate sensitivity uncertainty.

Climate risk displays some similarities to earthquake risk. In particular, mega-events may lead to cascades of consequences that are difficult (perhaps impossible) to predict.

Slide29

What to show your parents…

http://www.youtube.com/watch?v=mF_anaVcCXg

Slide30

Some references

Allen, M.R., et al., 2009, Warming caused by cumulative carbon emissions towards the trillionth tonne. Nature 458, 1163-1166. Meinhausen, M., et al., 2009, Greenhouse-gas emission targets for limiting global warming to 2°C. Nature 458, 1158-1163. Roe, G.H., and M.B. Baker, 2007, Why is climate sensitivity so unpredictable? Science 318, 629-632. Schär, C., et al., 2004, The role of increasing temperature variability in European summer heatwaves. Nature

427

, 332-336.


Smith et al., 2009, Assessing dangerous climate change through an update of the Intergovernmental Panel on Climate Change (IPCC)

reasons for concern

. PNAS 106 4133-4137. Verdon-Kidd, D.C., and A. Kiem, 2010, Quantifying drought risk in a nonstationary climate. J. Hydrometeorology 11, 1019-1031.