/
OTT ADC      Acoustic Digital Current Meter: Description of meter and Results of USGS OTT ADC      Acoustic Digital Current Meter: Description of meter and Results of USGS

OTT ADC Acoustic Digital Current Meter: Description of meter and Results of USGS - PowerPoint Presentation

kittie-lecroy
kittie-lecroy . @kittie-lecroy
Follow
342 views
Uploaded On 2020-01-14

OTT ADC Acoustic Digital Current Meter: Description of meter and Results of USGS - PPT Presentation

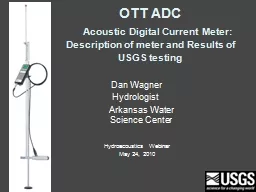
OTT ADC Acoustic Digital Current Meter Description of meter and Results of USGS testing Dan Wagner Hydrologist Arkansas Water Science Center Hydroacoustics Webinar May 24 2010 Outline ID: 772844

figure courtesy ott measurement courtesy figure measurement ott adc creek check depth volume velocity usgs sample meter adv quality

Share:

Link:

Embed:

Download Presentation from below link

Download Presentation The PPT/PDF document "OTT ADC Acoustic Digital Current Me..." is the property of its rightful owner. Permission is granted to download and print the materials on this web site for personal, non-commercial use only, and to display it on your personal computer provided you do not modify the materials and that you retain all copyright notices contained in the materials. By downloading content from our website, you accept the terms of this agreement.


Presentation Transcript

OTT ADC Acoustic Digital Current Meter: Description of meter and Results of USGS testing Dan Wagner Hydrologist Arkansas Water Science Center Hydroacoustics Webinar May 24, 2010

OutlineDescription of ADCResults of USGS TestingNew USGS Firmware / enhancements

ADC HistoryReleased in USA December 2007 Testing by HIF, HAWG, and WSCs from 2008-2010New USGS Firmware currently in Beta Testing

System Components Figure courtesy of OTT

Handheld Display Figure courtesy of OTT

Handheld Display Operation Figure courtesy of OTT

Display Screen Figure courtesy of OTT

Location of Sample Volume ADC ADV

Measuring Principle Two 6 MHz acoustic transducers Large sample volume located in front of sensorLarge sample volume reduces potential signal-to- noise (SNR) issues, reduces error with flow anglesTwo sample volumesImproves data precisionInternal cross correlation calculation verifies measurement accuracy and identifies potential boundary issues 4 in 2 in Sensor head Sample volume 2 Sample volume 1 0.4 in Figure courtesy of OTT

1. Transmit – Receive - Digitize 2. Transmit – Receive - Digitize Break Cross Correlation Check for similarities Calculation of time shift D t Calculation of flow velocity 3.93 in 1.97 in 0.4 in Measuring Principle Slide courtesy of OTT

Depth Sensor Calibrate by zeroing to atmospheric pressure on site (raise out of water to calibrate) Get depth for each vertical by first lowering meter to bottom, rod offset computed automaticallyHand-held display shows target depth and actual depth for velocity measurement in vertical depending on the velocity method selected by the user. Depth sensor can be turned off with new firmware

QA/QC Figure courtesy of OTT

QA/QC checksWith new USGS firmware, a Quick QA/QC check is performed in office (similar to ADV beam check, can print results)Pre-measurement QA/QC check is logged with measurement file and appears on printout

Qreview Software-Data Download

Measurement Review

Arkansas Test Sites N

Vmean, Test Measurements Site V mean,ADV V mean,ADC % error Mud Creek 0.03 0.014 -53.3 Richland Creek 0.39 0.45 +15.4 Brush Creek 0.46 0.42 -8.7 Baron Fork 0.49 0.44 -10.2 Flint Creek nr. West Siloam Springs 0.60 0.58 -3.3 Flint Creek nr. Springtown 0.80 0.77 -3.3

Vmean, Test Measurements Site V mean,ADV V mean,ADC % error Illinois River nr. Savoy 0.84 0.90 +7.1 Bear Creek 0.85 0.84 -1.2 Middle Fork White River 1.22 1.14 -6.6 Osage Creek 1.47 1.45 -1.4 Yocum Creek 1.97 1.95 -1.0 White River nr. Fayetteville 2.04 2.05 +0.49

Percent Difference of Velocity Measured with ADC Relative to Velocity Measured with ADV

Figure courtesy of Kevin Oberg, OSW

Figure courtesy of Kevin Oberg, OSW

Figure courtesy of Kevin Oberg, OSW

Figure courtesy of Kevin Oberg, OSW

Figure courtesy of Kirk Thibideaux, HIF

ADC Pros/Cons-prior to USGS firmwarePros: Depth SensorSample volume in front of meter Rugged Construction, cablingRechargeable battery2 beams-improved performance in environments with low SNR, anglesLive velocity reading-can help with meter placementCons: Depth SensorSample volume in front of meter Rechargeable battery (?)Can’t edit erroneous stations until reviewing the measurement in QreviewLack of beam check (“bucket test”) and/or quick field QA/QC check that is logged with measurement Lack of QA/QC warnings during measurement (i.e., for 0.2/0.8 velocity discrepancies, bad correlation resulting from bad boundary conditions

Software Enhancements Enhanced quality assuranceIncluding pre-deployment quality check and field quality checkAbility to enter rated Q Expanded character limits for station name and number and addition of measurement numberComputation and recording of averaged flow anglesOn-screen warning messages, a.k.a., Measurement GuidanceProvide user with options to improve measurement resultsOption to turn off depth sensorEnhanced measurement reviewDetailed discharge and quality check reports Warning and potential quality issue logsOne-second time series data

New ADC QA/QC Warnings Figure courtesy of OTT

Questions?