/
Low Cost Transient Fault Protection Low Cost Transient Fault Protection

Low Cost Transient Fault Protection - PowerPoint Presentation

luanne-stotts
luanne-stotts . @luanne-stotts
Follow
350 views
Uploaded On 2018-11-16

Low Cost Transient Fault Protection - PPT Presentation

Using Loop Output Prediction Sunghyun Park Shikai Li Scott Mahlke 1 Fault Protection Strategy Fault Protection Strategy Value1 Value2 False True Orig copy 2nd copy Fault Correction ID: 729783

data fault strategy protection fault data protection strategy phase validation computation elements copy false output interpolation previous expensive overhead

Share:

Link:

Embed:

Download Presentation from below link

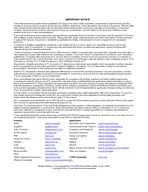
Download Presentation The PPT/PDF document "Low Cost Transient Fault Protection" is the property of its rightful owner. Permission is granted to download and print the materials on this web site for personal, non-commercial use only, and to display it on your personal computer provided you do not modify the materials and that you retain all copyright notices contained in the materials. By downloading content from our website, you accept the terms of this agreement.


Presentation Transcript

Slide1

Low Cost Transient Fault ProtectionUsing Loop Output Prediction

Sunghyun Park, Shikai Li, Scott Mahlke

1Slide2

Fault Protection Strategy

Fault Protection Strategy

=

Value_1

Value_2

False

True

Orig. copy

2nd copy

Fault Correction

+

Redundancy

+ Validation

2Slide3

Fault Protection Strategy

Fault Protection Strategy

=

Value_1

Value_2

False

True

Orig. copy

2nd copy

Fault Correction

+

Redundancy

+ Validation

Option 1. Redundant Hardware

Option 2. Redundant Thread

Option 3. Redundant Instruction

Hardware cost

Runtime Overhead

3Slide4

Fault Protection Strategy

Fault Protection Strategy

=

Value_1

Value_2

False

True

Orig. copy

2nd copy

Fault Correction

+

Redundancy

+ Validation

Option 1. Redundant Hardware

Option 2. Redundant Thread

Option 3. Redundant Instruction

Hardware cost

Runtime Overhead

Still, Expensive!

Most of time, we are safe.

4Slide5

Objective of This Work

Challenges on Transient Fault Protection

Occurs randomly in any space and time

May cause fatal failure or no impact at all

Hard to defend in a cost-efficient manner

Objective

Remove HW cost and requirements

Minimize runtime overhead of previous SW techniques

Provide full protection : Detection + Recovery

5Slide6

Conventional techniques

SWIFT : Detection strategy with instruction duplication

Validation at synchronization points (e.g. store, branch, function calls…)

6

Address validation

Computation validation

Validation at storeSlide7

Effective when ILP is high.Hide increase of dynamic instructions in hardware parallelism.But if it cannot…

Expected to suffer at loops!Recurring synchronization points (e.g. branch, store)7

Conventional techniquesSlide8

8

Idea

Previous value validation

Our value validationSlide9

Our Strategy

New Fault Protection Strategy

Value_1

Value_2

False

True

Orig. copy

2nd copy

Fault Correction

+ Predict the output of re-computation

+

Fuzzy validation w/ Error Bound (EB)

Acceptable : Skip expensive re-computations

Unacceptable : Trigger re-computation

9

“False Negative can occur, but it will have marginal impact with proper error bound.”

Need to find a proper EB.Slide10

Our Strategy

New Fault Protection Strategy

Value_1

Value_2

False

True

Orig. copy

2nd copy

Fault Correction

+ Predict the output of re-computation

+

Fuzzy validation w/ Error Bound (EB)

Acceptable : Skip expensive re-computations

Unacceptable : Trigger re-computation

10

“Misprediction have

NO impact on output quality.”

Prediction is ONLY used for validation!Slide11

Our Strategy

New Fault Protection Strategy

Value_1

Value_2

False

True

Orig. copy

2nd copy

Fault Correction

+ Predict the output of re-computation

+

Fuzzy validation w/ Error Bound (EB)

Acceptable : Skip expensive re-computations

Unacceptable : Trigger re-computation

11

“Misprediction (False Positive, False Alarm) causes runtime overhead.”

 N

eed cheap & accurate prediction model

to maximize performance!Slide12

12

Our Strategy

Recovery mechanism

will be triggered on…

- Detected fault

-

Misprediction(False positive, False alarm)

Can be studied independently with detection strategy.

- In this paper, we simply re-compute! (like TMR)Slide13

Approximation Target

Large loops that updates array elements.

Particular types will be excluded for approximation.

Pointer values, induction variable, …

13Slide14

Approximation Target

Function

@

blackscholes

, PARSEC

14Slide15

Approximation Target

Reduction Loop @

lud

,

Rodinia

15Slide16

Previous Work

Spatio

-Value similarity

16

“ Data elements that exhibit spatial regularity in memory are approximately similar in value “

* Bunker Cache 16’MICRO Slide17

Previous Work

Spatio

-Value similarity

17

“ Data elements that exhibit spatial regularity in memory are approximately similar in value “

* Bunker Cache 16’MICRO Slide18

Previous Work

Spatio

-Value similarity

A

B

C

A ≈ B

B ≈ C

18

“ Data elements that exhibit spatial regularity in memory are approximately similar in value “

* Bunker Cache 16’MICRO Slide19

Previous Work

Spatio

-Value similarity

A

B

C

A ≈ B

B ≈ C

Then, A ≈ C ???

19

“ Data elements that exhibit spatial regularity in memory are approximately similar in value “

* Bunker Cache 16’MICRO Slide20

Previous Work

Spatio

-Value similarity

A

B

C

A ≈ B

B ≈ C

Then, A ≈ C ???

How about D ???

20

“ Data elements that exhibit spatial regularity in memory are approximately similar in value “

* Bunker Cache 16’MICRO

DSlide21

Observation

Spatio

-Value similarity

Increasing trend in brightness towards D.

21

“ Data elements that exhibit spatial regularity in memory tend to approximately

follow the certain trend

A

B

C

DSlide22

Dynamic Interpolation

Interpolation

Expensive computation

 Cheap linear equation

22

Output of Data element

IterationSlide23

Dynamic Interpolation

Interpolation

Expensive computation

 Cheap linear equation

23

Iteration

Output of Data elementSlide24

Dynamic Interpolation

Interpolation

Expensive computation

 Cheap linear equation

Phase

: Data elements with the same linear equation.

24

Phase

Iteration

Output of Data elementSlide25

Dynamic Interpolation

Interpolation

Expensive computation

 Cheap linear equation

Phase

: Data elements with the same linear equation.

How to cut the phase on data elements?

25

Iteration

Huge trend

Short trends

Phase

Phase

Phase

Output of Data elementSlide26

Dynamic Interpolation

Interpolation

Expensive computation

 Cheap linear equation

Phase

: Data elements with the same linear equation.

How to cut the phase on data elements?

26

Iteration

Huge trend

Short trends

Phase

Phase

Phase

Let’s use an original computation as runtime guidance!

Output of Data elementSlide27

Dynamic Interpolation

27

Idea

Monitor the latest slope changes of original computations and decide whether to cut the phase or not.

When slope change is above threshold (approximation aggressiveness), cut the phase!Slide28

Why do we need threshold?Greedy approach for future values

Optimistically expect to have more data elements on the current trend after the outlier.

Necessity of Threshold

Smaller Threshold

Bigger Threshold

28Slide29

Implementation

29

Assumption

Threshold is already known.

 Under the hood, runtime management will handle it.Slide30

Implementation

30Slide31

Implementation

31Slide32

Implementation

32Slide33

Implementation

33Slide34

Implementation

34Slide35

System Overview

RSkip

Fully automatic compilation system

No HW modification

No preprocessing

Runtime management

35Slide36

Runtime management

Idea : A certain group of input sets is expected to show a similar pattern of local trends.

We can use the same threshold.

Program signature

Represent pattern of local trends

Defined by statistics of slope changes in samples

36

Input1

Input2

Input 1 and Input 2 will have

same program signature.

Loop output

IterationSlide37

Experiment Setup

LLVM Infrastructure

Error bound : 20%

Five compute-intensive benchmarks

Baseline : SWIFT-R (SWIFT + Recovery mechanism)

Overhead (Performance) Experiment

Intel Xeon CPU E31230 with 3.20GHz (Quad Core)

32KB I-cache, D-cache each (Private)

256KB L2-cahce, 8192KB L3-cache (Shared)

37Slide38

Performance Evaluation

Overhead Analysis

38

SWIFT-R suffers at the loops!

 recurring synchronization pointsSlide39

Performance Evaluation

Overhead Analysis

39

SWIFT-R suffers at the loops!

 recurring synchronization points

83.9% of Skip RateSlide40

Experiment Setup

Fault Injection Experiment

GEM5,

Syscall

Emulation Mode

Out-of-order configuration with ARMv7-A

A single random bit flip in random register

1000 runs per application (1 injection/run)

Result categories

40

Category

Description

CORRECT

Produce 100% correct outputSDC

Normal termination with corrupted outputSEGFAULTTermination due to wrong memory access

CORECore dump (e.g. corrupted opcode)HANG

Program falls into infinite loopSlide41

Evaluation

Fault Protection

41

Unsafe (68%), SWIFT-R (97.8%),

Rskip

(97.3%)

With 20% of EB,

RSkip

can provide high protection rate close to SWIFT-R!Slide42

Conclusion

Necessity for cost-Efficient protection technique

RSkip

Prediction based protection w/ fuzzy validation

New applicability of approximate computing techniques

Overhead : 1.20x (Previous work : 2.89x) for target loops

Similar level of fault coverage with previous work

42Slide43

Thank you!43