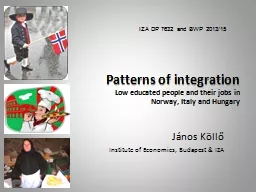
Norway Italy and Hungary János Köllő Institute of Economics Budapest amp IZA IZA DP 7632 and BWP 201315 I compare people with 010 years of schoolbased education in three countries which provide their unskilled population with work highly successfuly Norway moreorless successfu ID: 644638
Download Presentation The PPT/PDF document "Patterns of integration Low educated peo..." is the property of its rightful owner. Permission is granted to download and print the materials on this web site for personal, non-commercial use only, and to display it on your personal computer provided you do not modify the materials and that you retain all copyright notices contained in the materials. By downloading content from our website, you accept the terms of this agreement.
Slide1
Patterns of integrationLow educated people and their jobs in Norway, Italy and Hungary
János KöllőInstitute of Economics, Budapest & IZA
IZA DP 7632 and BWP 2013/15Slide2
I compare people with 0-10 years of school-based education in three countries, which provide their unskilled population with work highly successfuly (Norway), more-or-less successfully (Italy) and completely unsuccessfully (Hungary)Hungary’s failure is not unique. The CEEs fail as a group, which calls for explanations other than those referring to national institutions and policies (MW, benefits, ALMP, etc.)This paper looks at the role of skills and skill requirements, supposing that integration is easier to achieve if:
the supply of simple jobs is abundantor low educated adults accumulate sufficient cognitive and non-cognitive skills to attend complex jobsor firms are able/willing to bridge the gap between skills and skill requirements
The paperSlide3
1) How the composition of jobs by complexity and firms’ willingness to hire low educated labor (given
complexity) contribute to unskilled employment?2) To what extent are the low educated engaged in various forms of post-school skills formation?3) What is the role of small-firms and self-employment in the unskilled labor market?**Asked under the assumption that small businesses can deal with skill deficiencies more successfully than do large formal organizations
Related questionsSlide4
Hungary, Norway and Italy participated in two international skill surveys: Adult Literacy and Life Skills Survey (ALL, 2003, 2008). International Adult Literacy Survey (IALS 1998)The analysis is predominantly based on ALL, which contains data on 4493 Norwegians, 5830 Italians and 4875 Hungarians (prime age adults, students excluded), of wich 21, 46 and 25 per cent are low educated.
The key variables are education, workplace duties requiring literacy, numeracy and communication skills, participation in skill enhancing activities and firm sizeThe literacy test scores are used marginally because of endogeneity (test score employment, test score job complexity)DataSlide5
Literature5
The bulk of the related literature on CEEs analyze national institutions (welfare, ALMP, stc.) or the transition process (OST models)The questions of this paper have more to do with the SBTC and job polarization literature discussing the linkages between job content and relative demand. However, the SBTC literature typically deals with the college/no college or production/non-production division.ALL is new, no academic research as yet. Papers working with IALS data predominantly compare test results or look at the linkages between test scores and wages.Micklewright & Brown (
2004), Micklewright & Schnepf (2004), Devroye
& Freeman (2000), Blau & Kahn (2000)
, Denny et al. (2004), Carbonaro (2002
)
McIntosh
& Vignoles (
2000
)Slide6
The low-educated population6
0) Basic descriptive statisticsSlide7
Table 1: Share of the unskilled
Norway
Italy
Hungary
0-10 years in school
a
IALS
19.0
52.4
28.6
ALL
20.5
46.1
24.6
ISCED 0-2
IALS
11.7
55.2
28.3ALL12.648.724.7The data relate to the population aged 15-64 excluding students and persons, who are older than 35 and never worked.a) Completed 0-10 years in school. Based on the question on the number of completed schoolyears not counting repeated years (a1) in both surveys, except for Norway in the IALS (a8no). Sampling errors t.b.a.
Norway
adopted
the international methodology of defining ISCED codes only in 2006. The reform brought up the ISCED 0-2 share from 10 to 20%
Size of the low educated population
7Slide8
Skills of the low educated population
8Absolute terms: Norway >> Hungary > Italy
Relative terms: Norway > Hungary ItalyTreat the absolute values with cautionSlide9
Employment of the low educated population
Absolute terms: Norway Italy >> HungaryRelative terms: Norway Italy >> HungaryNote that the data above exclude persons older than 35, who never worked before (mostly Italian
housewives). Discussion in the paper.Slide10
101) Job complexity and unskilled employment Slide11
Measuring job complexity
11Slide12
Measures of job complexity: Number of tasks (0-17)
Number of Type 1 tasks (0-11) Number of tasks weighted with their effect on wages in the pooled sample 17 task dummies as controls, occasionally
Measuring job complexity
12Slide13
Share effect
How the share of the unskilled in j-type jobs relates to their population share?
Size effect
How many j-type jobs are at the disposal of the entire working age population?
Total contribution
Contribution of j-type jobs to the employment to population ratio of the low educated population
D
ecomposition
of the unskilled employment to population ratio
13Slide14
The distribution of jobs by complexity14
Norway: most jobs require 6-16 tasks, with a mode at R=10
Italy: many simple jobs, a mode of R=0 Hungary: a distribution closer to Italy’s but far less simple jobs
95% confidence intervals based on jacknife survey standard errorsSlide15
The unskilled share by job complexity15
95% confidence intervals based on jacknife survey standard errors. The population shares are indicated by the horizontal lines.
Norway: steeply rising shares as we move toward simple jobs. Shares above the population share if R<9
Italy:very high shares in simple jobs, above the population share if R<6.Hungary: no steep rise as we move to simple jobs. Shares exceeding the population share if R<5. (R=0 if only Type 1 tasks are considered). The shares are lower than in Italy in middling and highly complex jobsSlide16
Total contributions to the unskilled employment to population ratios
Norway: the bulk of unskilled employment comes from jobs requiring 6-12 tasks
Italy: simple (R=0) jobs have far the largest contributions
Hungary: similar to Italy but the contributions are smaller in simple and middling jobs
95% confidence intervals based on jacknife survey standard errorsSlide17
172) Post-school skill formationHow can low educated people attend complex jobs?Slide18
Post-school skills formation Adult training
Informal learning activities Acquiring skills at homeCivil integrationEndogeneity: work as a source of literacy18Slide19
Post-school skill formation19
Norway performs slightly better in absolute termsThe ranking in relative terms is ambiguousNote that the Norwegian school system does not perform very well according to the PISA surveysSlide20
Post-school skill formation20
Participation in formal adult training is about 6 times as frequent in Norway as in Italy and HungaryAbout 2 -2.5 times more frequent in relative termsSlide21
Post-school skill formation21
Substantial difference between Norway and ItalySmaller difference between Italy and Hungary, especially in relative termsSlide22
Post-school skill formation22
Substantial difference between Norway and Italy/Hungary except for reading newspapers and magazinesSlide23
Post-school skill formation23
Huge difference between Norway and ItalySmaller between Italy and Hungary, especially in relative terms.Participation rates are very low in absolute terms in Italy and especially in HungarySlide24
Post-school skill formation24
Huge difference between Norway and Italy/HungaryPractically no difference, and very low absolute levels in Italy and HungarySlide25
Post-school skill formation25
Practically all Norwegians take part in at least one activity compared to only ½ of the Italians and 1/3 of the HungariansOver 40 per cent of the Norwegians take part in 6 or more activities compared to only 7 and 2 per cent of the HungariansSlide26
Post-school skill formation26
Index= employment probability * average number of literacy tasks to be performed at work = prob*degree of exposureIntended to capture the exposure of the low educated population to literacy-intensive tasks through workHuge difference between Norway and ItalySmaller but significant difference between Italy and HungarySlide27
27
3) Small businesses How can low educated people attend complex jobs?Slide28
Decomposition of the unskilled employment ratio by firms size
Norway: the bulk of unskilled employment comes from large firmsItaly: the bulk of unskilled employment comes from small firms, including self-employmentHungary: roughly equal contributionsSlide29
29Small firms in Italy
The Italian small business sector employs a much higher share of low educated workers in complex jobs. Is it about a selection effect (from within a large low educated population)?Slide30
Efficient selection and/or learning by doing?In generalItaly: large uneducated population
wider scope for selection by actual skills.Indeed: test scores rise more steeply as we move toward complex jobs in ItalyMore efficient learning by doing might also produce the same correlation but such an assumption seems quite arbitrary Slide31
31Efficient selection and/or learning by doing?By firm size
If not a selection effect?Selection on non-cognitive skills?Intense inter-personal interactions
help in overcoming skill deficiencies?The skills gap is not managed
successfuly i.e. ‘solved’ at the cost of inefficiencies?Slide32
More simple jobs than in Norway but much less than in ItalyThe unskilled share is low everywhere including simple jobs (substitution with vocationally trained workers?)***Far from Norway in terms of post-school skill formation and civil integration
Far from Italy in terms of integration through a ‘permissive’ small business sector***We basically (still) observe the implications of the damage that state socialism had made to the traditional private economy, on the one hand, and civil society, on the other***Heading for Italy or Norway?
Conclusions for HungarySlide33
33Thank youSlide34
Extremely low rate of unskilled employment in both absolute and relative terms. The CEEs fail as a groupUnskilled E rate = CEE + u (country level OLS, EU LFS data) explains 61 per cent of the cross-country variation
Prob(E| unskilled) = CEE (individual level, pooled EU LFS) correctly classifies 73 per cent of the males, 55 per cent of the women and 59 per cent of both genders. No evidence of job polarization*: continuing failure, risk of social fragmentation, erosion of institutions and slower growth (Easterly at al. 2006)*) See Autor, Levy & Murnane 2003, Acemoglu & Autor 2012, Levy & Murnane 2004, Manning 2004
Motivation
34Slide35
35Slide36
36Slide37
Are unskilled wages too high in Hungary?It seems they are not. On the contrary.
37Slide38
Poor state of health?Several proxies of health status. Hungarian are worse off relative to Italians but not to Norwegians.The relative health status of the low educated is not worse in HungaryThe interaction effect of poor health and low education is positive for most cases in Hungary. Following Norton, Wang and Ai (2004):
38Slide39
Informal work?The employment data are self-reported, fall very close to the ILO-OECD figures.ILO-OECD employment comprises a large part of unregistered employment in Hungary: it is higher by 15-20 per cent than registered employment (Benedek, Elek & Köllő 2013)Indirect methods of estimating black work (unobserved even in the LFS) conclude that low educated/unemployed people earn less in the black economy on average than do more educated/employed people (Benedek et al 2012, Molnár & Kapitány 2012)
39Slide40
A Roma problem?The problem is similar in other CEEs with no or small Roma populationThe employment rate of the low-educated non-Roma (60% for prime-age unskilled males) is still much lower than in either Norway (85%) or Italy (80%)One coud probably single out a minority in Italy (perhaps less so in Norway) with a social standing and employment rate similar to those of Hungarian Roma.
40Slide41
41Slide42
Italy: low educated workers are over-represented in small firms in the domain of relatively complex jobs
42Slide43
43Slide44
Let
yij denote the expected productivity yield of j
-educated workers (j=1,2,…,J) when employed in job type
i (i=
1,2,…,I), and the wj
-s their reservation wages, assumed to vary with educational attainment but not with the type of job
.
Assuming that wages are set as a weighted average of reservation wages and the productivity yield of a given match – with 0
1 standing for the relative bargaining power of employers in a country or region – the firm solves:
Suppose that job types can be characterized with a continuous or ordinal measure of complexity (
R
) so that
R
1
< R
2
<…<
RI, and that the productivity yields from employing a j-educated worker in a job of R-level complexity can be approximated with the linear projection yij= jRi.. Equation (1) can be re-written as:When employers decide on hiring an individual their choices are based on wages and expected productivity that they predict on the basis of the applicant’s education and further proxies of his/her skills. These may be observed by the employer but not by the researcher and are therefore summarized in a residual term satisfying E()=0, cov(,w)=0 and cov(, R)=0. For an applicant of j-level education expected profit is:For an applicant for the same job with education J:Subtracting 3b from 3a we have: and the probability that J is chosen for job type i is:
This is a McFadden model with a need to observe/estimate reservation wages, which furthermore have to vary within educational levels (by region or country). Given the quality of the wage data and our wish to estimate country-by-country, a more parsimonious model is to be chosen
binary or multinomial logit/probit
44Slide45
Table x: Job characteristics and the probability of employing a low-educated worker
Average partial effects after logit in ALL (per cent)Dependent variable: the worker employed in the job has primary education attainment
Weighted samples, robust standard errors
Unweighted samples, bootstrap standard errors
Norway
Italy
Hungary
Norway
Italy
Hungary
Small firm
-1.01
5.58
***
-2.54
***
1.39
6.62
***-2.46***(0.67)(4.43)(3.51)
(1.06)
(7.83)
(5.07)
Firm size unknown
..
-3.94
*
0.87
..
-2.49
*
-0.14
(1.88)
(0.81)
(1.82)
(0.17)
Age of the match
0.82
***
0.65
***
0.13
0.80
***
0.60
***
0.11
***
(15.38)
(12.82)
(2.73)
(18.36)
(16.22)
(3.02)
Type 1 literacy tasks
-3.49
***
-5.21
***
-2.71
***
-4.67
***
-5.16
***
-2.12
***
(12.59)
(26.56)
(17.33)
(27.98)
(33.62)
(15.24)
Type 2 literacy tasks
1.15
***
1.28
***
0.45
*
1.46
***
1.29
***
0.30
(2.64)
(3.35)
(1.68)
(4.65)
(4.42)
(1.26)
Part-time job
-1.36
-5.74
***
-2.29
**
0.81
-6.04
***
-1.22
*
(1.03)
(4.84)
(2.47)
(0.78)
(7.19)
(1.68)
Managerial job
-7.92
***
-11.5
***
-14.2
***
-8.41
***
-7.70
***
-11.53
***
(2.87)
(3.77)
(12.76)
(4.12)
(4.12)
(12.90)
Other skilled job
-8.58
***
-9.48
***
-6.54
***
-8.07
***
-9.04
***
-5.37
***
(6.33)
(7.98)
(12.97)
(8.71)
(11.17)
(13.70)
Semi-skilled job
1.09
8.86
***
-0.43
9.70
***
8.93
***
-1.88
*
(0.37)
(3.24)
(0.28)
(4.11)
(4.56)
(1.84)
Observations
3618
3179
2607
3618
3179
2607
Pseudo-R
2
0.1122
0.2200
0.1997
0.1627
0.2327
0.1824
Observed share (per cent)Z-values based on robust and bootstrapped standard errors (with 100 replications) in parentheses. Significant at the *) 0.1 **) 0.05 and ***) 0.01 level. Reference categories: large firm (>20 workers), full-time job (36 or more hours a week), elementary occupations.
45Slide46
Size effects and share effects ( and )Jobs distinguished by the number of Type 1 tasks
46Slide47
Size effects and share effects ( and )Jobs distinguished by the number of Type 1 tasks
47Slide48
Size effects and share effects ( and ) Jobs distinguished by the number of Type 1 tasks
48Slide49
Size effects and share effects ( and ) Jobs distinguished by the number of Type 2 tasks
49Slide50
Size effects and share effects ( and ) Jobs distinguished by the number of Type 2 tasks
50Slide51
Size effects and share effects ( and )Jobs distinguished by the number of Type 2 tasks
51Slide52
Size effects and share effects combined () Jobs distinguished by the number of Type 1 tasks
52Slide53
Size effects and share effects combined () Jobs distinguished by the number of Type 2 tasks
53Slide54
Do Italian small firms tolerate skills mismatch (many literacy tasks low education) more than do their larger counterparts?If yes, we would expect a positive interaction effect of literacy tasks (R) and small size. As R
increases, the L share should drop less in small than in large firms.Warning: the interaction effect of a continuous (x1) and a dummy variable (x2) in logit is not equal to 12 of the interaction term (Ai & Norton 2003). The cross-derivative can be calculated as below. The effects and significance differ from case to case depending on Xi
Re-estimating the equation with an interaction term yields
54Slide55
Simple jobs
55Slide56
Simple jobs
56Slide57
Simple jobs
57Slide58
Test performance
Low-educated
High-educated=1
(per cent, year)
(ratio)
NO
IT
HU
NO
IT
HU
Mean score
Prose
258
204
240
0.87
0.81
0.86
Document
259
201
235
0.86
0.81
0.85
Numeracy
254
210
238
0.87
0.83
0.84
Problem solving
248
199
..
0.85
0.81
..
Fractio
n
of
low-performers
c
Prose
21.4
65.7
35.8
4.86
2.07
3.09
Document
25.4
67.1
41.3
5.18
1.91
3.15
Numeracy
25.1
62.3
36.4
3.51
2.32
4.61
Problem solving
51.3
84.9
64.2
2.97
1.54
1.84
a) Employment rate times the mean number of Type 1 (Type 2) job-related literacy tasks performed by those in employment
b) Mean of the five plausibe values.
Sampling and imputation errors t.b.a.
c) Level 1-2 out of 5
Norway: test scores are much higher in absolute but not in relative terms
58Slide59
The large difference is in rather than . But the abundance of very simple jobs largely contribute to unksilled employment in Italy
HH
II
H
I
59Slide60
by particular tasks
60Slide61
Share of the low-educated by particular tasks
fp7_egyenkent.dta61Slide62
by particular tasksfp7_egyenkent.dta
62Slide63
63Slide64
Type 1 and Type 2 requirements in the pooled sample
64