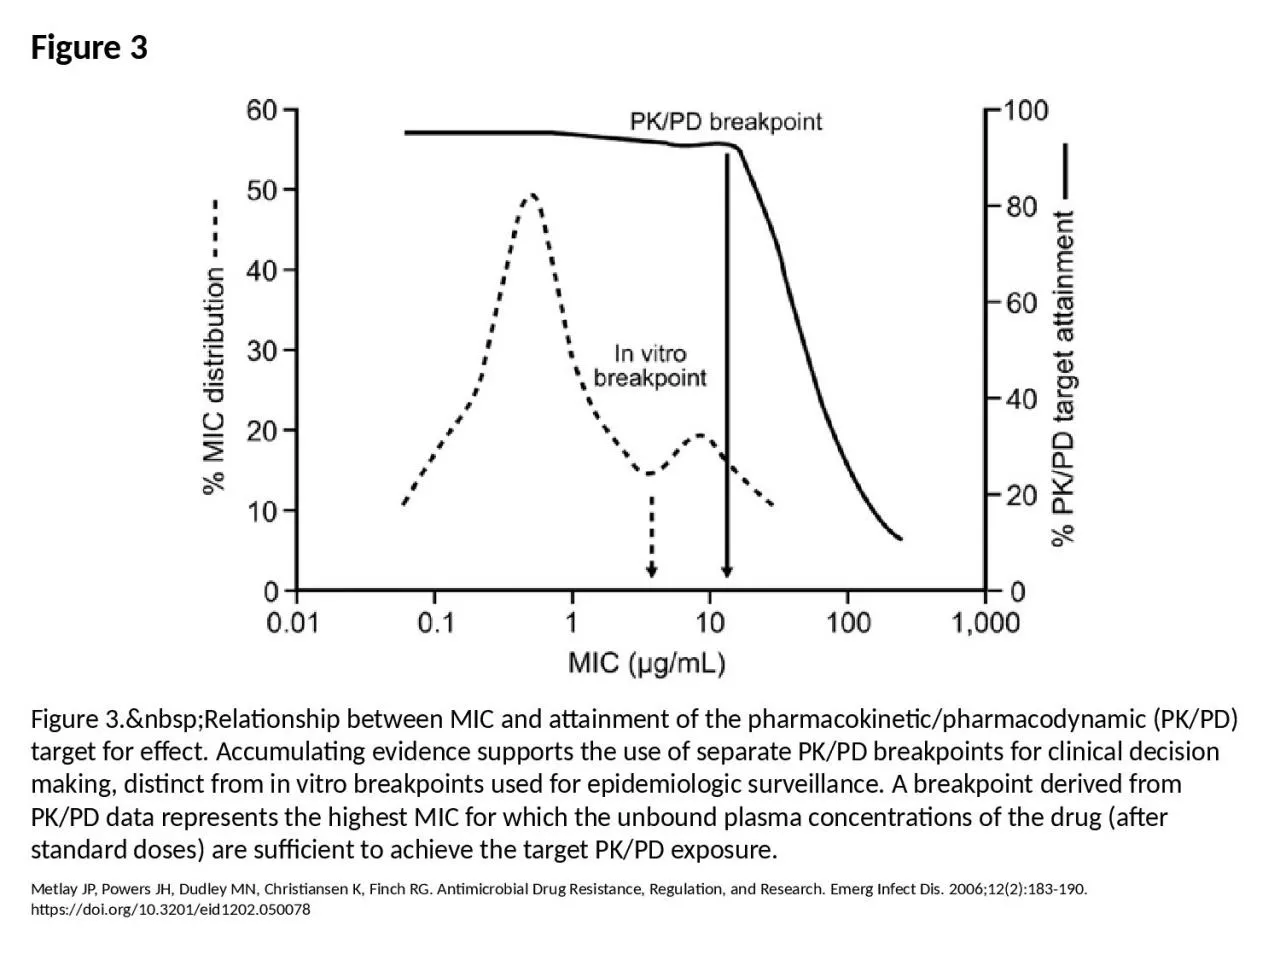
PPT-Figure 3 Figure 3. Relationship between MIC and attainment of the pharmacokinetic/pharmaco
Author : lucy | Published Date : 2024-02-09
Metlay JP Powers JH Dudley MN Christiansen K Finch RG Antimicrobial Drug Resistance Regulation and Research Emerg Infect Dis 2006122183190 httpsdoiorg103201eid1202050078
Presentation Embed Code
Download Presentation
Download Presentation The PPT/PDF document "Figure 3 Figure 3. Relationship..." is the property of its rightful owner. Permission is granted to download and print the materials on this website for personal, non-commercial use only, and to display it on your personal computer provided you do not modify the materials and that you retain all copyright notices contained in the materials. By downloading content from our website, you accept the terms of this agreement.
Figure 3 Figure 3. Relationship between MIC and attainment of the pharmacokinetic/pharmaco: Transcript
Download Rules Of Document
"Figure 3 Figure 3. Relationship between MIC and attainment of the pharmacokinetic/pharmaco"The content belongs to its owner. You may download and print it for personal use, without modification, and keep all copyright notices. By downloading, you agree to these terms.
Related Documents