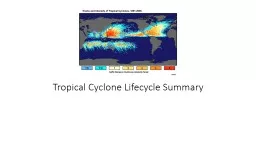
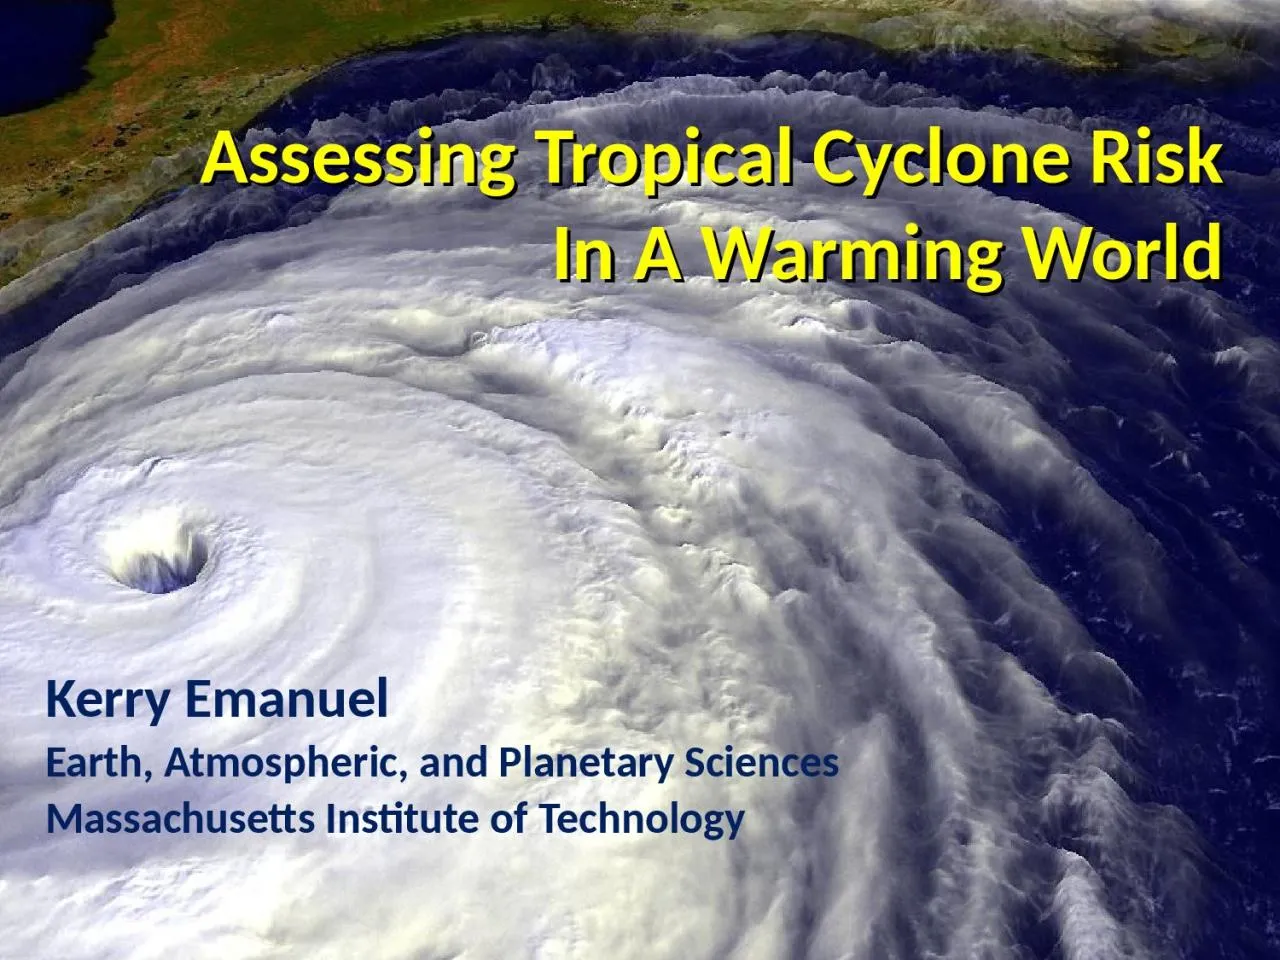
Kerry Emanuel Earth Atmospheric and Planetary Sciences Massachusetts Institute of Technology Atlantic Sea Surface Temperatures and Storm Max Power Dissipation Smoothed with a 13431 filter ID: 913703
Download Presentation The PPT/PDF document "Assessing Tropical Cyclone Risk In A War..." is the property of its rightful owner. Permission is granted to download and print the materials on this web site for personal, non-commercial use only, and to display it on your personal computer provided you do not modify the materials and that you retain all copyright notices contained in the materials. By downloading content from our website, you accept the terms of this agreement.
Slide1
Assessing Tropical Cyclone Risk In A Warming World
Kerry Emanuel
Earth, Atmospheric, and Planetary Sciences
Massachusetts Institute of Technology
Slide2Atlantic Sea Surface Temperatures and Storm Max Power Dissipation
(Smoothed with a 1-3-4-3-1 filter)
Scaled Temperature
Power Dissipation Index (PDI)
Years included: 1870-2006
Data Sources: NOAA/TPC, UKMO/HADSST1
Slide3Effect of Increased Potential Intensity on Hurricane Katrina
Slide4Some
U.S. Hurricane Damage Statistics:
>
50% of all normalized damage caused by
top 8 events
, all category 3, 4 and 5>
90% of all damage caused by storms of category 3 and greaterCategory 3,4 and 5 events are only 13% of total landfalling events; only 30 since 1870
Landfalling storm statistics are grossly inadequate for assessing hurricane risk
Slide5Using Global and Regional Models to Simulate Hurricanes
The Problem:
Global models are far too coarse to simulate high intensity tropical cyclones
Embedding regional models within global models introduces problems stemming from incompatibility of models, and even regional models are usually too coarse
Models to expensive to run many times.
Slide6Histograms of Tropical Cyclone Intensity as Simulated by a Global Model with 50 km grid point spacing. (Courtesy Isaac Held, GFDL)
Category 3
Global Models do not simulate the storms that cause destruction!
Observed
Modeled
Slide7To the extent that they simulate tropical cyclones at all, global models simulate storms that are largely irrelevant to society and to the climate system itself, given that ocean stirring effects are heavily weighted towards the most intense storms
Slide8What are the true resolution requirements for simulating tropical cyclones?
Slide9Numerical convergence in an axisymmetric, nonhydrostatic model (Rotunno and Emanuel, 1987)
Slide10Another Major Problem with Using Global and/or Regional Models to Simulate Tropical Cyclones:
Model TCs are not coupled to the ocean
Slide11Comparing Fixed to Interactive SST:
Model with Fixed Ocean Temperature
Model including Ocean Interaction
Slide12Our Solution:
Drive a simple but very high resolution, coupled ocean-atmosphere TC model using boundary conditions supplied by the global model or reanalysis data
set
Phrase in
Angular Momentum
Coordinates
Slide13Detailed view of Entropy and Angular Momentum
Slide14Risk Assessment Approach:
Step 1
: Seed each ocean basin with a very large number of weak, randomly located cyclones
Step 2
: Cyclones are assumed to move with the large scale atmospheric flow in which they are embedded, plus a correction for beta drift
Step 3
: Run the CHIPS model for each cyclone, and note how many achieve at least tropical storm strength
Step 4:
Using the small fraction of surviving events, determine storm statistics.
Details: Emanuel et al.,
Bull. Amer. Meteor. Soc,
2008
Slide15200 Synthetic U.S. Landfalling tracks (color coded by
Saffir
-Simpson Scale)
Slide16Calibration
Absolute genesis frequency calibrated to North Atlantic during the period 1980-2005
Slide17Genesis rates
Atlantic
Eastern North Pacific
Western North Pacific
North Indian Ocean
Southern Hemisphere
Slide18Seasonal Cycles
Atlantic
Slide19Cumulative Distribution of Storm Lifetime Peak Wind Speed, with Sample of
1755
Synthetic Tracks
95% confidence bounds
Slide20Return Periods
Slide21Sample Storm Wind Swath
Slide22Couple to Storm Surge Model (SLOSH)
Courtesy of
Ning Lin
, Princeton University
Slide23Surge map for single event
Slide24Histogram of the SLOSH-model simulated
storm
surge at the Battery
for 7555
synthetic tracks that pass within 200 km of the Battery site.
Slide25Surge Return Periods, New York City
Slide26Now Use Daily Output from IPCC Models to Derive Wind Statistics, Thermodynamic State Needed by Synthetic Track Technique
Slide271.
Last 20 years of 20
th
century simulations
2.
Years 2180-2200 of IPCC Scenario A1b (CO
2
stabilized at 720 ppm)
Compare two simulations each from 7 IPCC models:
IPCC Emissions Scenarios
This study
Slide29Projected Warming:
This study
Slide30Basin-Wide Percentage Change in Power Dissipation
Different Climate Models
Slide317 Model Consensus Change in Storm Frequency
Slide32Economic Analysis of Impact of Climate Change on Tropical Cyclone Damages
With Robert Mendelsohn
Yale
Slide33Assessing the Impact of Climate Change
Measure how climate change affects future extreme eventsReflect any underlying changes in vulnerability in future periods
Estimate damage functions for each type of extreme event
Estimate future extreme events caused by climate change
Slide34Emissions Trajectory
Climate Scenario
Event Risks
Vulnerability Projection
Damage Function
Damage Estimate
Integrated Assessment Model
Slide35Climate Models
CNRM (France)ECHAM (Germany)GFDL (U.S.)
MIROC (Japan; tropical cyclones only)
Slide36Baseline Changes in Tropical Cyclone Damage (due to population and income, holding
climate
f
ixed)
Current Global Damages: $13.9 billion/yr
Future Global Damages: 30.6 billion/yr
Current Global Deaths: 18,918/yrFuture Global Deaths: 7,168/yr
Slide37Examples of Modeling Output
Current and Future Probability Density of U.S. Damages, MIROC Model
Current and Future
Damage Probability,
MIROC Model
Slide38Slide39Slide40Slide41Slide42Slide43Slide44Slide45Change in Landslide Risk
Slide46Limitations
All steps of the integrated assessment are uncertain: emission path, climate response, tropical cyclone response, and damage function
Sea level rise not yet taken into account
Relationship between storm intensity and fatalities is uncertain
Country level analysis is desirable (likely gains in accuracy from finer resolution analysis)
Slide47Summary:
History to short and inaccurate to deduce real risk from tropical cyclones
Global (and most regional) models are far too coarse to simulate reasonably intense tropical cyclones
Globally and regionally simulated tropical cyclones are not coupled to the ocean
Slide48We have developed a technique for downscaling global models or reanalysis data sets, using a very high resolution, coupled TC model phrased in angular momentum coordinates
Model shows high skill in capturing spatial and seasonal variability of TCs, has an excellent intensity spectrum, and captures well known climate phenomena such as ENSO and the effects of warming over the past few decades
Slide49Application to global models under warming scenarios shows great regional and model-to-model variability. As with many other climate variables, global models are not yet capable of simulating regional variability of TC metrics
Predicted climate impacts from all extreme events (including tropical storms) range from $17 to $25 billion/yr global damages by 2100
Equivalent to 0.003 to 0.004 percent of GWP by 2100
Climate change also predicted to increase fatalities by 2200 to 2500 deaths/yr