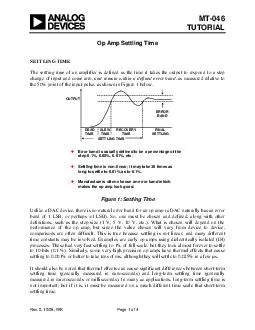
/
Controls on particle settling velocity and bed Controls on particle settling velocity and bed

Controls on particle settling velocity and bed - PowerPoint Presentation

myesha-ticknor
myesha-ticknor . @myesha-ticknor
Follow
386 views
Uploaded On 2017-09-19

Controls on particle settling velocity and bed - PPT Presentation

erodibility in the presence of muddy flocs and pellets as inferred by ADVs York River estuary Virginia USA Kelsey Fall Carl Friedrichs and Grace Cartwright Virginia Institute of Marine Science ID: 589125

settling regime wsbulk velocity regime settling velocity wsbulk tidal flocs phase increasing bed stress pellets cwash regimes iui peak

Share:

Link:

Embed:

Download Presentation from below link

Download Presentation The PPT/PDF document "Controls on particle settling velocity a..." is the property of its rightful owner. Permission is granted to download and print the materials on this web site for personal, non-commercial use only, and to display it on your personal computer provided you do not modify the materials and that you retain all copyright notices contained in the materials. By downloading content from our website, you accept the terms of this agreement.


Presentation Transcript

Slide1

Controls on particle settling velocity and bed erodibility in the presence of muddy flocs and pellets as inferred by ADVs, York River estuary, Virginia, USA

Kelsey Fall*, Carl Friedrichs, and Grace CartwrightVirginia Institute of Marine Science Slide2

Motivation: Determine fundamental controls on sediment settling velocity and bed erodibility in muddy estuaries

Physical

-biological

g

radient

found along the York estuary

:

-- In the middle to upper York River estuary, disturbance by sediment transport reduces macrobenthic activity, and sediment layering is often preserved. (e.g., Clay Bank – “Intermediate Site”)-- In the lower York and neighboring Chesapeake Bay, layering is often destroyed by bioturbation. (e.g., Gloucester Point – “Biological Site”)-- NSF MUDBED project ADV tripods provide long-term observations within a strong physical-biological gradient.

Study site: York River Estuary, VA

(X-rays

courtesy ofL. Schaffner)

Schaffner et al., 2001

1/11Slide3

ADV at deployment

-- ADVs often provide quality long-term data sets despite extensive

biofouling

.

-

-

ADVs provide continual long-term estimates of:

Suspended mass concentration (c) from acoustic backscatter

Bed

Stress (τ

b): ρ

*<u’w’>

Bulk Settling

Velocity (

w

sBULK

): <w’c’>/csetErodibility (ε) given by ε = τb/M, where M is depth-integrated C

ADVafter retrieval

Observations provided by an Acoustic Doppler VelocimeterSensing volume ~ 35 cmab

(Photos by C. Cartwright)

Fugate and Friedrichs ,2002; Friedrichs et al., 2009; Cartwright, et al. 2009 and Dickhudt et al., 2010

2

/11Slide4

Biological

site

Generally < 1

kg

/m

2

/Pa

Intermediate site

ε

varies from

~ 3 kg/m

2

/

Pa (Regime 1) to

~ 1 kg/m

2

/

Pa (Regime 2)

1

2

3

4

5

6

ε (kg/m

2

/Pa)

Seasonal Variability in bulk settling

velocity (

W

sBULK

)

and bed

erodibility

(ε) is observed

at the Intermediate Site.

3-day mean of

ε

from fits

to M = ε

τ

b

using ADVs

Biological

site

W

sBULK

~

1 mm/

s

Intermediate

site

W

sBULK

varies from ~ 0.5 mm/s (Regime 1) to ~ 1 mm/s (Regime 2)

3- day Mean

WsBULK from fits to <w’c'> = WsBULK<C> using ADVs

2

1.5

1.0

0.5

0

WsBULK (mm/s)

Cartwright et al., 2009

3/11Slide5

Biological

site

Generally < 1

kg

/m

2

/Pa

Intermediate site

ε

varies from

~ 3 kg/m

2

/

Pa (Regime 1) to

~ 1 kg/m

2

/

Pa (Regime 2)

1

2

3

4

5

6

ε (kg/m

2

/Pa)

3-day mean of

ε

from fits

to M = ε

τ

b

using ADVs

Biological

site

W

sBULK

~

1 mm/

s

Intermediate

site

W

sBULK

varies

from ~ 0.5 mm/

s (Regime 1) to

~ 1 mm/s

(Regime 2)

3- day Mean

W

sBULK

from fits to <

w’c'> = WsBULK<C> using ADVs

21.5

1.0

0.5

0

W

sBULK

(mm/s)Cartwright et al., 2009

What is happening at Intermediate Site

when

Regime 1

Regime 2?

3/11Slide6

W

sBULK = <w’c’>/<c> (mm/s)(a) Sediment Bulk Settling Velocity, W

sBULKPhase-Averaged Settling Velocity for Two Regimes Regime 1

Regime 2

Increasing |u| and τ

b

Tidal Velocity Phase (q/p)0.1 0.2 0.3 0.4 0.5Similar WsBULK at the beginning of tidal phase suggest presence of flocs during

both regimesRegime 1:

Flocs-Lower observed W

sBULK at peak |u| and τb (<0.8 mm/s)

Regime 2: Pellets+Flocs

-Higher

observed

W

sBULK

at peak |u| and τ

b (~1.2 mm/s)-Influence of pellets on WsBULK7/11

(Note that Bulk Settling Velocity, wsBULK

= <w’c’>/cset is considered reliable for mud only during accelerating half of tidal cycle.)Slide7

Tidal Analysis highlights differences

in Regime 1 and Regime 2.Tidal Velocity Phase(θ/π)

Increasing IuI

Decreasing IuI

(b) Bed Stress (Pa)

(d) Concentration (mg/L)

0

0.5150100150200

0.050.1

0.150.2

0.25

(c) Drag Coefficient

0

0.5

1

0.00004

0.00008

0.0012

0.0016

CWASHCWASH(a) Tidal Current Speed (cm/s)

153045

Tidal Velocity Phase(θ/π)Increasing IuIDecreasing IuI5/11Slide8

(a) Tidal Current Speed (cm/s)

153045

Tidal Analysis highlights differences

in Regime 1 and Regime 2.

Tidal Velocity Phase

(θ/π)

Increasing IuI

Decreasing IuI(b) Bed Stress (Pa)(d) Concentration (mg/L)00.5

1

50

100150

200

0.05

0.1

0.15

0.2

0.25

(c) Drag Coefficient

0

0.510.000040.000080.00120.0016CWASHC

WASH

Regime 1: Flocs -High C at relatively low τb -Lower ADV derived Cd (more stratified water column)-Lower τb despite higher similar current speeds

Regime 1Regime 1

Regime 1

Regime 1

Tidal Velocity Phase

(θ/π)

Increasing IuI

Decreasing IuI

5/11Slide9

(a) Tidal Current Speed (cm/s)

153045

Tidal Analysis highlights differences

in Regime 1 and Regime 2.

Tidal Velocity Phase

(θ/π)

Increasing IuI

Decreasing IuI(b) Bed Stress (Pa)(d) Concentration (mg/L)00.5

1

50

100150

200

0.05

0.1

0.15

0.2

0.25

(c) Drag Coefficient

0

0.510.000040.000080.00120.0016CWASHC

WASH

Regime 1: Flocs -High C at relatively low τb -Lower ADV derived Cd (more stratified water column)-Lower τb despite higher similar current speeds

Regime 2: Pellets+Flocs-Lower C at

high

τ

b

-Increase in C

d

(Water column less stratified)

Regime 2

Regime 2

Regime 2

Regime 2

Tidal Velocity Phase

(θ/π)

Increasing IuI

Decreasing IuI

5/11Slide10

Concentration (mg/L)

(a)(b)

Hysteresis plots of C vs.

t

b

for the top 20 % of tidal cycles with the strongest

t

b for (a) Regime 1 and (b) Regime 2 . τcDEP flocs = ~ 0.08 PaWashload (~20%)Flocs (~80%)

Washload (~20%)

Flocs (~50%)

Pellets (~30%)

Bed Stress (Pa)

Bed Stress (Pa)

Concentration (mg/L)

τ

cDEP

flocs = ~ 0.08 Pa

τ

cINT

= ~ 0.05 PaτcINT

= ~ 0.02 PaRegime 1 Regime

2 -- Once tb increases past a critical stress for initiation (tcINIT), C continually increases for both Regime 1 and for Regime 2Erosion

-- As t

b

decreases

for

Regime 1

, C does not fall off quickly until

t

b

≤ 0.08 Pa, suggests that over individual tidal cycles, cohesion of settling

flocs to the surface of the seabed is inhibited for τb

larger than ~ 0.08 Pa. -- As tb decreases for

Regime 2, C decreases more continually, suggesting pellets without as clear a t

cDEP. But the decline in C accelerates for tb ≤ ~

0.08 Pa, suggesting (i) a transition to floc deposition and (ii) that settling C component is ~ 3/8 pellets, ~ 5/8 flocs.

Deposition

6

/11Slide11

W

sBULK = <w’c’>/<c> (mm/s)(a) Sediment Bulk Settling Velocity, W

sBULKPhase-Averaged Settling Velocity for Two Regimes Regime 1

Regime 2

Increasing |u| and τ

b

Tidal Velocity Phase (q/p)0.1 0.2 0.3 0.4 0.5Similar WsBULK at the beginning of tidal phase suggest presence of flocs during

both regimesRegime 1:

Flocs-Lower observed W

sBULK at peak |u| and τb (<0.8 mm/s)

Regime 2: Pellets+Flocs

-Lower

observed

W

sBULK

at peak |u| and τ

b (~1.2 mm/s)-Influence of pellets on WsBULK7/11

(Note that Bulk Settling Velocity, wsBULK

= <w’c’>/cset is considered reliable for mud only during accelerating half of tidal cycle.)Slide12

W

sBULK = <w’c’>/<c> (mm/s)

WsDEP = (c/(c-cwash))*WsBULK

(mm/s)Analysis of WsBULK by removing CWASH and solving for settling velocity of the depositing component (

W

sDEP

) during increasing

tb allows separate estimates for settling velocities of flocs (WsFLOCS) and pellets (WsPELLETS).(a) Sediment Bulk Settling Velocity, WsBULK(b)Phase-Averaged Settling Velocity for Two Regimes Remove cwashRegime 1 Regime

2 Tidal

Velocity Phase (q/p

)

0.1 0.2 0.3 0.4 0.5

Regime 1

Regime

2

0.1 0.2 0.3 0.4 0.5

(b) Depositing component of Settling Velocity,

W

sDEPIncreasing |u| and τb Increasing |u| and τb 8/11Recall: peak τb

~ 0.15 Pa for Regime 1, and peak τb ~ 0.22 Pa for Regime

2 Slide13

W

sBULK = <w’c’>/<c> (mm/s)

WsDEP = (c/(c-cwash))*WsBULK

(mm/s)Analysis of WsBULK by removing CWASH and solving for settling velocity of the depositing component (

W

sDEP

) during increasing

tb allows separate estimates for settling velocities of flocs (WsFLOCS) and pellets (WsPELLETS).(a) Sediment Bulk Settling Velocity, WsBULK(b)Phase-Averaged Settling Velocity for Two Regimes Remove cwashRegime 1 Regime

2 Tidal

Velocity Phase (q/p

)

0.1 0.2 0.3 0.4 0.5

Regime 1

Regime

2

0.1 0.2 0.3 0.4 0.5

(b) Depositing component of Settling Velocity,

W

sDEPIncreasing |u| and τb Increasing |u| and τb W

sFLOC = ~ 0.85 mm/sImplies floc size is limited by settling-induced shear rather than tb .

WsDEP = WsFLOCS8/11Recall: peak τb ~ 0.15 Pa for Regime 1, and peak τb ~ 0.22 Pa for Regime 2

Slide14

W

sBULK = <w’c’>/<c> (mm/s)

WsDEP = (c/(c-cwash))*WsBULK

(mm/s)Analysis of WsBULK by removing CWASH and solving for settling velocity of the depositing component (

W

sDEP

) during increasing

tb allows separate estimates for settling velocities of flocs (WsFLOCS) and pellets (WsPELLETS).(a) Sediment Bulk Settling Velocity, WsBULK(b)Phase-Averaged Settling Velocity for Two Regimes Remove cwashRegime 1 Regime

2 Tidal

Velocity Phase (q/p

)

0.1 0.2 0.3 0.4 0.5

Regime 1

Regime

2

0.1 0.2 0.3 0.4 0.5

(b) Depositing component of Settling Velocity,

W

sDEPIncreasing |u| and τb Increasing |u| and τb WsDEP = WsFLOCS

WsDEP = f

FWsFLOCS + fFWsPELLETS= ~ 1.5 mm/s at peak tb Assume: fF = 5/8, fP = 3/8 This gives:

WsPELLETS = ~ 2 mm/s

8

/11

W

sFLOC

= ~ 0.85 mm/s

Implies floc size is limited by settling-induced shear rather than

t

b

.

Recall: peak

τ

b

~ 0.15 Pa for

Regime 1

, and peak τ

b ~ 0.22 Pa for Regime

2 Slide15

25

or 120 Hour Averaged Bed Stress (Pa)25 Hour Averaged Erodibility, (kg/m2/Pa) Daily-averaged erodibility is correlated either to 5-Day-averaged

tb (Regime 1) or to daily-averaged tb (

Regime 2), revealing two distinct relationships between ε and tb.

Regime 1

:

Erodibility (

ε) increases proportional to the average stress over the last 5 days, consistent with cohesive bed evolution dominated by the consolidation state of flocs.Regime 2: Erodibility (ε) decreases with greater stress, possibly associated with the effects of bed armoring by the pellet component. Influence of Stress History on Bed Erodibility for Two Regimes

Regime 1 Regime

2 9/11Slide16

Summary

and Future Work:

York River sediment settling velocity (

W

s

) and erodibility (

ε

) are described by two contrasting regimes: (i) Regime 1: a period dominated by muddy flocs [lower Ws, higher ε].(ii) Regime 2: a period characterized by pellets mixed with flocs [higher Ws, lower ε]. Tidal phase-averaging of ADV records for the strongest 20% of tides for June to August 2007 reveals:A non-settling wash load (CWASH) is always present during both

Regimes.Once stress (τb

) exceeds an initial critical value (τcINIT) of ~ 0.02 to 0.05 Pa, sediment concentration (C) continually

increases with τb for both Regimes.As

τb decreases, cohesion of settling flocs to the surface of the seabed is inhibited for τ

b

larger than ~ 0.08

Pa for

both

Regimes

. Subtraction of CWASH from WSBULK for Regime 1 results in a stable floc settling velocity of WsFLOC ≈ 0.85 mm/s. The constant floc settling velocity implies that floc size is limited by settling-induced shear rather than turbulence associated with bed stress.Separation of WsFLOC and CWASH from WSBULK

for Regime 2 finally yields WSPELLET ≈

2 mm/s.During Regime 1, ε increases with tb averaged over the previous 5 days, consistent with cohesive bed evolution; while for Regime 2, ε decreases with daily tb, perhaps consistent with bed armoring.Future work will include (i) vertically stacked ADVs and (ii) deployment of a high-definition particle settling video camera.

10/11Slide17

Acknowledgements

Marjy

FriedrichsTim GassWayne Reisner Funding:

Julia

Moriarity

Carissa Wilkerson

Questions?11/11