/
F test for Lack of Fit F test for Lack of Fit

F test for Lack of Fit - PowerPoint Presentation

natalia-silvester
natalia-silvester . @natalia-silvester
Follow
343 views
Uploaded On 2019-12-02

F test for Lack of Fit - PPT Presentation

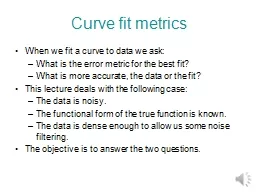
F test for Lack of Fit Full model   Review use the General L inear Test GLT approach to test the slope   Reduced model   Ho versus Ha       ID: 768873

fit error regression lack error fit lack regression impact ssmsfconclusion variation model linear source test significantlinear current reject 5141

Share:

Link:

Embed:

Download Presentation from below link

Download Presentation The PPT/PDF document "F test for Lack of Fit" is the property of its rightful owner. Permission is granted to download and print the materials on this web site for personal, non-commercial use only, and to display it on your personal computer provided you do not modify the materials and that you retain all copyright notices contained in the materials. By downloading content from our website, you accept the terms of this agreement.


Presentation Transcript

F test for Lack of Fit

Full model:   Review: use the General Linear Test (GLT) approach to test the slope   Reduced model:   Ho: versus Ha:       The test statistic of the general linear test in simple linear regression is identical to the ANOVA test statistic. Under Ha Under Ho “Significant reduction in SSE?”

The F test for Lack of Fit

The Bank example 11

Notation Minimum depositNumber of new accounts75287542100112 100136 125160125150 150152175156175124200124200104In the case where   Most of the X levels has two replicates except X=150, there is only one Y=152. for the first measurement at the first X level (75). for the second measurement at the first X level (75 ). 

Notation The number of X levels is  

Source of Variation SSMSFConclusion Regression MSR= MSR / MSE~F(1, n-2)Reject Ho means X has significantLinear impact on YErrorMSE= Total Source of Variation SSMSFConclusion Regression MSR / MSE~F(1, n-2)Reject Ho means X has significantLinear impact on YErrorTotal The F test of ANOVA for Ho: versus Ha:  Do not reject Ho, X has nolinear impact on YThere is no evidence to reject   The bank exampleQ: Does X has significant linear impact on Y?

There is no evidence to reject Ho:  X=130So the linear line is rather flat,but, there appears to be more Issues with the fitting.          ooooo oo oooooLow impact, Poor fitLow impact, Can still be a good fit

The lack of fit test ,   Q: Does the current (linear) model fit (is lack of fit) the data? Full model:     Reduced model:     =   Under Ha Under Ho  

        “Total sum of squares” “ error sum of squares” “regression sum of squares” Partition the variances

    Partition the residual errors for lack of fit

Partition the residual errors for lack of fit “lack of fit”   “no lack of fit” “lack of fit” Use to estimate “lack of fit”    SSE = SSPE + SSLF = +  When there is only simple measurement in each X level, SSPE = 0

ANOVA table Source of Variation SSMSFConclusion Regression MSR= MSR /MSE ~F(1, n-2)Reject Ho means X has significantLinear impact on YError MSE= Lack of fit(in Error) MSLF= MSLF /MSPE ~F(c-2, n-c) Reject Ho means the current model does not fits the dataPure error (in Error)MSPE= Total Source of Variation SSMSFConclusion Regression MSR /MSE ~F(1, n-2)Reject Ho means X has significantLinear impact on YError Lack of fit(in Error ) MSLF /MSPE ~F(c-2, n-c) Reject Ho means the current model does not fits the data Pur e error ( in Error) Total

The bank example (n=11, c=6) Source of Variation SSMSFConclusion Regression 5141 X (has/ doesn’t has) a significant linear impact on YError11-2=1638 Lack of fit(in Error) 6-2=3398.5The current linear model (fit /doesn’t fit) the dataPure error(in Error)11-6=5229.6Total1988310Source of Variation SSMSFConclusion Regression 5141 X (has/ doesn’t has) a significantlinear impact on YError 1638Lack of fit(in Error)3398.5The current linear model (fit /doesn’t fit) the dataPure error(in Error)11-6=5229.6Total1988310

The bank example (n=11, c=6) Source of Variation SSMSFConclusion Regression 5141 5141/1638 = 3.14 (p=0.11)X does not has significantlinear impact on YError11-2= 1638Lack of fit(in Error) 6-2=3398.53398.5/229.6=14.8(p=0.0056)The current linear model does not fit the dataPure error(in Error)11-6=5229.6Total1988310Source of Variation SSMSFConclusion Regression 5141 5141/1638 = 3.14(p=0.11)X does not has significantlinear impact on YError1638Lack of fit(in Error)3398.53398.5/229.6=14.8(p=0.0056)The current linear model does not fit the dataPure error(in Error)11-6=5229.6Total1988310

The bank example (n=11, c=6) Source of Variation SSMSFConclusion Regression 5141 3.14(p=0.11) X does not has significantlinear impact on YError11-2=1638 Lack of fit(in Error) 6-2=3398.514.8(p=0.0056)The current linear model does not fit the dataPure error(in Error)11-6=5229.6Total1988310Source of Variation SSMSFConclusion Regression 51413.14 (p=0.11)X does not has significantlinear impact on YError1638Lack of fit(in Error)3398.514.8(p=0.0056)The current linear model does not fit the dataPure error(in Error)11-6=5229.6Total1988310 Build the reduced model under Ho:  Build the full model under Ha:  MSLF/MSPE=  

Practice problem 1: fill in the missing (??) in the ANOVA table from a SLR Source of Variation SSMSFConclusion Regression 12.597 ???????? Error?????? Lack of fit(in Error)?? 3??????Pure error(in Error)0.157???? Total15.52214Source of Variation SSMSFConclusion Regression 12.597 ????????Error??????Lack of fit(in Error)?? 3??????Pure error(in Error) 0.157????Total 15.52214

Practice problem 2: complete the ANOVA table according to the R output Source of Variation SSMSFConclusion Regression ErrorLac k of fit(in Error) Pure error(in Error)Total Source of Variation SSMSFConclusion Regression ErrorLack of fit(in Error)Pure error(in Error)Total

Lack of fit test is not valid when no replication Solution: grouping SSPE =  

Practice problem 1 Solution: fill in the missing (??) in the ANOVA table from a SLRLack of fitSignificant impact

Practice problem 2 solution: complete the ANOVA table according to the R output Source of Variation SSMSFConclusion Regression 238.0561238.05670.21 Significant linear impact Error77.983233.391Lack of fit(in Error)22.74937.5832.75No lack of fit Pur e error(in Error)55.234202.762Total316.03924Source of Variation SSMSFConclusion Regression 238.0561238.05670.21Significant linear impact Error77.983233.391Lack of fit(in Error)22.74937.5832.75 No lack of fit Pure error(in Error) 55.234202.762Total316.03924