/
Assessing the Risk of Bias Assessing the Risk of Bias

Assessing the Risk of Bias - PowerPoint Presentation

nersonvisa
nersonvisa . @nersonvisa
Follow
344 views
Uploaded On 2020-06-16

Assessing the Risk of Bias - PPT Presentation

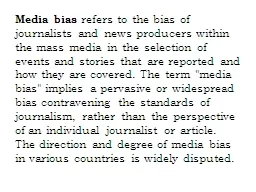
Critical appraisal of medical literature 2010 9 고려대학교 의과대학 안 형 식 What is bias Systematic error or deviation from the truth may overestimate or underestimate biased studies lead to misleading results ID: 779526

outcome bias data selection bias outcome selection data study studies outcomes control comparability effect adequate controls case risk follow

Share:

Link:

Embed:

Download Presentation from below link

Download The PPT/PDF document "Assessing the Risk of Bias" is the property of its rightful owner. Permission is granted to download and print the materials on this web site for personal, non-commercial use only, and to display it on your personal computer provided you do not modify the materials and that you retain all copyright notices contained in the materials. By downloading content from our website, you accept the terms of this agreement.


Presentation Transcript

Slide1

Assessing the Risk of Bias Critical appraisal of medical literature

2010. 9

고려대학교 의과대학

안 형 식

Slide2

What is bias?

Systematic error or deviation from the truth

may overestimate or underestimate

biased studies lead to misleading results

can’t measure the presence of bias, only the risk

rigorous methods

minimise

the risk of bias

question: “should I believe the results?”

Slide3

Biases in randomised controlled trialsBias - A process that tends to produce results that depart systematically from the true values existing in the study population

Selection bias

Avoid with randomisation and concealment

Performance bias

Avoid with standardisation of care and blinding

Attrition bias

Avoid using all subjects intention to treat analysis

Measurement bias

Avoid with blinding of outcome assessors and patients

Slide4

Study sample

Control

Intervention

Experimental

Intervention

Allocation of subjects

Outcome

s

Follow up

Selection bias

Randomisation

Concealment

Performance bias

Standardisation of care protocol

Blinding of care providers and patients

Measurement bias

Blinding of outcome assessors and patients

Follow up

Attrition

bias

Drop-outs?

Cross-over?

Is everyone accounted for?

Outcome

s

Slide5

Should we use quality scales? > 30 availablereliability and validity of many scales not established

different scales lead to conflicting conclusions

may include criteria not related to bias

no evidence for numerical weighting of different elements

how do readers interpret the score?

not recommended

for Cochrane reviews

Slide6

The Cochrane approachdescribe the following for each study in detail:

random sequence generation

allocation concealment

blinding

incomplete outcome data

selective outcome reporting

any other risks

empirical research shows that these components can have a significant effect on results, often leading to exaggerated effects

Slide7

For each study, in each domainis there enough information to understand what happened?if not, rate unclear

what is your judgement: are you satisfied that the study is at a low risk of bias?

yes

indicates a low risk

no

indicates a high risk

based on the context of your review, empirical evidence of bias effect, likely direction and magnitude of effect

Slide8

Random sequence generation

occurs at the start of a trial before allocation of

participants

determines the order of allocation into intervention and control groups

avoids systematic differences between groups

accounts for known and unknown confounders

minimises

selection bias

Slide9

Results of 32 comparative studies of anti-coagulant therapy for MI patients (Chalmers et al, 1977)

Study design

Apparent

risk reduction

Historical controls

(18 studies, 9000 subjects)

62%

±

4

Concurrent non

-

random

Controls (8 studies, 3000

subjects)

34%

±

7

Randomised

(6 studies, 4000 subjects)

22%

±

8

Slide10

Identifying a random sequenceAdequate

random number table

computer random number generator

coin toss

shuffling cards or envelopes

throwing dice

drawing lots

Not adequate

date of birth

day of visit

ID or record number

alternate allocation

choice of the clinician or participant

test results

intervention availability

Slide11

Allocation concealmentoccurs at the start of the trial during allocation of participantswhen a person is recruited to the study, no-one knows which group they will be allocated to

protects the random sequence: prevents

changing the order of recruitment, or deciding not to recruit

strongest empirical evidence showing this

is important to results

minimises

selection bias

Slide12

Selection bias in trial with fore-knowledge of treatment allocation: Amniotomy or oxytocin for induction of labour (Bakose & Backstrom re-analysed by M Keirse)

*

indicates an unfavourable cervix: Keirse hypothesised that such patients would be less likely to be entered in the trial if it were known that they would be allocated amniotomy.

This trial was described as the first “prospective randomised study “between amniotomy and oxytocin for induction of labour in a “totally unselected population” !!!

Bishop score at

entry to trial

Allocated oxytocin

(even date of

birth)

Allocated

amniotomy (odd

date of birth)

3 or less*

28

7

4 or 5

56

58

6 or more

29

45

Total

110

113

X

2

P value

16.1

<0.00025

Slide13

Identifying allocation concealment

Adequate

central allocation (phone, web, pharmacy)

sequentially numbered, identical drug containers

serially numbered, sealed, opaque envelopes

Not adequate

random sequence known to staff in advance

envelopes without all three safeguards

non-random, predictable sequence

Slide14

Blindingoccurs during the intervention and

measurement of outcomes

minimises

performance bias

different treatment of the two groups

participant expectations

minimises

detection

bias

different measurement of outcomes between the two groups

subjective outcomes particularly vulnerable

can blind the participant, care provider, outcome assessor, other personnel – more than “double blinding”

check for intention and success of blinding

Schulz KF & Grimes DA 2002 Lancet

Slide15

위약 효과 - 관절염 통증 완화

Slide16

Identifying blinding

Adequate

participants and key study personnel blinded

blinding probably not broken

outcomes not likely to be influenced

Not adequate

any of the above not met

Slide17

Allocation concealment vs blinding

Time

Randomisation

Concealment

of allocation

Blinding

Selection bias

Performance bias

Slide18

Incomplete outcome datawhen complete outcome data is not available for all participants

can indicate

attrition

bias

can have important impact when:

enough data is missing to affect the results: no. of participants missing (dichotomous) or effect size (continuous)

the no. of people missing is not balanced between groups

the reason for absence is related to the study outcomes (e.g. moved away vs adverse event)

two causes

loss of participants to follow up

exclusion of participants by trialists

Slide19

추적 탈락 (Losses-to-follow-up)어느 정도가 적당한가?

5 : 20

의 법칙

*

5%

이하는 바이어스가 적을 것임

*

20%

이상은 타당도에 심각한 영향을 줌

→ 그러나 과도한 단순화→ 비교되는 추적관찰 손실 비율(Losses-to-follow-up)과 결과발생율

(outcome event rate)에 의존함 * 추적관찰의 손실율이 결과발생율을 초과하지는 않아야 함

Slide20

Intention-to-Treat 원칙 무작위화의 유지원칙 :

대상이 무작위 할당 된후에는 애초에 배정된 군에 따라 분석할 것

,

실험중단

,

치료를 받지 않거나

, crossover

의 경우에도 무작위 할당 분석은 유지되어야 한다

.

예외 : 환자가 무작위 할당 전에 작성된 기준에 따라 맹검 재평가에서 부적당하다고 판명된 경우

Slide21

Identifying incomplete outcome data

Adequate

no missing data

reasons for missing data not related to outcome

missing data balanced across groups with similar reasons

number of participants missing or plausible effect size not enough to change observed effect

Not adequate

any of the above criteria not met

‘as-treated’ analysis with substantial departure from allocated intervention

missing data imputed using inappropriate methods

Slide22

Selective outcome reporting

when outcomes are not reported as planned

outcomes missing

new outcomes added (can be justified, e.g. adverse events)

unexpected statistics, subscales or subgroups

reporting that cannot be used in a review

can indicate ‘

within-study publication bias

’ or ‘data mining’

difficult to determine

compare methods to results

refer to study protocol or trial register

look for commonly used outcomes

Slide23

Identifying selective outcome reporting

Adequate

protocol is available and all pre-specified outcomes reported in the pre-specified way

protocol not available but all expected outcomes are reported

most studies will be judged ‘unclear’ in this category

Not adequate

outcomes not reported as planned or expected

limited information provided for some outcomes (e.g. only direction of effect and significance)

Slide24

Other potential problems

Adequate

study appears to be free of other sources of risk

Not adequate

issues specific to the study design

carryover in crossover trials

comparability of groups in cluster-randomized trials

trial stopped early using data-dependent process (including a formal stopping rule)

extreme baseline imbalance

possible fraud

other problem

Slide25

Relative risk reduction (RRR)Absolute risk reduction (ARR)NNT (number needed to treat)

NNT

의 의미에는 추적관찰기간이 내포되어 있다

.

NNT

hypothetical

=

NNT

observed

X (observed time/hypothetical time)

치료효과는

어느정도인가?

Slide26

Interferon for multiple

sclerosis

Slide27

Risk of bias assessment in Cochrane reviews

Slide28

Risk of bias summary

Here ‘Blinding’ and ‘Incomplete outcomes data’ have been assessed for two sets of outcomes

Slide29

Risk of bias graph

Slide30

The Newcastle-Ottawa Scale (NOS) for Assessing the Quality of Nonrandomized Studies in Meta-Analysis

Slide31

DevelopmentApplications

Current Developments

Slide32

Development: Item SelectionNewcastle quality assessment formOttawa comprehensive listPanel reviewCritical review by experts

Slide33

Development: Grouping ItemsCohort studiesSelection of cohortsComparability of cohorts

Assessment of outcome

Case-Control studies

Selection of case and controls

Comparability of cases and controls

Ascertainment of exposure

Slide34

Development: Identifying ItemsIdentify ‘high’ quality choices with a ‘star’A maximum of one ‘star’ for each h item within the ‘Selection’ and ‘Exposure/Outcome’ categories; maximum of two ‘stars’ for ‘Comparability’

Slide35

Slide36

Newcastle-Ottawa Quality Assessment Scale: Cohort StudiesSelection (4)

Comparability (1)

Outcome (3)

A study can be awarded a maximum of one star for each numbered item within the Selection and outcome categories. A maximum of two stars can be given for Comparability

Slide37

Selection1. Representativeness of the exposed cohort

a) truly representative of the average ___________ (describe) in the community

b) somewhat representative of the average ___________ in the community

c) selected group of users eg nurses, volunteers

d) no description of the derivation of the cohort

2.

Selection of the non exposed cohort

a) drawn from the same community as the exposed cohort

b) drawn from a different source

c) no description of the derivation of the non exposed cohort3. Ascertainment of exposure to implants

a) secure record (eg surgical records)  b) structured interview  c) written self report

d) no description4. Demonstration that outcome of interest was not present at start of study a) yes

 b) no

In the case of mortality studies, outcome of interest is still the presence of a disease/ incident, rather than death; that is a statement of no history of disease or incident earns a star

Slide38

Comparability1. Comparability of cohorts on the basis of the design or analysis

a) study controls for ___________ (select the most important factor)

b) study controls for any additional factor (This criteria could be modified to indicate specific control for a second important factor.)

Slide39

Outcome1. Assessment of outcome

a) independent blind assessment

b) record linkage

c) self report

d) no description

2.

Was follow up long enough for outcomes to occur

a) yes (select an adequate follow up period for outcome of interest)

b) no3. Adequacy of follow up of cohorts a) complete follow up - all subjects accounted for 

b) subjects lost to follow up unlikely to introduce bias - small number lost - > ___ % (select an adequate %) follow up, or description of those lost)  c) follow up rate < ___% (select an adequate %) and no description of those lost d) no statement

Slide40

Slide41

Newcastle-Ottawa Quality Assessment Scale: Case-Control StudiesSelection (4)

Comparability (1)

Exposure (3)

A study can be awarded a maximum of one star for each numbered item within the Selection and Exposure categories. A maximum of two stars can be given for Comparability

Slide42

1. Is the case definition adequate? a) yes, with independent validation 

b) yes, eg record linkage or based on self reports

c) no description

2.

Representativeness of the cases

a) consecutive or obviously representative series of cases

b) potential for selection biases or not stated

3.

Selection of Controls

a) community controls  b) hospital controls c) no description4.

Definition of Controls a) no history of disease (endpoint)  b) no description of source

Selection

>1 person/record/time/process to extract information, or reference to primary record

source such as x-rays or medical/hospital records

e.g. ICD codes in database

or self-report with no reference to primary record or no description

Slide43

Comparability1. Comparability of cases and controls on the basis of the design or analysis

a) study controls for ___________ (select the most important factor)

b) study controls for any additional factor (This criteria could be modified to indicate specific control for a second important factor.)

Slide44

Exposure1. Ascertainment of exposure

a) secure record (eg surgical records)

b) structured interview where blind to case/control status

c) interview not blinded to case/control status

d) written self report or medical record only

e) no description

2.

Same method of ascertainment for cases and controls

a) yes

 b) no3. Non-Response Rate a) same rate for both groups

 b) non respondents described c) rate different and no designation

Slide45

Applications:Assess quality of nonrandomized studiesIncorporate assessments in interpretation of meta-analytic resultsDesign, content and ease of use

Slide46

Long Term Hormone Replacement Therapy and Coronary Heart Disease Events

Slide47

Clearly formulated questionComprehensive data search

Unbiased selection and abstraction process

Critical appraisal of data

Synthesis of data

Perform sensitivity and subgroup analyses if appropriate and possible

Prepare a structured report

Steps of a Cochrane Systematic Review

Slide48

ObjectiveIs there a relationship between hormone replacement therapy and the incidence of coronary heart disease in postmenopausal women

Slide49

Inclusion CriteriaTypes of studiescase-control, cohort or cross-sectional studiesPopulationpostmenopausal women

Intervention

women exposed to hormone replacement therapy (estrogen or estrogen + progesterone)

ever, current, past

Outcomes

coronary heart disease (events)

fatal, non-fatal, both

Slide50

Clearly formulated questionComprehensive data search

Unbiased selection and abstraction process

Critical appraisal of data

Synthesis of data

Perform sensitivity and subgroup analyses if appropriate and possible

Prepare a structured report

Steps of a Cochrane Systematic Review

Slide51

Search StrategyElectronic Search of:MEDLINE (1966 to May 2000)Current Contents (to May 2000)

Other Data Sources:

review of references cited in retrieved articles

Slide52

Clearly formulated questionComprehensive data search

Unbiased selection and abstraction process

Critical appraisal of data

Synthesis of data

Perform sensitivity and subgroup analyses if appropriate and possible

Prepare a structured report

Steps of a Cochrane Systematic Review

Slide53

Data Extraction2 independent reviewers selected trials2 independent reviewers extracted data using pre-determined formsstudy design

population characteristics

exposure to implants

outcomes measures

results

differences resolved by consensus

Slide54

Results16 case-control or cross-sectional14 cohort

Slide55

Quantification of EffectsExposure (ever, current, past)Outcome (fatal, non-fatal, both) Effect estimates (EE)

Relative Risk (RR)

Odds Ratio (OR)

Adjusted effect estimates

Effects vs population, follow-up periods, etc. (homogeneity)

Slide56

Clearly formulated questionComprehensive data search

Unbiased selection and abstraction process

Critical appraisal of data

Synthesis of data

Perform sensitivity and subgroup analyses if appropriate and possible

Prepare a structured report

Steps of a Cochrane Systematic Review

Slide57

Avila / 90Cauley / 97

Grodstein / 96

Henderson / 91

Lafferty / 94

Wilson / 85

Wolf / 96

Lauritzen / 83

Ettinger / 96

Petitti / 87

Sourander / 98

Bush / 87

Criqui / 98

Folsom / 95

Cohort Star Template

Selection Comparability Outcome

Slide58

Adam / 81Beard / 89

Croft / 89

Grodstein / 97

Heckbert / 97

LaVecchia / 87

Mann / 94

Pfeffer / 78

Rosenberg / 76

Rosenberg / 80

Rosenberg / 93

Ross / 81

Sidney / 97

Szklo / 84

Talbott / 77

Thompson / 89

Case-Control Star Template

Selection Comparability Exposure

Slide59

Adjusted Effect Estimates for Coronary Heart Disease (All Events) (HRT: Estrogen Current Use)Case-Control Studies

Selection Comparability Exposure

Slide60

Adjusted Effect Estimates for Coronary Heart Disease (All Events) (HRT: Estrogen Past Use)Case-Control Studies

Selection Comparability Exposure

Slide61

Adjusted Effect Estimates for Coronary Heart Disease (All Events) (HRT: Estrogen Ever Use)Case-Control Studies

Selection Comparability Exposure

Slide62

Adjusted Effect Estimates for Coronary Heart Disease (All Events) (HRT: Estrogen + Progestin Ever Use)Case-Control Studies

Selection Comparability Exposure

Slide63

Adjusted Effect Estimates for Coronary Heart Disease (All Events) (HRT: Estrogen Current Use)Cohort Studies

Selection Comparability Outcome

Slide64

Adjusted Effect Estimates for Coronary Heart Disease (All Events) (HRT: Estrogen Ever Use)Cohort Studies

Selection Comparability Outcome

Slide65

Current Development: Validity Face/content validityCriterion validitycompare to more comprehensive scales

compare to expert judgement

Construct validity

external criteria

‘convergent validity’

‘divergent validity’

internal structure

‘factorial validity’

Slide66

Current Development: Reliability Inter-rater reliabilityIntra-rater reliability

Slide67

Future Development: Scoring Identify threshold score distinguishing between ‘good’ and ‘poor’ quality studies

Slide68

The Newcastle-Ottawa Scale (NOS) for Assessing the Quality of Nonrandomized Studies in Meta-Analysis www.lri.ca

NOS Quality Assessment Scales:

Case-control studies

Cohort studies

Manual for NOS Scales

Slide69