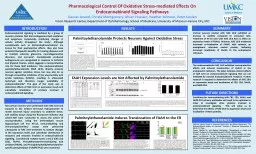
/
INTRODUCTION Pharmacological Control Of Oxidative Stress-mediated Effects On INTRODUCTION Pharmacological Control Of Oxidative Stress-mediated Effects On

INTRODUCTION Pharmacological Control Of Oxidative Stress-mediated Effects On - PowerPoint Presentation

olivia-moreira
olivia-moreira . @olivia-moreira
Follow
348 views
Uploaded On 2018-10-13

INTRODUCTION Pharmacological Control Of Oxidative Stress-mediated Effects On - PPT Presentation

Endocannabinoid Signaling Pathways Gaurav Anand Christa Montgomery Ahsan Hussain Heather Johnson Peter Koulen Vision Research Center Department of Ophthalmology School of Medicine University of MissouriKansas City MO ID: 689135

faah1 nae colocalization cells nae faah1 cells colocalization endocannabinoid analysis figure expression treated stress µm levels vehicle effects oxidative

Share:

Link:

Embed:

Download Presentation from below link

Download Presentation The PPT/PDF document "INTRODUCTION Pharmacological Control Of ..." is the property of its rightful owner. Permission is granted to download and print the materials on this web site for personal, non-commercial use only, and to display it on your personal computer provided you do not modify the materials and that you retain all copyright notices contained in the materials. By downloading content from our website, you accept the terms of this agreement.


Presentation Transcript

Slide1

INTRODUCTION

Pharmacological Control Of Oxidative Stress-mediated Effects On

Endocannabinoid Signaling Pathways

Gaurav

Anand, Christa Montgomery, Ahsan Hussain, Heather Johnson, Peter KoulenVision Research Center, Department of Ophthalmology, School of Medicine, University of Missouri-Kansas City, MO

Endocannabinoid signaling is mediated by a group of receptor proteins that bind endogenous lipid mediators and exogenous compounds, producing changes in cellular activity throughout the body1. Although cannabinoids such as Δ9-tetrahydrocannabinol are known for their psychoactive effects, they also have potential therapeutic benefits for treating diseases such as multiple sclerosis, glaucoma, neurodegenerative disorders, and anorexia2. Cannabinoids produced endogenously are upregulated in response to ischemia and physical trauma, which suggests a neuroprotective role for these lipid mediators. One endocannabinoid, palmitoylethanolamide (NAE 16:0), directly protects neurons against oxidative stress, but may also do so through competitive inhibition of the enzyme fatty acid amide hydrolase (FAAH1), resulting in attenuated hydrolysis and therefore longer availability of endocannabinoids3. The goal of this study was to determine effects of NAE 16:0 on expression levels and subcellular localization of proteins involved in endocannabinoid signaling.

METHODS

Rat cortical neurons were pretreated with NAE 16:0 and exposed to the oxidant tert-butyl hydroperoxide to model neuronal injury secondary to oxidative stress. Cell viability assays using the fluorescent indicator dye calcein-AM were conducted to assess the extent of neuroprotection. Using the immortalized mouse hippocampal cell line HT-22, immunoblotting and immunocytochemistry assays were performed subsequent to NAE 16:0 treatment to analyze changes in the expression levels and subcellular distribution of receptors and enzymes involved in endocannabinoid signaling. Cannabinoid receptor types 1 and 2 (CB1 and CB2), FAAH1, N-acylethanolamine-hydrolyzing acid amidase (NAAA), and N-acylphosphatidylethanolamine-specific phospholipase D (NAPE-PLD) were examined.

RESULTS

SUMMARY

Cortical neurons treated with NAE 16:0 exhibited an increase in viability compared to untreated cells. Treatment of HT-22 cells with NAE 16:0 had no effect on expression levels of FAAH1. However, NAE 16:0 treatment increased co-localization of FAAH1 with calnexin, an endoplasmic reticulum marker protein, indicating increased localization of FAAH1 to the endoplasmic reticulum.

CONCLUSION

The endocannabinoid NAE 16:0 exhibited neuroprotective effects and induced translocation of FAAH1 to the endoplasmic reticulum. The latter indicates indirect effects of NAE 16:0 on endocannabinoid signaling that are not mediated by classical endocannabinoid receptors. Further research is required to determine the effects of NAE 16:0 on expression levels and localization of CB1, CB2, NAAA, and NAPE-PLD.

FUTURE DIRECTIONS

Conditions for immunoblotting with CB1, CB2, NAAA, and NAPE-PLD primary antibodies will need to be optimized in order to investigate other proteins involved in endocannabinoid signaling. This will allow us to determine the effects of NAE 16:0 on expression levels and localization of these proteins.

REFERENCES

1

Battista, Natalia, Monia Di Tommaso, Monica Bari, and Mauro Maccarrone. “The Endocannabinoid System: An Overview.” Frontiers in Behavioral Neuroscience 6 (2012): 1-7. Web.2Kogan, Natalya M., and Raphael Mechoulam. “Cannabinoids in Health and Disease.” Dialogues in Clinical Neuroscience 9.4 (2007): 413–430. Web.3Duncan, R. Scott et al. “Protection of Neurons in the Retinal Ganglion Cell Layer against Excitotoxicity by the N-Acylethanolamine, N-Linoleoylethanolamine.” Clinical Ophthalmology (Auckland, N.Z.) 5 (2011): 543–548. PMC. Web.4Kaja, Simon et al. “Novel Mechanism of Increased Ca2+ Release Following Oxidative Stress in Neuronal Cells Involves Type 2 Inositol-1,4,5-Trisphosphate Receptors.” Neuroscience 175 (2011): 281–291. PMC. Web.5Schindelin, J.; Arganda-Carreras, I. & Frise, E. et al."Fiji: an open-source platform for biological-image analysis", Nature methods 9.7 (2012): 676-682. PMC. Web.

FAAH Expression Levels are Not Affected by Palmitoylethanolamide

Figure 3: Specificity of antibodies targeting

endocannabinoid

system proteins.

Proteins from differentiated HT-22 cells were detergent

solubilized. The protein concentration of the post-nuclear supernatant was determined by BCA assay using bovine serum albumin as a standard. Proteins were denatured in SDS loading buffer and 10 µg loaded into each well of a 10% polyacrylamide gel. PageRuler Plus (Thermo Scientific) pre-stained protein ladder was used for molecular weight estimation. Following protein transfer, nitrocellulose membranes were blocked in 5% non-fat milk. Blots were incubated in the indicated primary antibody for 48 hours at 4oC. After washing, the membranes were incubated with horseradish peroxidase-labeled secondary antibodies for 1 hour. Finally, the membranes were washed and incubated with SuperSignal West Femto (Thermo Scientific) enhanced chemiluminescent substrate and imaged. Left: image of Western blot. Right: molecular weights of the most prominent band in each lane determined by relative mobility analysis. The FAAH antibody recognized a single protein of the appropriate molecular weight. Immunoblotting blotting conditions for the CB1, CB2, NAAA, and NAPE-PLD antibodies need to be further optimized prior to analysis of expression levels.

A

B

Figure 4: Western blot analysis of FAAH1 expression levels after exposure to NAE 16:0.

HT-22 cells were grown until reaching 65-75%

confluency and then differentiated for 24 hours. The cultures were then treated overnight with 100 µM NAE 16:0, vehicle, or neither (control). Cells were rinsed with ice cold PBS, scraped from the flask, and pelleted by centrifugation. Immunoblotting was performed with anti-FAAH1 antibody as described in Figure 3. For each condition, three separate replicates were performed using different passages of HT-22 cell cultures. (A) Image of a Western blot showing FAAH1 bands just above the 53 kDa marker. Vinculin (126 kDa) was used as the loading control. (B) The size and intensity of FAAH1 and vinculin bands were measured using densitometry5. FAAH1 band intensities were normalized to vinculin. Bars represent mean ± SEM. Statistical analysis using a one-way ANOVA confirms that there is no significant difference in FAAH1 expression among the control, vehicle, or 100 µM NAE 16:0 treated cells.

Palmitoylethanolamide Protects Neurons Against Oxidative Stress

Figure 1: Chemical

structures of select endocannabinoids. Endocannabinoids are synthesized “on-demand” in response to cellular stress or injury by N-acyl-phosphatidylethanolamine-selective phosphodiesterase (NAPE-PLD) from phospholipid precursors located in the cell membrane. Following their release, endocannabinoids can bind to plasma membrane receptors, cannabinoid receptor 1 (CB1; more abundant in the central nervous system) and cannabinoid receptor 2 (CB2; more abundant in the immune system). Endocannabinoids are enzymatically inactivated by fatty acid amide hydrolase 1 (FAAH1) and N-acylethanolamine-hydrolyzing acid amidase (NAAA). In the brain, 2-arachidonyl glycerol (top) is more abundant than arachidonoyl ethanolamide (anandamide; middle). Their congener, palmitoyl ethanolamide (NAE 16:0; bottom) is also more abundant than anandamide but does not appreciably interact with CB1 or CB2 receptors. Like other endocannabinoids, NAE 16:0 potentiates the effect of anandamide by competing with anandamide for hydrolysis at FAAH1.

Figure 2: Calcein cell viability assay of cortical neurons treated with NAE 16:0 and exposed to oxidative stress. Primary rat cortical neurons were pre-treated for 1-2 hours with media, vehicle, or increasing concentrations of NAE 16:0. Cells were either exposed to oxidative stress initiated by the addition of 7.5 µM tBHP (insult) or treated with an equal volume of sterile water (mock). After 16-18 hours, fluorimetric calcein-AM viability assays were conducted to measure neuronal viability.4 (A) For each experimental condition, calcein fluorescence of six replicates was averaged, and three separate experiments were performed using different neuronal cultures. Data was normalized to the vehicle, and statistical significance was assessed using Student’s t-test. (B) One-way ANOVA comparing the viability of cells under mock conditions indicates that pre-treatment with NAE 16:0 does not significantly enhance cell viability when compared to vehicle alone. (C) ANOVA analysis of cells exposed to tBHP indicates that 100 µM and 10 µM concentrations of NAE 16:0 provide statistically significant neuroprotection when compared to the vehicle alone. Bars represent mean ± SEM. A P-value of < 0.05, < 0.01, and < 0.001 is indicated by *, **, and ***, respectively, as determined by Dunnett’s post-test.

A

C

B

A

B

C

Palmitoylethanolamide Induces Translocation of FAAH to the ER

Figure 5: Examples of methods to qualitatively assess

colocalization

of fluorescent labels.

Left panels

demonstrate the “overlay” method. This representation is produced by acquiring separate images of each label and digitally merging the images. Areas where pixels from both channels are in close proximity appear yellow.

Right panels

are intensity scatterplots of the data presented in the corresponding left panels. Intensity of pixels in channel one are plotted on the X axis and pixel intensity of channel two are plotted on the Y axis. Linear regression can be applied to determine Pearson’s coefficient (a quantitative description

colocalization). (A) Complete or 100% colocalization produced by duplication. (B) Complete colocalization as in A but with disparity in channel intensities. (C) Partial colocalization. (D) Exclusion or 0% colocalization as when one signal is confined to the nucleus and the other to the cytoplasm.

Figure 6: Immunocytochemical colocalization analysis of FAAH and the endoplasmic reticulum proteinCalnexin. HT-22 cells were seeded onto coverslips, incubated overnight, and then differentiated for 24 hours. The cultures were then treated overnight with 100 µM NAE 16:0, vehicle, or neither (control). Fixed, permeabilized cells were incubated with primary antibody for 48 hours at 4oC. After washing, the coverslips were incubated with fluorescently-labeled secondary antibodies for 1 hour. Confocal images were collected at 40x 1 µm above and below the brightest plane in 0.15 µm slices. Laser intensities and all other parameters were held constant for all images. Images were analyzed using FIJI image analysis software.5 Noise reduced images were thresholded using the Costes automated method. Scatterplots were generated using “Cololoc 2” with bisecting linear regression. Pearson’s and Mander’s coefficients were determined using the “JACoP” plugin. Data is represented as mean ± SEM.

Figure 7

: Statistical analysis of FAAH1

colocalization

with the endoplasmic reticulum protein

calnexin

.

Pearson’s and

Mander’s

coefficients measured in Figure 6 were plotted and statistical analysis was performed with

GraphPad Prism

5.0

. Bars represent mean ± SEM.

Pearson’s coefficient describes the extent of overlap between image pairs. A Pearson’s coefficient > 0.5 indicates significant

colocalization

.

Mander’s

coefficient describes the contribution of one color channel to overall

colocalization

. A

Mander’s

coefficient >

0.6

indicates

colocalization

. One-way

ANOVA

indicates

that there

is a

significant

increase in

FAAH1

and

calnexin

colocalization

in HT-22 cells treated with NAE 16:0 when compared to vehicle treated cells. A

P-value of < 0.05, < 0.01, and < 0.001 is indicated by *, **, and ***, respectively, as determined by

Dunnett’s

post-test

.