/
Healthy Lifestyles Healthy Lifestyles

Healthy Lifestyles - PowerPoint Presentation

pamella-moone
pamella-moone . @pamella-moone
Follow
382 views
Uploaded On 2017-12-20

Healthy Lifestyles - PPT Presentation

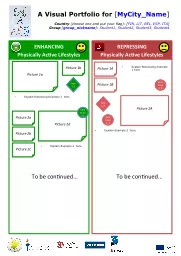
PRC Results PRC Assessment Findings Healthy Lifestyles Prevalence of Total Overweight Percent of Adults With a Body Mass Index of 250 or Higher Sources PRC Community Health Surveys Professional Research Consultants Inc Item 181 ID: 616854

healthy health professional prc health healthy prc professional lee consultants research county survey community lifestyles respondents asked services national 2013 sources notes

Share:

Link:

Embed:

Download Presentation from below link

Download Presentation The PPT/PDF document "Healthy Lifestyles" is the property of its rightful owner. Permission is granted to download and print the materials on this web site for personal, non-commercial use only, and to display it on your personal computer provided you do not modify the materials and that you retain all copyright notices contained in the materials. By downloading content from our website, you accept the terms of this agreement.
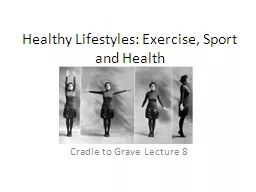

Presentation Transcript

Slide1

Healthy Lifestyles

PRC ResultsSlide2

PRC Assessment Findings

Healthy LifestylesSlide3

Prevalence of Total Overweight

(Percent of Adults With a Body Mass Index of 25.0 or Higher)

Sources: ● PRC Community Health Surveys, Professional Research Consultants, Inc. [Item 181] ● 2013 PRC National Health Survey, Professional Research Consultants, Inc. ● Behavioral Risk Factor Surveillance System Survey Data. Atlanta, Georgia. United States Department of Health and Human Services, Centers for Disease Control and Prevention (CDC): 2012 Florida data.Notes:

● Based on reported heights and weights, a

sked of all respondents.

● The definition of overweight is having a body mass index (BMI), a ratio of weight to height (kilograms divided by meters squared), greater than or equal to 25.0, regardless of gender. The definition for obesity is a BMI greater than or equal to 30.0.Slide4

Prevalence of Obesity

(Percent of Adults With a Body Mass Index of 30.0 or Higher)

Sources: ● PRC Community Health Surveys, Professional Research Consultants, Inc. [Item 181] ● 2013 PRC National Health Survey, Professional Research Consultants, Inc. ● US Department of Health and Human Services.  Healthy People 2020. December 2010. http://www.healthypeople.gov [Objective NWS-9] ● Behavioral Risk Factor Surveillance System Survey Data. Atlanta, Georgia. United States Department of Health and Human Services, Centers for Disease Control

and Prevention (CDC): 2012 Florida data.

Notes:

● Based on reported heights and weights, asked of all respondents. ● The definition of obesity is having a body mass index (BMI), a ratio of weight to height (kilograms divided by meters squared), greater than or equal to 30.0,

regardless of gender.

Lee County At-Risk

Higher prevalence of obesity:

Market Area 2

residents = 33.3%

Low-income

residents

(<200% FPL) = 31.1%

Adults

age 40-64

= 30.5%Slide5

Relationship of

Overweight With Other Health Issues(By Weight Classification; Lee County, 2014)

69.9% of overweight/obese adults have

not

been advised about weight by a health professional in the past year.

61.2% of overweight/obese adults are

not

trying to lose weight by modifying both diet and exercise.Slide6

Child Obesity Prevalence

(Percent of Children 5-17 Who Are Obese; Body Mass Index in the 95th

Percentile or Higher)Sources: ● PRC Community Health Surveys, Professional Research Consultants, Inc. [Item 185] ● 2013 PRC National Health Survey, Professional Research Consultants, Inc.

US Department of Health and Human Services.  Healthy People 2020. December 2010. http://www.healthypeople.gov

[Objective NWS-10.4]Notes: ● Asked of all respondents with children age 5-17 at home.

● Obesity among children is determined by children’s Body Mass Index status equal to or above the 95

th

percentile of US growth charts by gender and age.

Lee County Trend

35.9% are overweight

or

obese

Lee County At-Risk

Childhood obesity is higher among younger children,

age 5-12

= 29.1%Slide7

Consume Five or More Servings

of Fruits/Vegetables Per Day

Sources: ● PRC Community Health Surveys, Professional Research Consultants, Inc. [Item 173] ● 2013 PRC National Health Survey, Professional Research Consultants, Inc.Notes: ● Asked of all respondents. ● For this issue, respondents were asked to recall their food intake on the previous day.

Lee County At-Risk

Lower consumption among:

Low-income

residents

(<200% FPL) = 24.3%

African American

(23.0%) or

Hispanic

(27.2%) residents

Residents of

Market Area 2

(28.6%) or

Market Area 3

(28.8%)

Men

= 30.3%Slide8

Find It “Very” or “Somewhat”

Difficult to Buy Affordable Fresh Produce

Sources: ● 2014 PRC Community Health Survey, Professional Research Consultants, Inc. [Item 108] ● 2013 PRC National Health Survey, Professional Research Consultants, Inc.Notes: ● Asked of all respondents.

49.8% report that this is “not at all difficult,” 29.1% “not too difficult.”

Lee County At-Risk

Greater difficulty among:

Low-income

residents

(<200% FPL) = 39.7%

Women

= 26.4%Slide9

No Leisure-Time

Physical Activity in the Past Month

Sources: ● PRC Community Health Surveys, Professional Research Consultants, Inc. [Item 110] ● Behavioral Risk Factor Surveillance System Survey Data. Atlanta, Georgia. United States Department of Health and Human Services, Centers for Disease Control and Prevention (CDC): 2012 Florida data.

● 2013 PRC National Health Survey, Professional Research Consultants, Inc.

US Department of Health and Human Services.  Healthy People 2020. December 2010. http://www.healthypeople.gov

[Objective PA-1]Notes: ● Asked of all respondents.

Lee County At-Risk

Higher among:

Hispanic

residents = 30.3%

Women

= 26.3%

Low-income

residents

(<200% FPL) = 25.9%

Most favorable in Market Area 4 (16.0%)

Indicators of frequency, intensity and duration are similar to national findings, and similar among areas of the county.Slide10

Child Is Physically Active for

One or More Hours per Day(Among Children Ages 2-17)

Sources: ● 2014 PRC Community Health Survey, Professional Research Consultants, Inc. [Item 142] ● 2013 PRC National Health Survey, Professional Research Consultants, Inc.Notes: ● Asked of all respondents with children age 2-17 at home. ● Includes children reported to have one or more hours of physical activity on each of the seven days preceding the survey.

Children With Three or More Hours per School Day of Total Screen Time

(Among Parents of Children 5-17)

Highest in teens.

Lowest in teens.Slide11

Lee County At-Risk

Seat belt usage is lower among:

Adults

age 18-39

= 86.6%

Low-income

residents

(<200% FPL) = 86.8%

Men

= 87.5%

Most favorable in Market Area 4 (93.3%)

“Always” Wear a Seat Belt

When Driving or Riding in a Vehicle

Sources:

● PRC Community Health Surveys, Professional Research Consultants, Inc. [Item 58]

● Behavioral Risk Factor Surveillance System Survey Data. Atlanta, Georgia. United States Department of Health and Human Services, Centers for Disease Control

and Prevention (CDC): 2012 Florida data.

● 2013 PRC National Health Survey, Professional Research Consultants, Inc.

US Department of Health and Human Services.  Healthy People 2020. December 2010. http://www.healthypeople.gov

[Objective IPV-15]

Notes: ● Asked of all respondents.Slide12

Texted While Driving One or More Times in the Past Month

(Lee County, 2014)

Sources: ● 2014 PRC Community Health Survey, Professional Research Consultants, Inc. [Item 67]Notes: ● Asked of all respondents.

● Hispanics can be of any race. Other race categories are non-Hispanic categorizations (e.g., “White” reflects non-Hispanic White respondents).

● Income categories reflect respondent's household income as a ratio to the federal poverty level (FPL) for their household size. “Low Income” includes households

with incomes up to 200% of the federal poverty level; “Mid/High Income” includes households with incomes at 200% or more of the federal poverty level.

13.2% said 3+ timesSlide13

Lee County At-Risk

Higher smoking rates among:

Low-income

residents

(<200% FPL) = 22.1%

Adults

age 40-64

= 17.5%

No significant difference by geography

Current Smokers

Sources: ● PRC Community Health Surveys, Professional Research Consultants, Inc. [Item 186]

● 2013 PRC National Health Survey, Professional Research Consultants, Inc.

● Behavioral Risk Factor Surveillance System Survey Data. Atlanta, Georgia. United States

Department of Health and Human Services, Centers for Disease Control and Prevention (CDC): 2012 Florida data.

● US Department of Health and Human Services.  Healthy People 2020. December 2010. http://www.healthypeople.gov [Objective TU-1.1]

Notes: ● Asked of all respondents.

● Includes regular and occasional smokers (those who smoke cigarettes everyday or on some days).

Smoking cessation attempts have increased significantly since 2007.Slide14

Lee County At-Risk

Higher exposure among:

Low-income

households

(<200% FPL) = 16.5%

African American

households = 17.6%

Market Area 2

households = 13.5%

Member of Household Smokes at Home

Sources: ● PRC Community Health Surveys, Professional Research Consultants, Inc. [Items

72, 188]

● 2013 PRC National Health Survey, Professional Research Consultants, Inc.

Notes: ● Asked of all respondents.

● “Smokes at home” refers to someone smoking cigarettes, cigars, or a pipe in the home an average of four or more times per week in the past month.

same trend is seen in households with kidsSlide15

Healthy Lifestyles

Update

Sarah Baker &Pastor William Glover Co-ChampionsSlide16

Healthy Lifestyles

Encourage Lee County residents to pursue a culture of healthy lifestyles including access to nutritional information, physical activity and exercise, stress management, routine medical exams/check-ups, and information on prevention of risk factors for disease. Develop accessible community programs for health literacy, population management, system and policy changes to support a healthy and safe environment while improving the economics of health care in our community. Slide17

Healthy Lifestyles ScorecardSlide18

Status

% of population obese (BMI >= 30):

24.8%Tobacco Use: 13.5%Infant Mortality: 5.1%

Low

Birthweight

<2500 grams: 8.1%Prenatal Care in the First Trimester:

73.0%Slide19

Accomplishments

Healthy Lee Coalition

Focused on creating and sustaining a community culture of healthier lifestyles within Lee County.Distribution list currently has 202 contacts representing 94 organizations as well as 17 citizens.Meets Quarterly / Next meeting: July 31, 2014Five goal areas: Expand Commitment to Healthy LeeImprove Nutritional Habits of the People in Lee CountyIncrease Physical Activity of the People in Lee County

Encourage Healthy Lifestyles and Wellness Initiative in the Workplace, Neighborhoods, and Churches

Influence Policy and Environmental changes in support of healthier lifestylesSlide20

Accomplishments

Streets Alive! – November 10, 2013Slide21

Accomplishments

“Good for You” video produced with Lee County School District’s Healthy Living Lab Harry Chapin Food Bank“Fresh Produce Rescue Program” distributed 5.1 million pounds of produce in 2013.Distributed 100 millionth pound of food.Tobacco Free LeeCandy-flavored tobacco resolutions passed (3 of 5 municipalities).

Policy eliminating e-cigarette use in schools and an alternative to suspension for students who violate tobacco use rules.Slide22

Accomplishments

21st

Century Collaboration – Teen Outreach ProgramBest practice program to prevent teen pregnancy through structure after school programs.Implemented last yearHorizon Council Workplace Wellness SummitMarch 2014 – sold out event / over 150 attendees Half-day session with local / national speakers and health/wellness vendorsExit surveys indicate high levels of satisfaction and a desire to attend another summit next yearSlide23

Opportunities for Improvement

21st

Century Collaboration – Teen Outreach ProgramProgram limited by available resources. State of Florida 2014 Health and Human Services Budget included $450,000 for program expansion and signed into law by the governor.Healthy Start of Southwest FloridaSeveral state government funding losses will result in major reductions in services in Lee County and the surrounding area.Prenatal care for the uninsured will no longer be covered by Healthy Start.Lee County Sustainability Plan

Program has been suspended indefinitelySlide24

Next Steps

Expand 5210 program reachAgreement with Lee Physicians Group Pediatric practice to pilot 5210 at the Page Field practice. Next Event: November 2, 2014 Resources, volunteers, and sponsors needed.Horizon Council Workplace Wellness Summit

Next event currently being planned for 2015Slide25

Healthy Lifestyles

The review today leads me to conclude that overall we are on the right track to reach our 2017 goals for Healthy Lifestyles

.YesNoSlide26

Healthy Lifestyles

We are on the right track to reach the Obesity goal by 2017.

Yes NoSlide27

Healthy Lifestyles

We are on the right track to meet our Tobacco use

goal by 2017.YesNoSlide28

Healthy Lifestyles

We are on the right track to meet our Healthy Newborn goals for 2017

.YesNo Slide29

Discussion