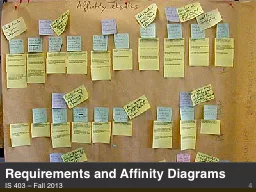
/
Requirements and Affinity Diagrams Requirements and Affinity Diagrams

Requirements and Affinity Diagrams - PowerPoint Presentation

pamella-moone
pamella-moone . @pamella-moone
Follow
440 views
Uploaded On 2016-08-01

Requirements and Affinity Diagrams - PPT Presentation

IS 403 Fall 2013 4 Admin Assignment 1 due Thursday at 23000pm And A0 must have been submitted ID: 429039

users requirements stakeholders web requirements users web stakeholders data system functional site design load user minutes activity page part

Share:

Link:

Embed:

Download Presentation from below link

Download Presentation The PPT/PDF document "Requirements and Affinity Diagrams" is the property of its rightful owner. Permission is granted to download and print the materials on this web site for personal, non-commercial use only, and to display it on your personal computer provided you do not modify the materials and that you retain all copyright notices contained in the materials. By downloading content from our website, you accept the terms of this agreement.


Presentation Transcript

Slide1

Requirements and Affinity DiagramsIS 403 – Fall 2013 4Slide2

AdminAssignment 1 due Thursday at 2:30:00pmAnd A0 must have been submittedQuestions?Added a paper prototyping lecture (next Thursday)2Slide3

TodayTools for planning our designRequirements gathering/brainstormingPersonas3Slide4

Requirements“What to make”4Slide5

Experience of requirements from other courses?5Slide6

What requirements tell usWhat features a system should have (functional requirements)What qualities the system should have (non-functional requirements)Examples?6Slide7

Types of requirements7http://usabilitygeek.com/requirements-gathering-user-experience-pt1/Slide8

Functional vs. non-functionalFunctionalFeaturesWhat the system doesNon-functionalQualities (performance, reliability, security, safety, scalability)8Slide9

Good requirementsConciseSpecificUnambiguousEasy to measureTied to dataNumbered9Slide10

Debug this requirement“The main web site page will load quickly”10Slide11

Debug this requirement“The main web site page will load quickly”“R1. The home page will load (completely, vs. some content) in N seconds”11

Concise

Specific

Unambiguous

Easy to measure

Tied to data

NumberedSlide12

Debug this requirement“The main web site page will load quickly”“R1. On a broadband connection, the main web site will load within 5 seconds [see interview data XX]”12

Concise

Specific

Unambiguous

Easy to measure

Tied to data

NumberedSlide13

Remember users vs. stakeholdersRequirements don’t just affect usersOther stakeholdersBusiness sponsors“Secondary users” – provide input/output to the system, but don’t actually interact with it“Tertiary users” – not primary or secondary user, but affected by systemFacilitating users – who else might interact with the system? (designers, maintenance)13Slide14

StakeholdersWe are designing a new electronic lock for UMBC dormsWho are our users/stakeholders?Primary: StudentsSecondary: maintenance, RAs/res lifeTertiary: Visitors, emergency personnel, campus police, university admin, parentsFacilitating: developers, designers14Slide15

How to gather requirements?15Slide16

Mini-activity: requirementsLet’s brainstorm requirements for a web app: UMBC course scheduleFunctional (features)Non-functional (attributes)4 minutes16Slide17

RequirementsHow to make them?Walkthrough/task analysisCompetitor analysisFunctional requirementsPrinting, sharing the schedule (by email)Any user (student or faculty) must be able to log in with the appropriate credentialsShare sign on from other UMBC sitesAddDropWaitlistSwitch between semesters

Multiple use

History past semesters

Calendar view

Interactive map: help students find classes

Reminder/alert

Show view with class, instructor, room, time (table view)

Non-functional requirements

Supports encrypted connections

Cross-platform compatibility (phone, laptop. Compatibility)

Web browser compatibility

Personal information must be stored securely

17Slide18

Gathering requirements18Slide19

How to gather requirements?Competitive analysis (view other web sites in category)User researchBut we need to ask the right questionsOnce we have dataBrainstorming and affinity diagramming19Slide20

Working with usersWhich users to pick?What techniques to generate ideas?20Slide21

Requirements: SourcesGood requirements start with good sources. Finding those quality sources is an important task and, fortunately, one that takes few resources.Customers Users Administrators and maintenance staff Partners Domain Experts Industry Analysts Information about competitors  Slide22

Requirements: TechniquesAfter you have identified these sources, there are a number of techniques that may be used to gather requirements. Conduct a brainstorming session Interview users Send questionnaires Work in the target environment Study analogous systems Examine suggestions and problem reports Talk to support teams Study improvements made by users Look at unintended uses

Conduct workshops

Demonstrate prototypes to stakeholders Slide23

Interviews/questionnairesCan take many forms (1:1, focus groups, web surveys)How to ask the right questions?Can’t ask “what are your requirements for web site?”Start with what people like, dislike with current experiences. “pain points”What do you do with this system?What works well?What doesn’t?Analyze responses23Slide24

Participatory DesignStakeholders participate in the design process: “design in the workplace”Users are active collaborators in the design processCommon activities: Focus groups, interviews BrainstormingProduct evaluations and critiquesStoryboardingUseful when you want to design something not in your field, or something entirely newSlide25

25Slide26

EthnographyStudying actual habits and practices of stakeholders in contextLeave the lab and go find out what is really happeningBECOME part of the community, a “participant observer”Ethnographer must create detailed records of observations Notes, discrete video or audio recordingRoots in anthropology and sociology Slide27

Extreme Ethnography: Patricia MooreAt age 26, she transformed herself into a range of women over the age of 80. Disguises involved more than makeup and clothing: She altered her body with prosthetics that blurred her vision, reduced her ability to hear and limited her motion. She used canes, walkers and a wheelchair.From 1979 to 1982, she was in the roles about every third day for as much as 20 hours at a time. The experiment took her to 116 cities in 14 states and two Canadian provinces.Video:

http://www.youtube.com/watch?v=

B4eOyBki3cE

Debatable if this is technically an ethnography…Slide28

Contextual InquiryAnother technique to study users in contextMuch more focused than ethnographyInvestigator works with stakeholders to learn about their work, in stakeholder environmentInvestigator interviews stakeholder and frequently uses “think aloud technique”Investigator creates detailed recordings to understand stakeholder’s habits and actionsSlide29

Analyzing data29Slide30

Analyzing dataWe have feedback from usersHow to make sense of it?Big challengesIdentifying common themesSorting and classifying30Slide31

Affinity diagrammingClustering related concepts from datawrite each element on a cardgroup or arranging cardsrank objects/actions for task relevance

spot patterns

This

is an

iterative

process: you will find questions and need to revisit your data, or collect more.Slide32

32Slide33

Activity Part 0: FeedbackLet’s critique myUMBCPair up with 1 other studentLook at homepageIdentify positives and negativesWrite them on cards4 minutes33Slide34

Activity Part 1: Affinity diagramsSplit into 2 groupsPut comments on wallOrganize themes5 minutes34Slide35

Activity Part 1: RequirementsCome up with requirementsFunctional and non-functional5 minutes35Slide36

36Slide37

Next timePersonas: who to make it for37