/
Aon Global Risk Consulting – Alex van den Doel / Rubert N Aon Global Risk Consulting – Alex van den Doel / Rubert N

Aon Global Risk Consulting – Alex van den Doel / Rubert N - PowerPoint Presentation

phoebe-click
phoebe-click . @phoebe-click
Follow
429 views
Uploaded On 2017-05-08

Aon Global Risk Consulting – Alex van den Doel / Rubert N - PPT Presentation

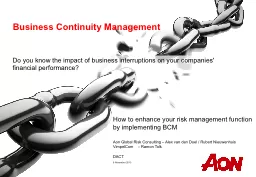
VimpelCom Ramon Tolk DACT 8 November 2013 Business Continuity Management Do you know the impact of business interruptions on your companies financial performance How to enhance your risk management function by implementing BCM ID: 546225

risk impact business management impact risk management business continuity financial bcm risks level interruption bln unit analysis global supply

Share:

Link:

Embed:

Download Presentation from below link

Download Presentation The PPT/PDF document "Aon Global Risk Consulting – Alex van ..." is the property of its rightful owner. Permission is granted to download and print the materials on this web site for personal, non-commercial use only, and to display it on your personal computer provided you do not modify the materials and that you retain all copyright notices contained in the materials. By downloading content from our website, you accept the terms of this agreement.


Presentation Transcript

Slide1

Aon Global Risk Consulting – Alex van den Doel / Rubert Nieuwenhuis

VimpelCom – Ramon TolkDACT8 November 2013

Business Continuity Management

Do you know the impact of business interruptions on your companies' financial performance?

How to enhance your risk management function by implementing BCMSlide2

Why Business Continuity Management

matters1

Ship route Suez Canal essential for international tradeSlide3

Stress Testing your continuity risks – approach

2What (extreme) scenarios can jeopardize your financial objectives?ApproachDefine risk bearing capacityDevelop scenariosIndustry specificOrganization specificOut-of-the-box Quantify impact of scenarios

Evaluate against risk bearing capacitySlide4

Stress Test – Risk Bearing Capacity

Information from financial statementsBalance sheet total: 880MEquity: 330MSolvency ratio = 38%Claim of 50M will lower ratio to 32%

An impact of 28M will lower the ratio to 34% → RBC = 28M

Covenant in financing arrangement specifies a threshold of 34%

39 %

38 %

37 %

36 %

35 %

34 %

33 %

32 %

31 %

Breach of Covenant!Slide5

Source

: Aon Global Risk Management Survey 2013 - 1.415 respondents representing a broad

range of industry sectors in 70 countries (64% > 1B turnover)

Perception of business continuity risks4Slide6

Impact on financial

performanceAn average impact of 25% on shareholder value and an impact whichcommonly lasts for two years!Historically, supply chain disruptions canlead to an average of 9 percent lower sales and 11 percent higher costs!Both physical and non-physical events drive supply chain disruptions, and 85%of companies reported disruptions in2011 (study of BCI in 2011)

Other recent examples: 5

Source: Vinod Singhal, Professor at Georgia Institute of Technology, and Professor Kevin Hendricks, Richard Ivey School of Business, The University of Western Ontario, London, Ontario N6A-3K7, Canada

CompanyEventValue ReactionTEPCO

Japan EQ

-89.6%

- $ 37bln

Dexia

Greek debt

-87.3%

- $ 3.9

bln

Research

in Motion

Service Disruption

-49.7%

- $ 6

bln

BP

Explosion / Oil

spill

-29%

- $ 53

bln

AppleIphone Antenna-2.4%- $ 6 blnSlide7

Objectives

Protecting your financial performance from the impact of business interruption risksUnderstanding methods and techniques to map supply chain interruption risks and quantify the financial impact on revenue generating activitiesEnhancing Enterprise Risk Management by implementing Business Continuity Management and focus on high impact exposuresEvolving the Risk & Insurance function towards a more mature operational risk management function6Slide8

Agenda

Analyzing the impact of business interruption exposures on financial performanceBusiness Continuity Management - ExecutionLink BCM – ERMBuiness Continuity Management ProcessQuantifying

financial impactBusiness Continuity Management – In Practice

Case study VimpelCom – Peter den DekkerQuestions7Slide9

What is BCM

"BCM is the ongoing process of identifying continuity threatening risks and defines a program for mitigating those risks and recovering as soon as possible within predefined time objectives".

8

Structured programme and processSlide10

How does BCM link ERM?

9

BCM is becoming more and

more a strategic topic!!BCM is the key mitigation for continuity risksSlide11

BCM Process

10Slide12

Quantifying financial impact - Business Impact Analysis (BIA)

BIA provides a very structured and efficient approach to:Identify and quantify business interruption risksMap complex and global supply chainsMeasure the value of current mitigation measuresBIA enables organizations to consolidate the BI

exposure from unit level to every consolidated level (country, regional, global, etc.)

The BIA provides a solid basis for risk management improvement:Clear picture of the biggest interruption risks, accumulation effects and critical issuesFocused development of risk management strategies (loss prevention and response) Optimization insurance cover and limitsEnhancing business interruption risk awareness and understandingSlide13

Step 2: Example of results of quantification unit level

Sup

ply chain analysis

Dataroom

analysis

Site analysisSlide14

Step 2: Quantifying consolidated level

Delivering two key elements:Dependencies networkBased on unit level outcome defining and modeling material dependencies between suppliers, own units and customersMaking use of a "engine" to simulate impactConsolidated risk profile on selected levelCalculating the impact of unit level events though dependency networkCreating consolidated loss exposure profile on selected level