PPT-Figure 2. Semi-quantitative RT-PCR analysis of
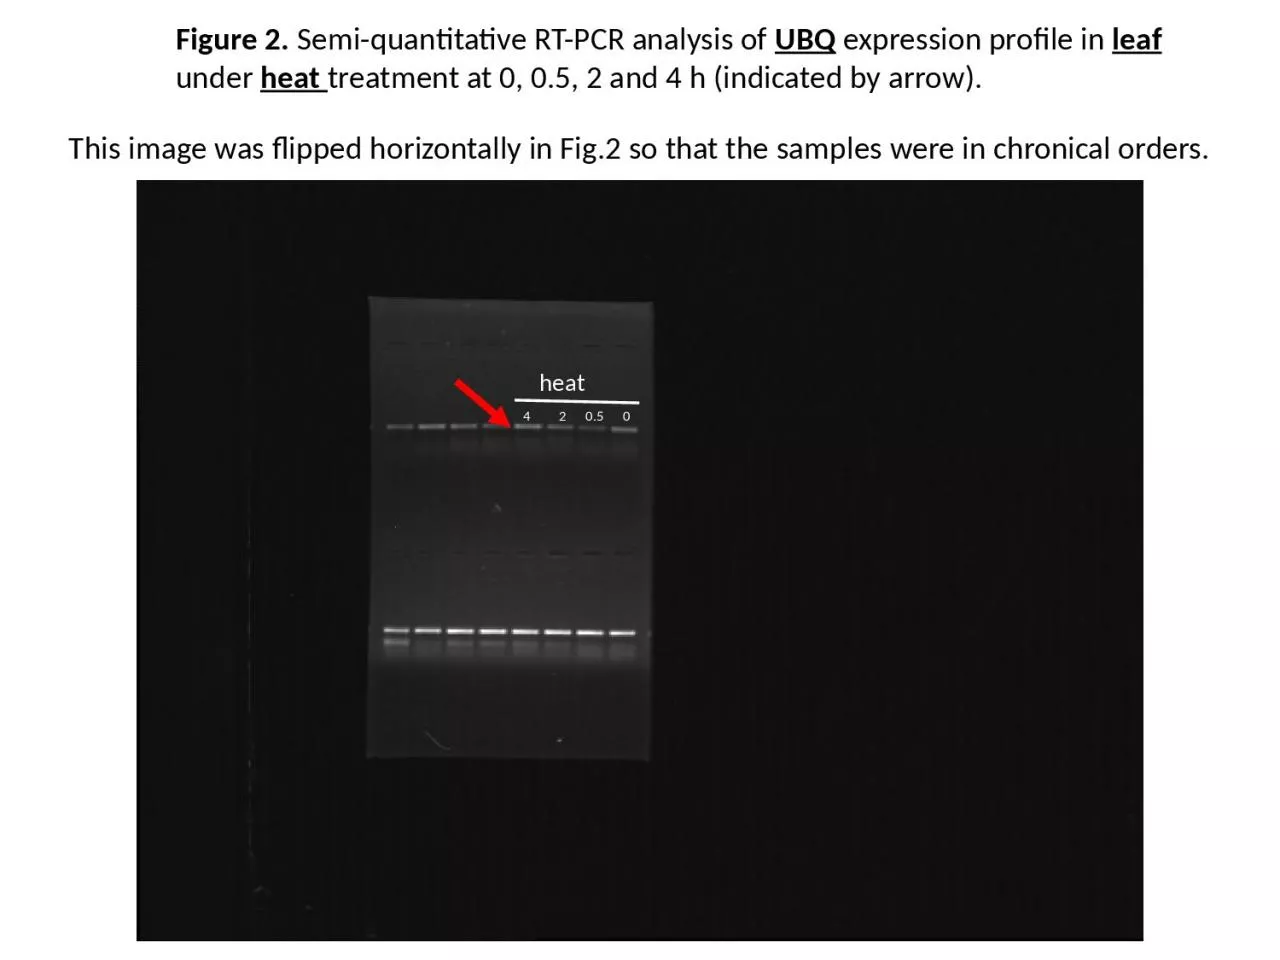
UBQ expression profile in leaf under heat treatment at 0 05 2 and 4 h indicated by arrow heat 4 2 05 0 This image was flipped horizontally in Fig2 so that the samples
Download Presentation
"Figure 2. Semi-quantitative RT-PCR analysis of" is the property of its rightful owner. Permission is granted to download and print materials on this website for personal, non-commercial use only, provided you retain all copyright notices. By downloading content from our website, you accept the terms of this agreement.
Presentation Transcript
Transcript not available.