PPT-Conceptual Models U sers see and understand the system through mental models
Author : rozelle | Published Date : 2020-06-17
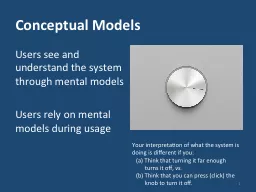
Users rely on mental models during usage 1 Your interpretation of what the system is doing is different if you a Think that turning it far enough turns it off vs
Presentation Embed Code
Download Presentation
Download Presentation The PPT/PDF document "Conceptual Models U sers see and underst..." is the property of its rightful owner. Permission is granted to download and print the materials on this website for personal, non-commercial use only, and to display it on your personal computer provided you do not modify the materials and that you retain all copyright notices contained in the materials. By downloading content from our website, you accept the terms of this agreement.
Conceptual Models U sers see and understand the system through mental models: Transcript
Download Rules Of Document
"Conceptual Models U sers see and understand the system through mental models"The content belongs to its owner. You may download and print it for personal use, without modification, and keep all copyright notices. By downloading, you agree to these terms.
Related Documents