Explore
Featured
Recent
Articles
Topics
Login
Upload
Featured
Recent
Articles
Topics
Login
Upload
Search Results for 'Chart-Bar'
Chart-Bar published presentations and documents on DocSlides.
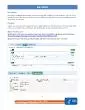
Bar ChartsDescriptionA bar chart is a graphical representation of data
by williams
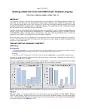
1 To access the report, select Analysi�sRe...
PMS iMOM Color Palette PMS PMS PMS PMS PMS PMS PMS PMS My Chore Chart My Chore Chart My Chore Chart DPLOLUVWOOLJKWVHVHUYHGDPLOLUVWDQGLDUHUHJLVWHUHGWUDGHPDUNV iMOM
by kittie-lecroy
com
Bar Chart You can launch
by morton
Gtplot. from . GSS. to create Bar Charts and oth...
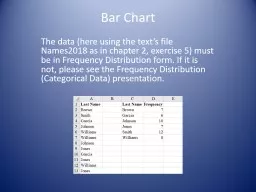
Bar Chart The data (here using the text’s file Names2018 as in chapter 2, exercise 5) must be in
by blanko
Bar Chart. Click on the Insert tab. Select cells C...
When to Use a Bar Mekko Chart
by liane-varnes
When to Use a Bar Mekko Chart. Use . a Bar Mekko ...
BAR CHART
by min-jolicoeur
Paweł Bilski. Piotr Mazur. Paulina Wawryca. Defi...
Creating a Bar Chart
by pamella-moone
On a Mac. Frequency Distribution. Create a freque...
CHARTER 1661 CHARTER OF 1661 GRANTED BY KING CHARLES II.
by erica
RADICAL IN THE JUDICIAL SYSTEM IS BROUGHT BY THE C...
Internet Re-Charter What is Re-Charter?
by liane-varnes
Renewal of the Chartered Organizations annual com...
Why Charter Government? Charles County Charter Board
by yoshiko-marsland
Charter Board Background. Charles County Commissi...
Charter Party 1 Charter Party
by danika-pritchard
A contract whereby a . shipowner. agrees to plac...
Luxury Yacht Charters Croatia
by thesuperyach
The Superyacht Collection is an exclusive range o...
CHARTER Cargolux offers experience The history of Cargoluxs charter activities goes back to the early s when the company mostly operated charter flights which later on developed into regular services
by test
Until 1995 all charter flights were operated on C...
X-bar and R charts Example 3.1
by susan
from . older text. 1. Data on part thickness. T...
Bar Charts Objectives By the end of this section, students should be able to:
by julia
represent data in a bar chart. .. Use a chart.. Ba...
Bareboat chartering and Parallel Registration for Merchant Ships
by marina-yarberry
By Professor . Alkis. John . Corres. CEO Series....
Bareboat chartering and Parallel Registration for Merchant
by liane-varnes
By Professor . Alkis. John . Corres. Bareboat ch...
Reading bar charts
by faustina-dinatale
Interpreting Data. L3. L4. Reading charts and ...
Pareto Chart QM 2017 2/1/2017
by brown
Lean Six Sigma. 1. What is Pareto Chart?. A . Pare...
Effective Visuals Using Graphs, Tables, Charts, and illustrations in Technical Reports
by smith
S. Last ENGR 120. VISUALS. Capture and hold . peo...
Pareto Chart
by myesha-ticknor
Bar chart used to display qualitative Data. Prope...
Chart Templates
by debby-jeon
Created by Troubadour Research & Consulting. ...
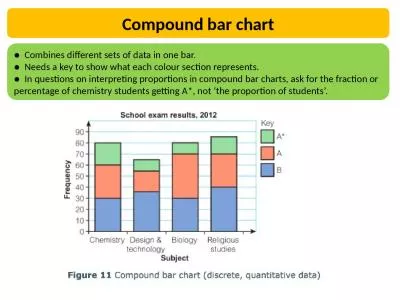
Compound bar chart ● Combines different sets of data in one bar.
by megan
● Needs a key to show what each colour section...
Strategy Consultants toolkit
by fernando493
SELLING YOUR IDEAS WITH POWERFUL CHARTS. Introduct...
Year 3 Maths Friday 12 th
by harmony
February . 2021. LO: Consolidate knowledge of stat...
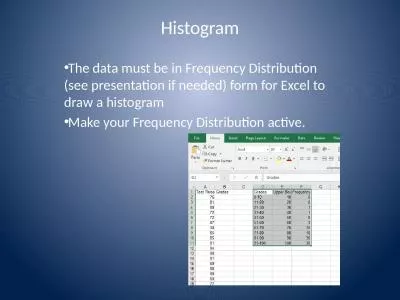
Histogram The data must be in Frequency Distribution (see presentation if needed) form for Excel to
by bitsy
Make your Frequency Distribution active.. Histogra...
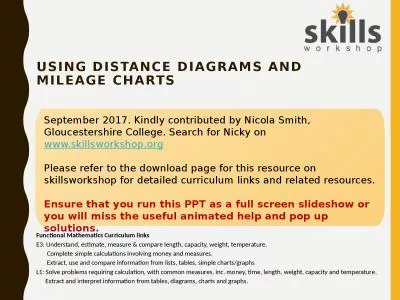
USING DISTANCE DIAGRAMS and MILEAGE CHARTS
by ash
Functional Mathematics Curriculum links. E3: Under...
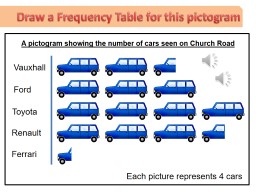
Draw a Frequency Table for this pictogram
by kimberly
Ferrari. Renault. Toyota. Ford. Vauxhall. A pictog...
PROJECT TIME PLANNING Process and Bar Chart Technique
by lam
Planning is the process of thinking systematically...
Graph for Data Presentation
by elizabeth
Computer science 2. nd. Stage . College of Pharma...
x0000x00001 xMCIxD 0 xMCIxD 0 Paper HW2013Building
by eve
From Wikipedia bar chartor bar graphis a chart wit...
A histogram is a graphical representation of the distribution of data.
by zoe
It is an estimate of the probability distribution ...
Descriptive statistics (2)
by pagi
Qualitative data. 1. 2. Another Classification. ...
Bar Chart – Finding Averages – Worksheet A
by desha
The worksheet is in 2 sizes.. To print handouts fr...
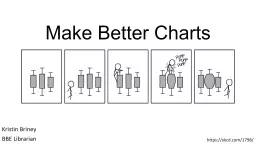
Make Better Charts Kristin Briney
by cadie
BBE Librarian. https://xkcd.com/1798/. It’s not ...
Data that is counted and has no in-between value is called
by lydia
discrete data. . Discrete data is usually collecte...
Charts and Graphs V105.01
by tatyana-admore
Types of Charts and Their Uses. Why create charts...
Variables Data Statistical Process Control
by liane-varnes
Click Here . to Begin . Introduce Statistical Pro...
Guide to Using Excel 2007 For Basic Statistical Application
by alida-meadow
To Accompany. Business Statistics: A Decision Mak...
Illustrations
by luanne-stotts
Artwork. traditional. . pasteup. . method. . o...
Load More...