Explore
Featured
Recent
Articles
Topics
Login
Upload
Featured
Recent
Articles
Topics
Login
Upload
Search Results for 'data interpret'
data interpret published presentations and documents on DocSlides.
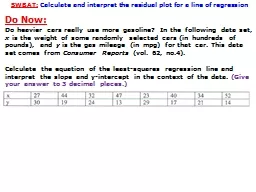
SWBAT: Calculate and interpret the residual plot for a line of regression
by lois-ondreau
Do Now:. Do heavier cars really use more gasoline...
Chapter 3 Describing Relationships
by mitsue-stanley
Section 3.2. Least-Squares Regression. Least-Squa...
Ch3 Bivariate Data
by sherrill-nordquist
Scatterplots. Regression. Scatterplots. Scatterpl...
Delaware School Survey Data Understand, Interpret, Use & Share
by yoshiko-marsland
Delaware School Survey Data Understand, Interpret...
What is Data Handling?
by celsa-spraggs
An Introduction. L3. L4. Introduction to Data ...
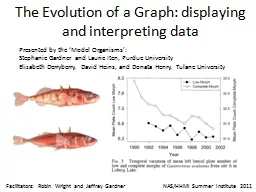
The Evolution of a Graph: displaying and interpreting data
by pasty-toler
NAS/HHMI Summer Institute 2011. Presented by the ...
Making sense of it all
by yoshiko-marsland
analysing and interpreting data. From data to ide...
NSW Curriculum and Learning Innovation Centre
by tatiana-dople
Tinker with Tinker Plots. Elaine Watkins, Senior ...
Graphical Descriptive
by danika-pritchard
Statistics I. Immaculata. Institute. July 29 –...
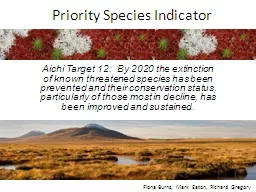
Priority Species Indicator
by olivia-moreira
Aichi Target 12: By 2020 the extinction of known...
Mathematics & Science Partnership Project:
by danika-pritchard
Building a STEM Integrated Classroom (BASIC). Bob...
Statistics Describing Data Using Tables and Graphs
by olivia-moreira
Assignment 2. Example Problems. Frequency Distrib...
Interpretation Matters: The Wild
by trish-goza
Wild. West of Precision Cancer Medicine. Kenna R...
Represent and Interpret Data
by faustina-dinatale
2.MD.10. 35. 30. X. 25. X. 20. X. 1. 2. 3. 4. KEY...
AP Statistics – Chapter 9 Test Review
by ellena-manuel
I can interpret . P. -values in context.. QUESTIO...
Standard Deviation 4 3 2
by stefany-barnette
1. 0. In addition to level 3.0 and above and beyo...
Calculate Standard Deviation
by lindy-dunigan
Analyze the spread of data.. 4. 3. 2. 1. 0. In ad...
Calculate Standard Deviation
by kittie-lecroy
Analyze the spread of data.. 4. 3. 2. 1. 0. In ad...
Introduction to Structural Geology
by stylerson
-Ge106-. Instructor:. Jean-Philippe Avouac (301NM;...
Exploring the Basin & Range Province
by roxanne
A College-level Introductory Geology Activity. ~. ...
ISSCM 491 Managerial Statistics
by mikael869
Students and Course:. Executive Degree Programs . ...
A Story of Ratios Grade 8 – Module 6
by jane-oiler
Linear Functions. Session Objectives. Discuss the...
Carl Wilson
by sherrill-nordquist
Open Planets Foundation. SCAPE Training. Guimarã...
Statistics
by liane-varnes
Describing Data Using Tables and Graphs. Assignme...
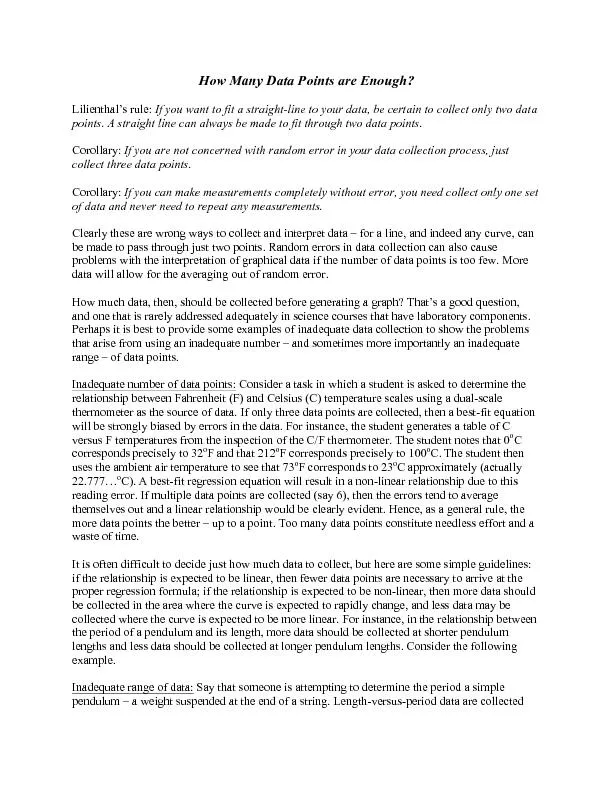
o collect and interpret data
by danika-pritchard
analysis will show that the expected period-length...
AREAS OF EXPERTISE Customer satisfaction Interpret ustomer eedback Call handling Managing Customer Data Customer service Listening to customers Managing expectations Telephone Etiquette Email handling
by alexa-scheidler
com Driving license Yes PERSONAL SKILLS Excellent ...
How do I create and interpret
by calandra-battersby
frequency tables . and . line plots. ?. Vocabular...
Some guidelines
by faustina-dinatale
PARAGRAPH STRUCTURE. What is a paragraph?. What i...
Using citizen science, academic research and a summer fello
by tatiana-dople
Science with Songbirds. Why songbirds? . A Lesso...
Interpret Unit Status Reporting Data
by giovanna-bartolotta
June . 2018. Adjutant General School. Captains Ca...
Notes #14: Stem Plots What is a Stem Plot?
by dollysprite
ANS: A . Stem and Leaf Plot. is a special table w...
Peer Reviewed
by brooke
Journals The Creation of New KnowledgeIdeaLit Revi...
Critical Areas of Focus
by julia
DRAFT 2018Algebra 2Page1Algebra 2and Mathematics 3...
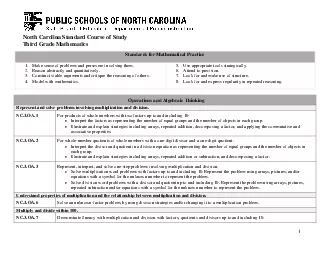
Mathematics
by faith
3-51North Carolina Standard Course of StudyThirdGr...
Load More...