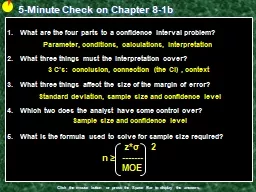
Click the mouse button or press the Space Bar to display the answers What are the four parts to a confidence interval problem What three things must the interpretation cover What three things affect the size of the margin of error ID: 760777
Download Presentation The PPT/PDF document "5-Minute Check on Chapter 8-1b" is the property of its rightful owner. Permission is granted to download and print the materials on this web site for personal, non-commercial use only, and to display it on your personal computer provided you do not modify the materials and that you retain all copyright notices contained in the materials. By downloading content from our website, you accept the terms of this agreement.
Slide1
5-Minute Check on Chapter 8-1b
Click the mouse button or press the Space Bar to display the answers.
What are the four parts to a confidence interval problem?
What three things must the interpretation cover?
What three things affect the size of the margin of error?
Which two does the analyst have some control over?What is the formula used to solve for sample size required?
Parameter, conditions, calculations, interpretation
3 C’s: conclusion, connection (the CI) , context
Standard deviation, sample size and confidence level
Sample size and confidence level
z*
σ 2n ≥ ------- MOE
Slide2Lesson 8 - 2
Estimating a Population Proportion
Slide3Objectives
CONSTRUCT and INTERPRET a confidence interval for a population proportion
DETERMINE the sample size required to obtain a level
C
confidence interval for a population proportion with a specified margin of error
DESCRIBE how the margin of error of a confidence interval changes with the sample size and the level of confidence
C
Slide4Vocabulary
none new
Slide5Proportion Review
Important properties of the sampling distribution of a sample proportion p-hatCenter: The mean is p. That is, the sample proportion is an unbiased estimator of the population proportion p.Spread: The standard deviation of p-hat is √p(1-p)/n, provided that the population is at least 10 times as large as the sample.Shape: If the sample size is large enough that both np and n(1-p) are at least 10, the distribution of p-hat is approximately Normal.
Slide6Sampling Distribution of p-hat
Approximately Normal if np ≥10 and n(1-p)≥10
Slide7Inference Conditions for a Proportion
SRS
– the data are from an SRS from the population of interest
Independence
– individual observations are independent and when sampling without replacement, N > 10n
Normality
– for a confidence interval, n is large enough so that np and n(1-p) are at least 10 or more
Slide8Confidence Interval for P-hat
Always in form of PE MOE where MOE is confidence factor standard error of the estimateSE = √p(1-p)/n and confidence factor is a z* value
Slide9Example 1
The Harvard School of Public Health did a survey of 10.904 US college students and drinking habits. The researchers defined “frequent binge drinking” as having 5 or more drinks in a row three or more times in the past two weeks. According to this definition, 2486 students were classified as frequent binge drinkers. Based on these data, construct a 99% CI for the proportion p of all college students who admit to frequent binge drinking.
p-hat = 2486 / 10904 = 0.228
Parameter:
p-hat PE
± MOE
Slide10Example 1 cont
Calculations: p-hat ± z* SE p-hat ± z* √p(1-p)/n 0.228 ± (2.576) √(0.228) (0.772)/ 10904 0.228 ± 0.010
LB = 0.218 < μ < 0.238 = UB
Interpretation: We are 99% confident that the true proportion of college undergraduates who engage in frequent binge drinking lies between 21.8 and 23.8 %.
Conditions:
1) SRS
2) Normality 3) Independence
shaky np = 2486>10 way more than
n(1-p)=8418>10 110,000 students
Slide11Example 2
We polled n = 500 voters and when asked about a ballot question, 47% of them were in favor. Obtain a 99% confidence interval for the population proportion in favor of this ballot question (α = 0.005)
Parameter: p-hat PE ± MOE
Conditions:
1) SRS
2) Normality 3) Independence
assumed np = 235>10 way more than
n(1-p)=265>10 5,000 voters
Slide12Example 2 cont
We polled n = 500 voters and when asked about a ballot question, 47% of them were in favor. Obtain a 99% confidence interval for the population proportion in favor of this ballot question (α = 0.005)
0.41252 < p < 0.52748
Calculations: p-hat ± z* SE p-hat ± z* √p(1-p)/n 0.47 ± (2.576) √(0.47) (0.53)/ 500 0.47 ± 0.05748
Interpretation:
We are 99% confident that the true proportion of voters who favor the ballot question lies between 41.3 and 52.7 %.
Slide13Sample Size Needed for Estimating the Population Proportion p
The sample size required to obtain a (1 – α) * 100% confidence interval for p with a margin of error E is given by
rounded up to the next integer, where p is a prior estimate of p.If a prior estimate of p is unavailable, the sample required is
z*
n
=
p
(1 - p) ------ E
2
z*
n
=
0.25
------
E
2
rounded up to the next integer. The margin of error should always be expressed as a decimal when using either of these formulas
Slide14Example 3
In our previous polling example, how many people need to be polled so that we are within 1 percentage point with 99% confidence?
MOE = E = 0.01
Z* = Z .995 = 2.575
z *n = 0.25 ------ E
2
2.575
n
= 0.25 -------- = 16,577 0.01
2
Since we do not have
a previous estimate, we use p = 0.5
Slide15Summary and Homework
Summary
Point Estimate (PE)
Margin of Error (MOE)
PE is an unbiased estimator of the population parameter
MOE is confidence level standard error (SE) of the estimator
SE is in the form of standard deviation /
√sample size
Homework
Problems 35, 37, 41, 43, 47